ASC Culture and sEV Isolation
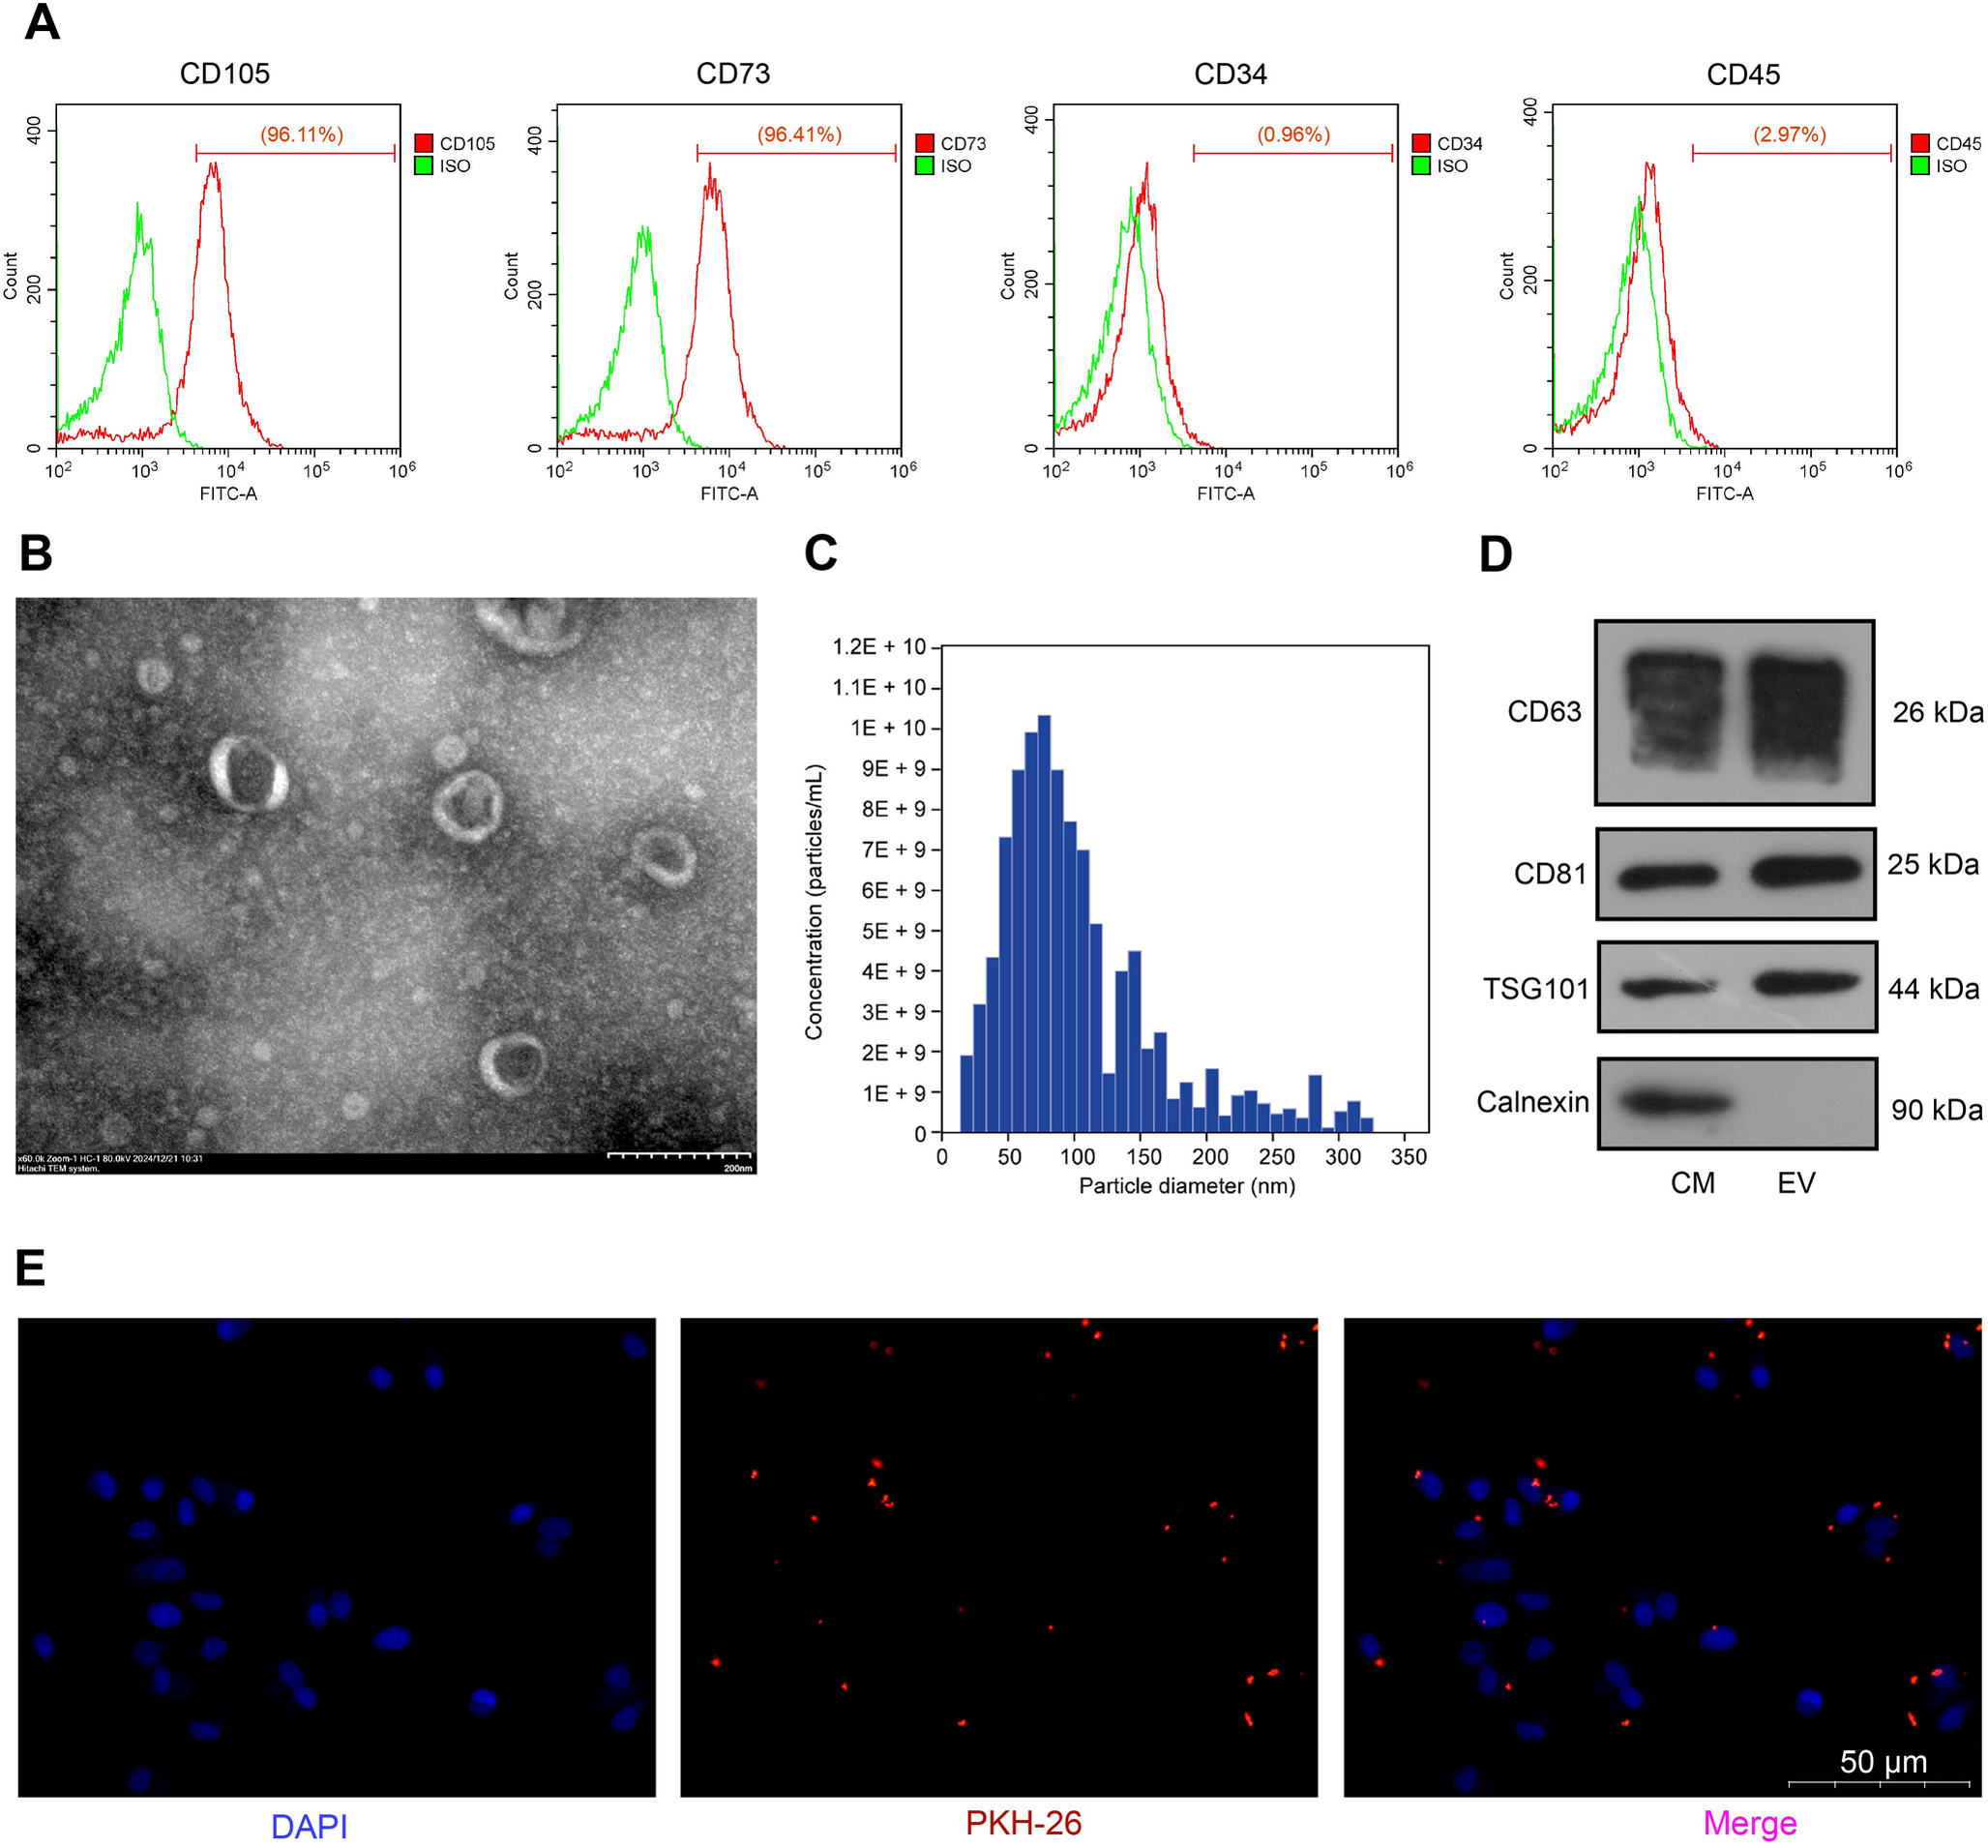
Human adipose derived mesenchymal stem cells (ASC) were purchased from ATCC (ASC52 telo, SCRC-4000) and cultured in low serum containing mesenchymal stem cell growth kit as per the manufacturer’s instructions as adherent cultures. ASC52 telo is an hTERT immortalized MSC line derived from the adipose tissue of a White female and extensively characterized for MSC phenotype (Choi et al. 2023; Wolbank et al. 2009; Mallard et al. 2023) and were not further characterized to avoid redundancy. Studies involving ASC were approved as an exempt study by UTHSC Institutional Review Board (16–04861-NHSR, 10/06/2016) and HRPO, US Army Medical Research and Materiel Command, in accordance with relevant guidelines and regulations following the tenets of the tenets of the Declaration of Helsinki. Cells were grown in T150 cm2 flasks as adherent cultures and maintained in a 37 °C incubator containing 5% CO2. Cells within the 5–15 passages were shown to exhibit the expected fibroblast-like morphology were used in the experiments. After reaching the confluency, cells were trypsinized (1X, TrypLE™ Express Enzyme) and seeded into T-75 flask at a density of 5 X 10³ cells/cm2 in MSC growth media. After 72 h post seeding, cells were washed twice with DPBS and proceeded with ASC-CCM preparation as described previously. Briefly, the growth medium was replaced with serum free MEM-alpha and cells were treated with 20 ng/ml TNFα and 10 ng/ml IFN\(\gamma\). Cells untreated with cytokines served as controls (unprimed). After 24 h post treatment with cytokines, ASC were washed twice with DPBS and replaced with serum free MEM-alpha medium for another 24 h. After 24 h, the conditioned medium was collected and centrifuged at 300 g for 5 min; supernatants were collected and filtered through a 0.22 µm filter. The filtered conditioned medium was concentrated using an Amicon Ultra centrifugal filter (3 kDa, MilliporeSigma, Burlington, MA, USA), ultra-centrifuged (Sorvall WX ultracentrifuges, ThermoFisher Scientific) in 12 ml tubes at 30,000 rpm (~ 1,00,000 g) for 2 h at 4 oC. EVs were obtained from the bottom 200 \(\mu\)l and identified as p-ASC-EV (EVs derived from ASC after cytokine stimulation) and up-ASC-EV (unprimed native EVs). Carefully supernatants were removed to collect the EVs, protein estimation was obtained using Qbit Fluorimeter (ThermoFisher Scientific), size was determined by dynamic light scattering (DLS) method (Zetasizer, Malvern Panalytical Ltd, UK), bilipid membrane morphology by transmission electron microscopy, and EV markers utilizing either in-house slot blots or Exo-Check Exosome Antibody Array (System Biosciences, Palo Alto, CA). To label EVs, sEVs were incubated with Vybrant™ DiI Cell-Labeling Solution (Thermofisher) for 30 min at RT for 30 min protected from light. The unbound dye was removed by ultracentrifugation at ~ 1,00,000 g for 1 h. The labeled pellet was washed with DPBS to eliminate unbound dye and proceeded with uptake studies.
TSG-6 Transient Transfection (Over Expression) of ASC and sEV Isolation
ASC cultured in mesenchymal stem cell growth kit were trypsinized and collected into serum free basal media were seeded into T-75 flask (~ 4 million cells in 10 ml media) and incubated with Lipofectamine™ RNAiMAX Transfection Reagent combined with 2\(\mu \gamma\) of TSG6 Human Tagged ORF Clone (TNFAIP6, NM_007115, CAT#: RG206510, OriGene Technologies, Inc., Rockville, MD) for 5 min. Following this, mesenchymal stem cell growth kit media was added, and the cells were incubated in a 37 °C incubator containing 5% CO2. After 48 h of transfection, ASC was washed twice with DPBS and replaced with serum-free MEM-alpha medium for another 24 h. After 24 h, the conditioned medium was collected and proceeded to isolate sEVs by ultracentrifugation method as described above. The top 3 ml was considered as non-vesicular secretome (TSG-6-ORF-NV), while the bottom 200 \(\mu\)l was considered sEV fraction (TSG-6-ORF-EV).
As an additional method to purify and characterize sEVs, extracellular vesicles were isolated by size exclusion chromatography (SEC) followed by protein digestion and mass spectrometry analysis. Briefly, 50 ml of ASC-conditioned media with and without TSG-6 overexpression was concentrated and buffer-exchanged into Dulbecco’s phosphate-buffered saline (DPBS, Catlog#14190144, Thermofisher) using Amicon Ultra-15 centrifugal filters with a 10 kDa molecular weight cutoff (Catalog# UFC9010, Millipore Sigma). EVs were then isolated and purified from smaller biomolecules using qEV35 Gen2 SEC columns with an automated fraction collector (Izon Science, www.izon.com). A total of 0.5 mL of the concentrated medium was loaded onto the column, followed by the addition of DPBS. The first 3 mL, corresponding to the column void volume, was discarded. Subsequently, twelve 0.5 mL fractions were collected. Protein concentration in each fraction was measured using a Qubit protein assay and a Qubit fluorometer (ThermoFisher Scientific).
For downstream proteomic analysis, 10 µg of each sample was precipitated on ice for 1 h with trichloroacetic acid at a final concentration of 20%, centrifuged at 14,000 g for 30 min, washed and centrifuged at 14,000 g for 30 min twice with ice-cold acetone, air-dried, and stored at −20 °C until further processing. Protein samples were resuspended in 8 M urea in 100 mM Tris pH 8.5 and then digested using the protein aggregation capture method (Batth et al. 2019). The digested peptide solution was fractionated online using reversed phase chromatography and eluted directly into an Orbitrap Astral mass spectrometer (ThermoFisher) (Stewart et al. 2023). MS/MS spectra were collected using a data-independent analysis (DIA) acquisition method and subsequently analyzed using the DIA-NN algorithm (Guzman et al. 2024; Demichev et al. 2020). Peptide and protein identifications were filtered using an estimated false discovery rate of less than 1%. Pearson correlation coefficients were calculated for the comparison of each proteome’s spectral intensities. GOrilla was used for gene ontology (GO) enrichment analysis (GOrilla) (Eden et al. 2009). Proteomes were analyzed for common exosome markers, and the inclusion and exclusion markers were defined as described previously (Kugeratski et al. 2021). Z-score-transformed protein spectral intensities were used for heatmap visualization.
Slot-Blot Analysis
Expression levels of EV markers (CD63, Alix and TSG6101) as well as TSG-6 were analyzed using Slot blot plate method (Catalog# 170–6542, Bio-slot SF, BIO-RAD) according to manufacturer instruction. Briefly, 20 µg of protein samples (40 µg of protein for Alix) were subjected to slot-blot analysis by loading samples onto a nitrocellulose membrane (Catalog# 1620161, BIO-RAD) with gentle vacuum. Antigen bound nitrocellulose membranes were then blocked with 3% BSA in 1X TBS (Tris-Buffer Saline, Catalog# BP2471-1, Fisher Bioreagents). Followed by washing with TBST (137 mM NaCl, 2.7 mM KCl, 20 mM Tris, pH7.4, plus 0.1% Tween-20), the membrane was incubated overnight with CD63 (1:500, Catalog#10628D, Thermofisher), Alix (1:500, Catalog#MA183977, Thermofisher), TSG101 (1:500, Catalog#MA123296, Thermofisher), GM130 (1:500, Catalog#MA535107, Thermofisher) and TSG6 (1: 500 R&D Systems, Cat.# AF2104). After washing with TBST, the membranes were incubated with HRP labeled secondary antibodies (1:1000, 2 h). After washing with TBST, the membranes were developed using SuperSignal™ West Pico PLUS Chemiluminescent Substrate (Thermofisher) and imaged with Odyssey infrared imager (LI-COR Biosciences) to visualize the protein bands. In studies utilizing Exo-Check™ Exosome Antibody Array, manufacturer’s instructions were followed.
BV2 Cell Culture and Treatment Protocol
The mouse microglial cell line, BV2, was a kind gift from Professor Grace Sun, PhD, University of Missouri, Columbia, MO, USA. BV2 cells were cultured in DMEM containing 10% FBS and 1% penicillin–streptomycin. After reaching the confluency cells were trypsinized, counted and seeded at a density of 1 × 10⁴ cells/well of a 96-well plate. After 24 h media was aspirated, cells were washed with PBS and preincubated with unprimed (up-ASC-EV), p-ASC-EV (cytokine primed), TSG-6 overexpressed exosome (TSG-6-ORF-EV) and non-vesicular secretome (TSG-6-ORF-NV) fraction in serum free media (SFM) for 6 h. In some experiments, carrier free recombinant TSG-6 protein (Catalog # 2326-TS or Catalog # 2104-TS | R&D Systems, Inc) was utilized. Following this, cells were treated with LPS 100 ng/ml (Catalog# 10,602-HMAE, Sino Biological Inc.) and 10 ng/ml IFN\(\gamma\) (Catalog# 315-05100UG, PEPROTECH) for 12 h. Cell supernatant and cell lysate were collected for Griess assay and RT-PCR, respectively. To determine if BV2 cells uptake sEVs, sEVs were pre-labeled with Vybrant™ DiI Cell-Labeling Solution (Thermofisher) and incubated with 1 × 10⁴ BV2 cells on 10 mm coverslips for 2 h and imaged them using Lionheart™ FX Automated Microscope (Biotek US., Winooski, VT, USA).
CD44 Knockdown in BV2 Cells
To knockdown CD44 expression, BV2 cells were seeded at 1 × 10⁴ cells/well of a 96-well plate. After 24 h, cells were transfected for 48 h with 20 nM CD44 siRNA (Catalog#AM16708, Assay ID# 165,813, Life technologies corporation) with sense: 5`- CCAUGGACCAAAUGAAGUUTT-3´ and anti-sense: 5`- AACUUCAUUUGGUCCAUGGTG -3` nucleotides targeting the exon number 2 of transcript NM_001039150.1. Lipofectamine™ RNAiMAX Transfection Reagent alone served as transfection control. After 48 h, cells were washed with PBS and pre-incubated with sEVs or non-vesicular secretome in SFM for 12 h, then challenged with 100 ng/ml LPS and 10 ng/ml IFN\(\gamma\) for 6 h. Cell supernatant and cell lysate were collected for Griess assay and RT-PCR, respectively.
Nitric Oxide Release Assay
The nitrite amount in conditioned medium was assessed by Greiss Reagent System according to the manufacturer’s instructions (Promega, Madison, WI, USA) as described previously (Jha, et al. 2018).
Phagocytosis Assay
BV2 cells were seeded at 2 × 10⁴ cells on 10 mm coverslips in a 24-well plate. After 24 h cells were washed with PBS and pre-incubated with unprimed (up-ASC-Exo), p-ASC-Exo (cytokine primed), TSG-6 overexpressed EV (TSG-6-ORF-EV) and non-vesicular secretome (TSG-6-ORF-NV) in SFM for 6 h, then challenged with LPS and IFN\(\gamma\) for 4 h. In some experiments involving CD44 knockdown, BV2 cells were transfected with CD44 siRNA for 48 h prior to incubating the cells with sEVs or non-vesicular secretome. Following this, BV2 cells were washed with 1X PBS, incubated with Flurophores™-carboxylate red, 580/605 (Catalog# F8812, Invitrogen) for 2 h at 37 °C. After a brief wash to remove excess Fluorophores, cells were fixed with 4% buffered paraformaldehyde for 10 min, washed with PBS, permeabilized with 0.5% Triton in 1X PBS, labelled with actin phalloidin green in serum buffer (5 ml FBS, 45 ml 1X PBS, 200 \(\mu\)l of 5% Sodium azide). Finally, cells were washed with PBS, labeled with Hoechst (Catalog# H3570, Life Technologies, 1:1000 dilution) for 5 min. Coverslips were lifted from 24-well plate, mounted on slide and images were captured using Lionheart™ FX Automated Microscope (Biotek US., Winooski, VT, USA) with a 40 × objective. The number of Fluorospheres were quantitated in a blinded fashion from five images per treatment and averaged the number of fluorophores to the total number of cells counted to express phagocytosis index.
RT-PCR
RNA was isolated from ASC after transfection of TSG-6 ORF clones or from BV2 cells after various treatments using NucleoSpin® RNA Plus kit (Macherey–Nagel GmbH, Takara Bio USA), following the manufacturer’s protocol. Subsequently, about 250 ng of total RNA from each sample was converted to cDNA using High-Capacity cDNA Reverse Transcription Kit (Thermo Fisher Scientific). The resulting cDNA sample served as a template for real-time qPCR using TaqMan probes or Sybergreen primers (Table 1) and accompanying Master Mix (Applied Biosystems, Foster City, CA). PCR amplification was carried out using Quantstudio3 (Applied Biosystems) system with cycle conditions of the initial cycle: 50 °C for 2 min, and initial denaturation at 95 °C for 15 s. This was followed by 40 cycles of denaturation at 95 °C for 15 s, and annealing/extension of 60 °C for 1 min. The expression levels of target gene transcripts were determined using 2 − DDCt method and normalized to 18S rRNA.
Table 1 Taqman probes and Sybr green PCR assay primersStatistical Analysis
Data are presented as mean ± SEM from a single experiment repeated 2–3 times independently. For all quantitative experiments, statistical analyses were performed with one-way ANOVA followed by student t-tests. A p-value of < 0.05 was considered statistically significant. Data were analyzed for statistical interpretation using Microsoft Excel statistical package or Prism 9 software: GraphPad Software, La Jolla, CA.

Comments (0)