
Remember me
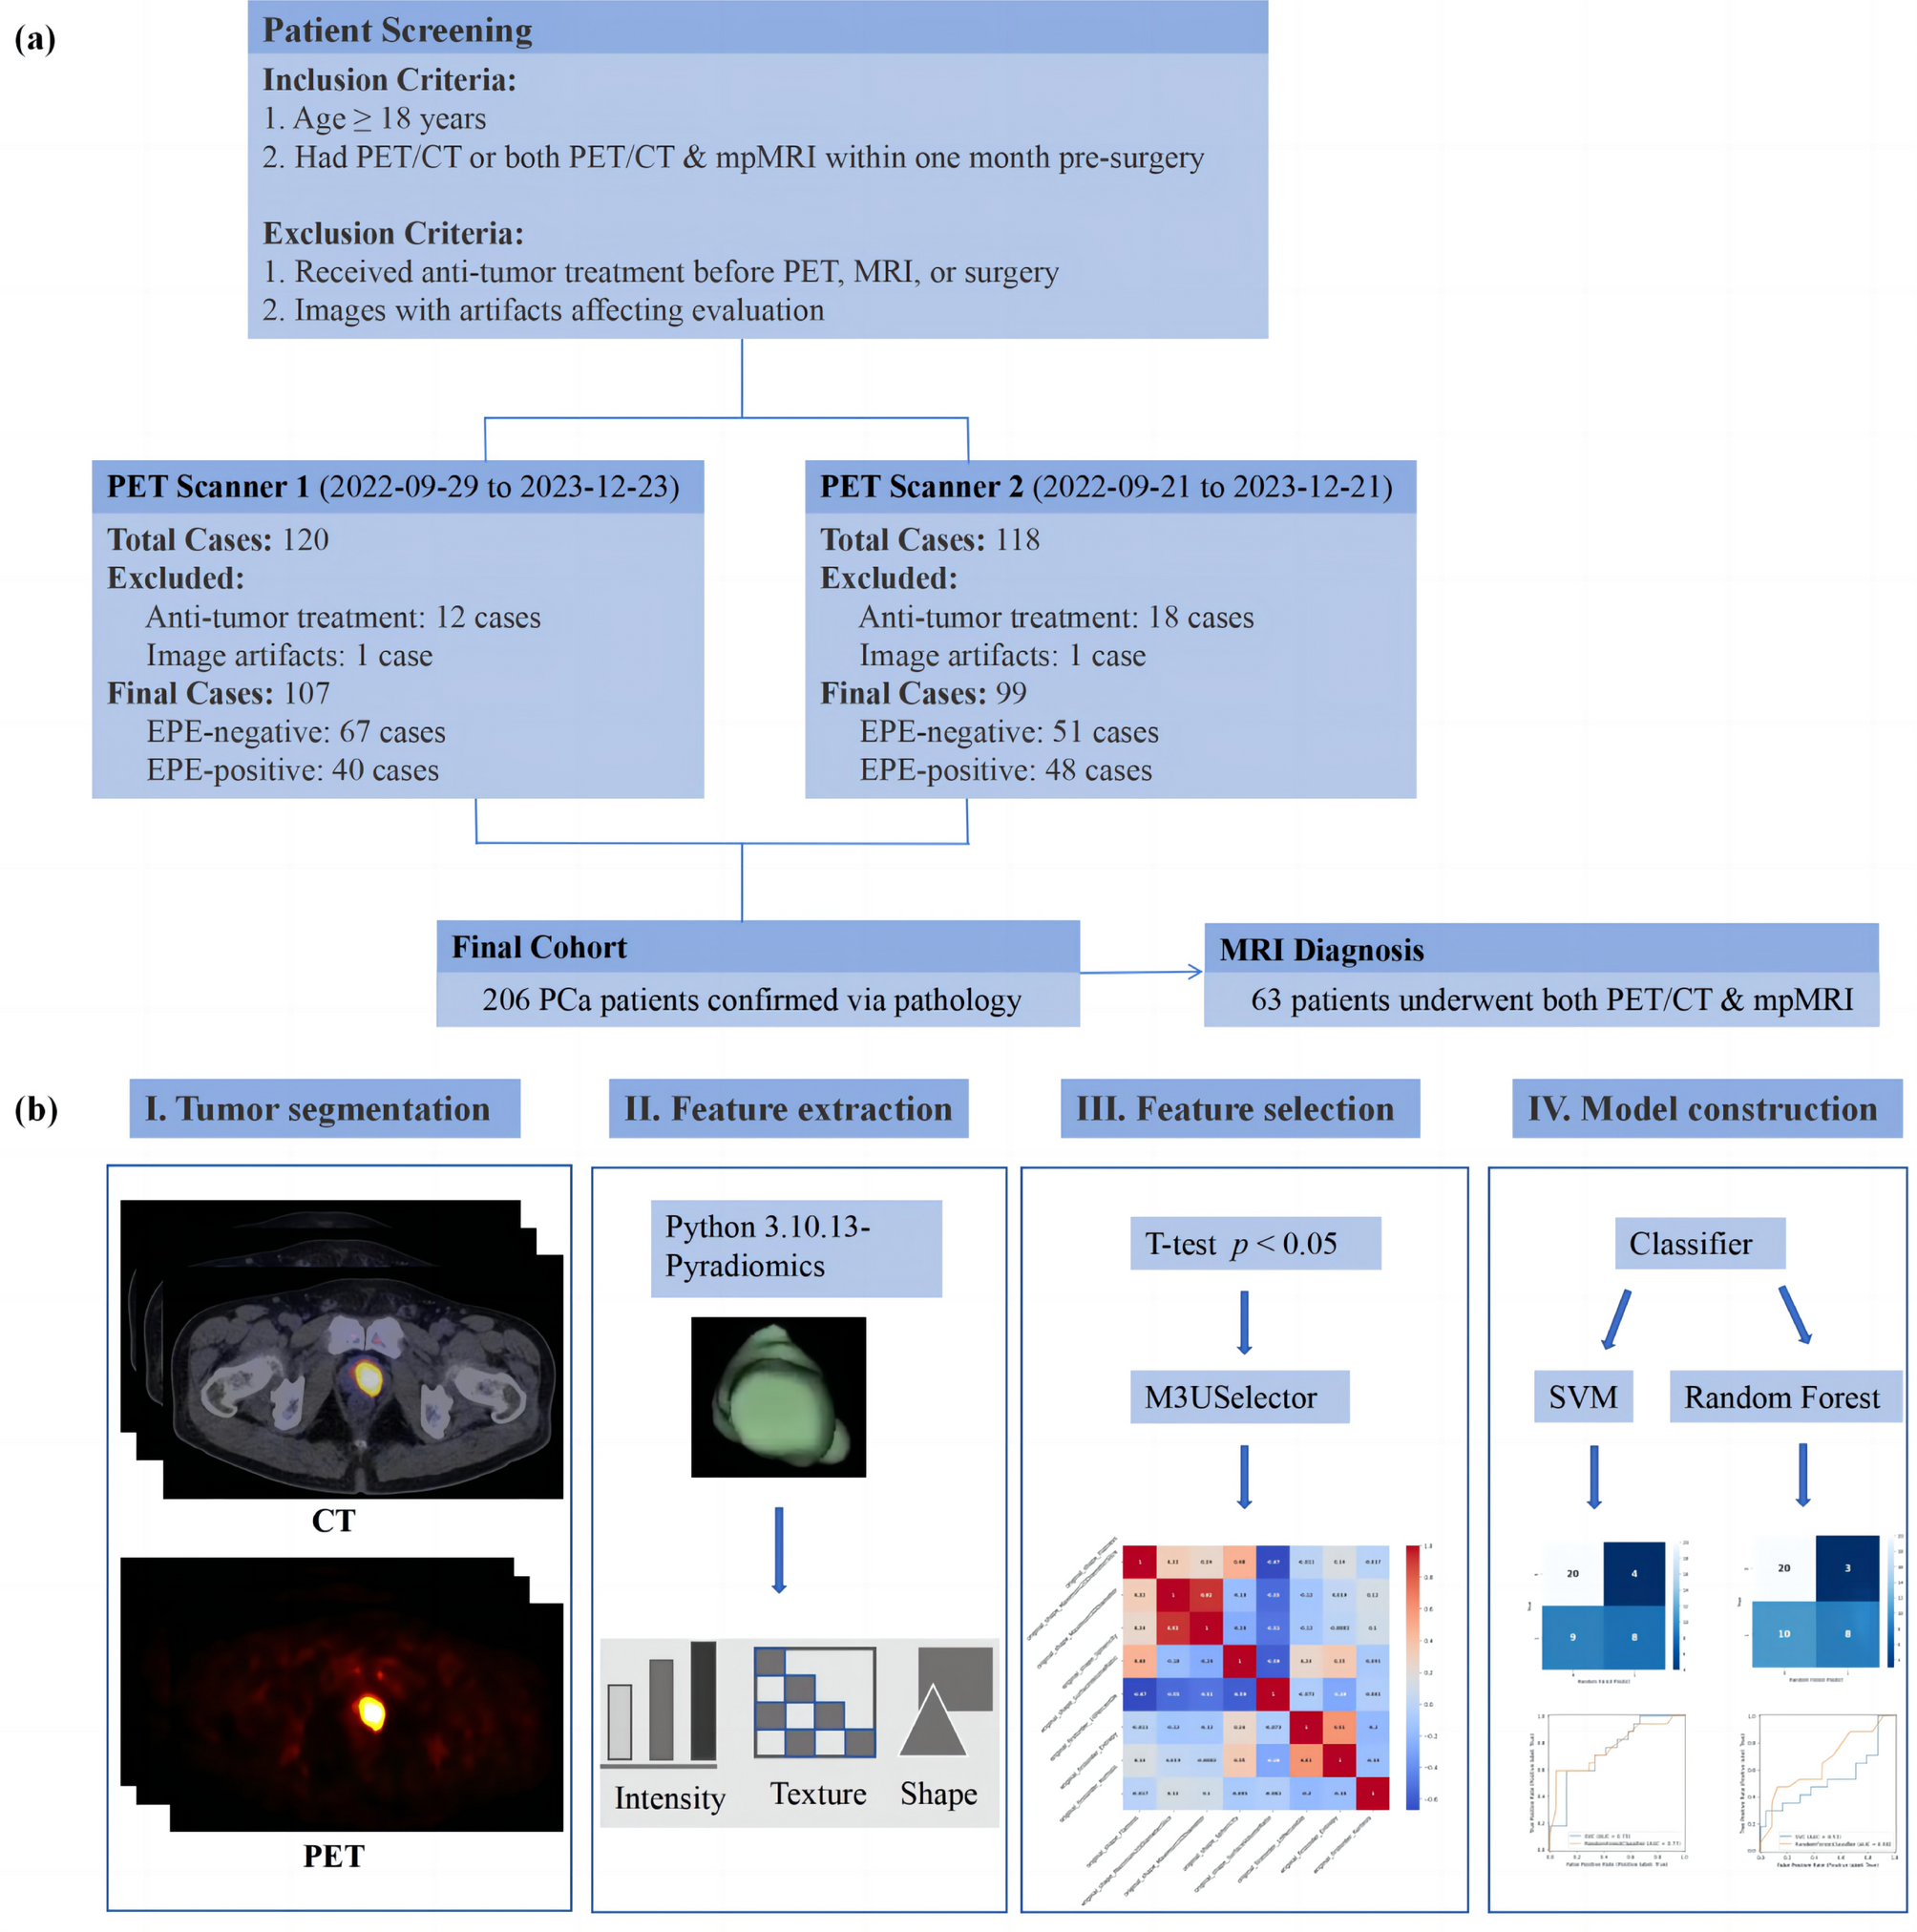

This study included a total of 206 patients with pathologically confirmed prostate cancer (PCa) after radical surgery (88 with EPE-positive and 118 with EPE-negative). Among them, 63 patients underwent both 18F-PSMA-1007 PET/CT and mpMRI (25 with EPE-positive and 38 with EPE-negative). Detailed information on patient age, BMI, PSA levels, Biopsy ISUP grade, and positive biopsies can be found in Table S1.
Performance of the radiomics modelsDetails of the feature selection process and the specific features retained for each modality are provided in Appendix E4. We evaluated the performance of two machine learning classifiers, Support Vector Machine (SVM) and Random Forest, in predicting EPE across different modalities (Table 1; Fig. 2). Detailed Experimental Results are provided in Appendix E5.
Single-modality PET and CT featuresPET Features: Before feature selection, the Random Forest model and the SVM model performed similarly with PET features. The former achieved an average AUC of 0.74, accuracy of 0.66, specificity of 0.79, sensitivity of 0.48, NPV of 0.67, and PPV of 0.63, while the SVM model had an average AUC of 0.74, accuracy of 0.67, specificity of 0.87, sensitivity of 0.38, NPV of 0.66, and PPV of 0.69. After feature selection, the Random Forest improved in AUC (0.75), accuracy (0.71) specificity (0.81), sensitivity (0.59), NPV (0.73), and PPV (0.69). However, the AUC of the SVM model slightly decreased to 0.72, while other metrics of the SVM model slightly improved with an accuracy of 0.68, specificity of 0.89, sensitivity of 0.39, NPV of 0.67, and PPV of 0.73.
CT Features: SVM model outperformed the Random Forest model before and after feature selection processes. After feature selection, the SVM model’s average AUC improved from 0.59 to 0.61, accuracy increased from 0.61 to 0.62, specificity remained at 0.98, sensitivity increased from 0.13 to 0.14, NPV increased from 0.60 to 0.61 and PPV remained at 0.70. In contrast, Random Forest model’s AUC increased from 0.53 to 0.61, accuracy improved from 0.53 to 0.59, specificity increased from 0.70 to 0.74, sensitivity increased from 0.30 to 0.39, NPV increased from 0.57 to 0.62, PPV increased from 0.49 to 0.53.
Multi-modality PET and CT featuresConcatenated PET and CT Features: After concatenating PET and CT features, the performance of both SVM model and Random Forest model improved. After feature selection, the SVM model’s average AUC increased from 0.69 to 0.72, accuracy improved from 0.63 to 0.68, sensitivity increased from 0.17 to 0.39, NPV increased from 0.62 to 0.67, while specificity decreased from 0.97 to 0.89, PPV decreased from 0.87 to 0.73. The Random Forest model’s average AUC increased from 0.73 to 0.75, accuracy improved from 0.67 to 0.71, specificity remained at 0.81, sensitivity increased from 0.48 to 0.59, NPV increased from 0.68 to 0.73, PPV increased from 0.66 to 0.69.
Averaged PET and CT Features: After averaging PET and CT features, Random Forest model outperformed the SVM model. After feature selection, the Random Forest model achieved an average AUC of 0.77, accuracy of 0.71, specificity of 0.81, sensitivity of 0.59, NPV of 0.73, and PPV of 0.69, while the SVM model had an average AUC of 0.61, accuracy of 0.61, specificity of 0.91, sensitivity of 0.20, NPV of 0.61, and PPV of 0.80.
Table 1 EPE prediction performance across different modalities and classifiersFig. 2
This figure is a heatmap showing the performance metrics (Accuracy, AUC, Specificity, Sensitivity, NPV, and PPV) across different modalities, classifiers, and feature selections
Performance of three independent readersIn this study, three readers independently assessed the extracapsular extension (EPE) of peripheral lesions using the Mehralivand grading system and analyzed its diagnostic performance.
Table 2 presents the diagnostic performance of three readers in assessing EPE using the Mehralivand grading system. The results show that Reader 1 had an AUC of 66.8%, sensitivity of 60.0%, specificity of 73.7%, accuracy of 68.3%, PPV of 60.0%, and NPV of 73.7%. Reader 2 had an AUC of 63.5%, sensitivity of 56.0%, specificity of 71.1%, accuracy of 65.1%, PPV of 56.0%, and NPV of 71.1%. Reader 3 had an AUC of 60.2%, sensitivity of 52.0%, specificity of 68.4%, accuracy of 61.9%, PPV of 52.0%, and NPV of 68.4%.
Table S2 further analyzes the positive predictive value (PPV) for different Mehralivand grades. For grade 0, the PPVs for the three readers were 73.6%, 71.1%, and 68.4%, respectively; for grade 1, the PPVs were 47.1%, 44.4%, and 42.1%; for grade 2, the PPVs were 85.7%, 83.3%, and 80.90%; and for grade 3, the PPV was 100% for all three readers.
Table 2 Diagnostic performance of three readers and the radiomics model in assessing EPE, with AUC comparisons using delong’s testComparison of radiomics model performance with radiologist performanceTo directly compare radiomics-based prediction with conventional MRI evaluation, a subset of 63 patients who underwent both 18F-PSMA-1007 PET/CT and mpMRI was selected from the full cohort. The radiomics model, developed using the full dataset of 206 patients, was applied to this subset. Using the radiomics model constructed with averaged PET and CT features and a Random Forest classifier, the model achieved an AUC of 76.8% (95% CI: 64.4%, 86.5%), sensitivity of 72.0%, specificity of 81.5%, accuracy of 77.8%, PPV of 72.0%, and NPV of 81.6%.
In contrast, three radiologists evaluated the same 63 cases using the Mehralivand grading system on mpMRI. Their AUCs were 66.8%, 63.5%, and 60.2%, respectively. DeLong’s test showed that the radiomics model significantly outperformed all three readers, with p-values of 0.013, 0.003, and 0.001, respectively (Table 2). These findings suggest that PSMA PET/CT-based radiomics provides superior diagnostic performance in predicting EPE compared to MRI-based visual assessment.
Comments (0)