
Remember me

This retrospective study was approved by our Hospital Institutional Review Board and written informed consent was waived by the Declaration of Helsinki (M2020435).
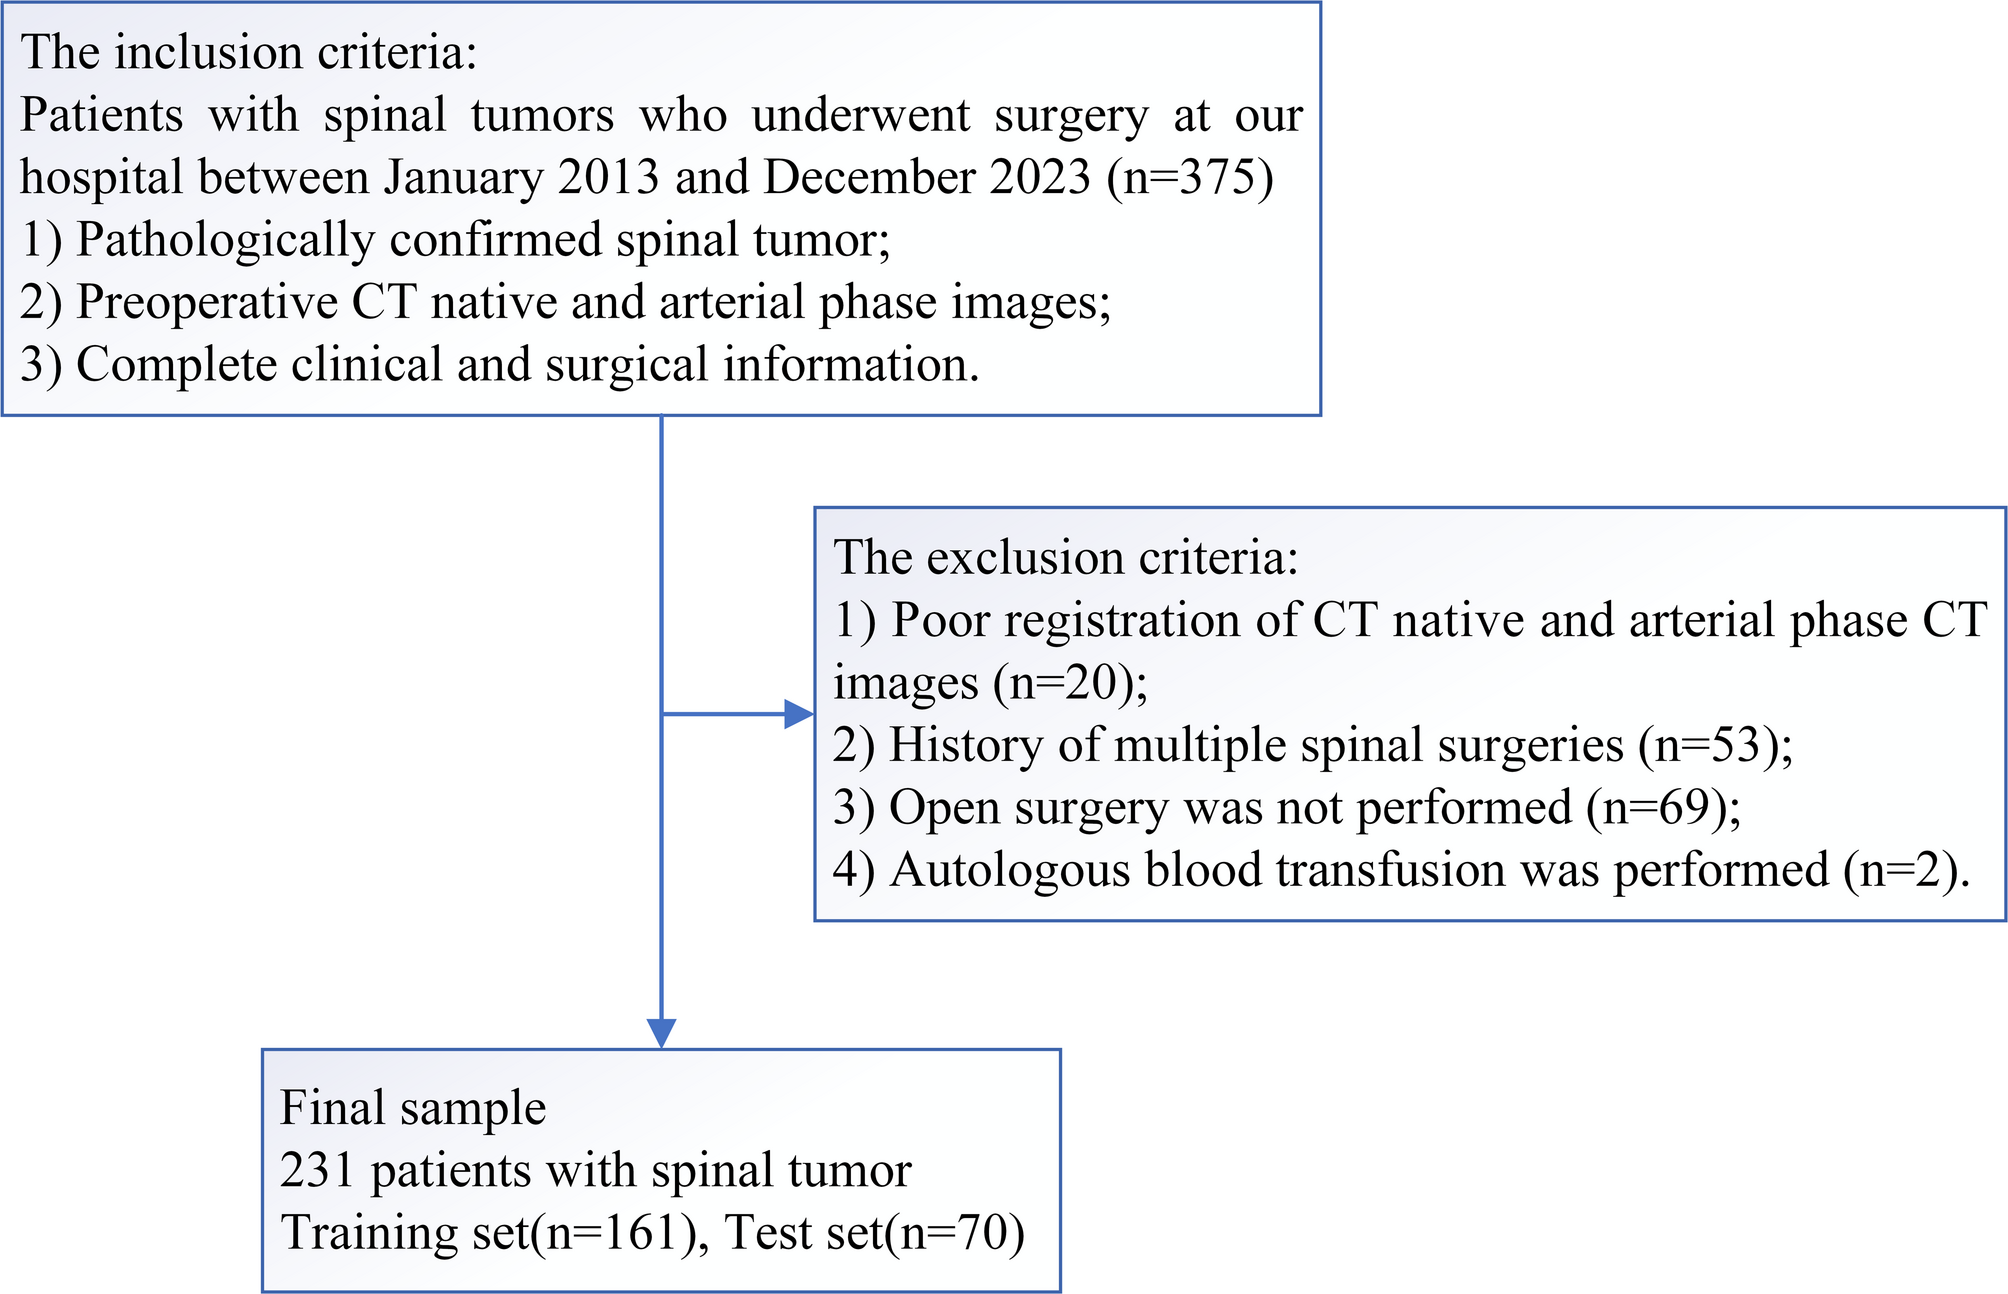
Study patientsPatients with spinal tumors who underwent surgery at our hospital between January 2013 and December 2023 were included in this study. The inclusion criteria were as follows: pathologically confirmed spinal tumor; complete preoperative CT native phase and CT arterial phase images; and complete clinical and surgical information. The exclusion criteria were as follows: poor image registration; history of multiple spinal surgeries; not performed open surgery; and autologous blood transfusion. The clinical and imaging data of the patients were collected from medical records and imaging archives.
Clinical characteristics and radiographic assessmentClinical variables included age, sex, preoperative albumin and hemoglobin levels, platelet count, preoperative embolization status (yes or no), tumor type (primary or secondary), and pathological classification of biopsy specimens (benign or malignant). All clinical indicators were measured before surgery, with the values being recorded as close as possible to the day of the operation to minimize any temporal discrepancies. Radiographic characteristics included tumor location (lumbosacral or other), number of affected segments (single or multiple), and tumor size (axial maximum long and vertical short diameter). Radiographic assessments were carried out using preoperative imaging performed within two weeks before surgery. Three readers (with 12, 7, and 5 years of musculoskeletal imaging experience) independently reviewed all images in a blinded manner to assess radiographic characteristics. Any disputes were resolved by a majority vote.
The first primary outcome was IBT, which was defined as the intraoperative administration of one or more units of allogeneic blood based on a joint decision by the anesthesiologist and surgeon. The second primary outcome was IMB, which was defined as an estimated blood loss of ≥ 2500 mL [5]. Intraoperative blood loss can be estimated by an anesthesiologist using the outputs from the suction canister and irrigation volumes recorded at the end of surgery. Alternatively, the theoretical total blood loss can be calculated using the following formula: estimated blood loss (mL) = (preoperative or estimated hematocrit - measured hematocrit) / preoperative or estimated hematocrit × body weight (kg) × 7% × 1000.
CT study protocolsDuring this study, we utilized spine (cervical, thoracic, lumbar) scan protocols and selected CT native phase and arterial phase images. The imaging parameters are listed in Supplementary Material 1.
Image registration and segmentationThe radiomics feature extraction workflow is shown in Fig. 1. The CT native phase and arterial phase images had identical positioning, and the start and end points were consistent, allowing for automatic image registration. Using ITK-SNAP software (version 3.8.0; the University of Pennsylvania and University of Utah). We defined the Region of Interest (ROI) to encompass the entire tumor mass, including both the osseous and extraosseous components, based on preoperative CT imaging. Reader 1 simultaneously manually delineated the tumors on axial CT native phase and arterial phase images and repeated segmentation twice within 1 week to assess feature stability. Reader 2 randomly selected 60 patients, initially performed independent segmentation, and then performed simultaneous segmentation to verify the consistency of the image features observed during independent and simultaneous segmentation. If the difference was ≥ 5%, reader 3 redefined the tumor boundaries. Radiomics features were evaluated using the intra-class correlation coefficient (ICC), and features with an ICC > 0.80 were retained.
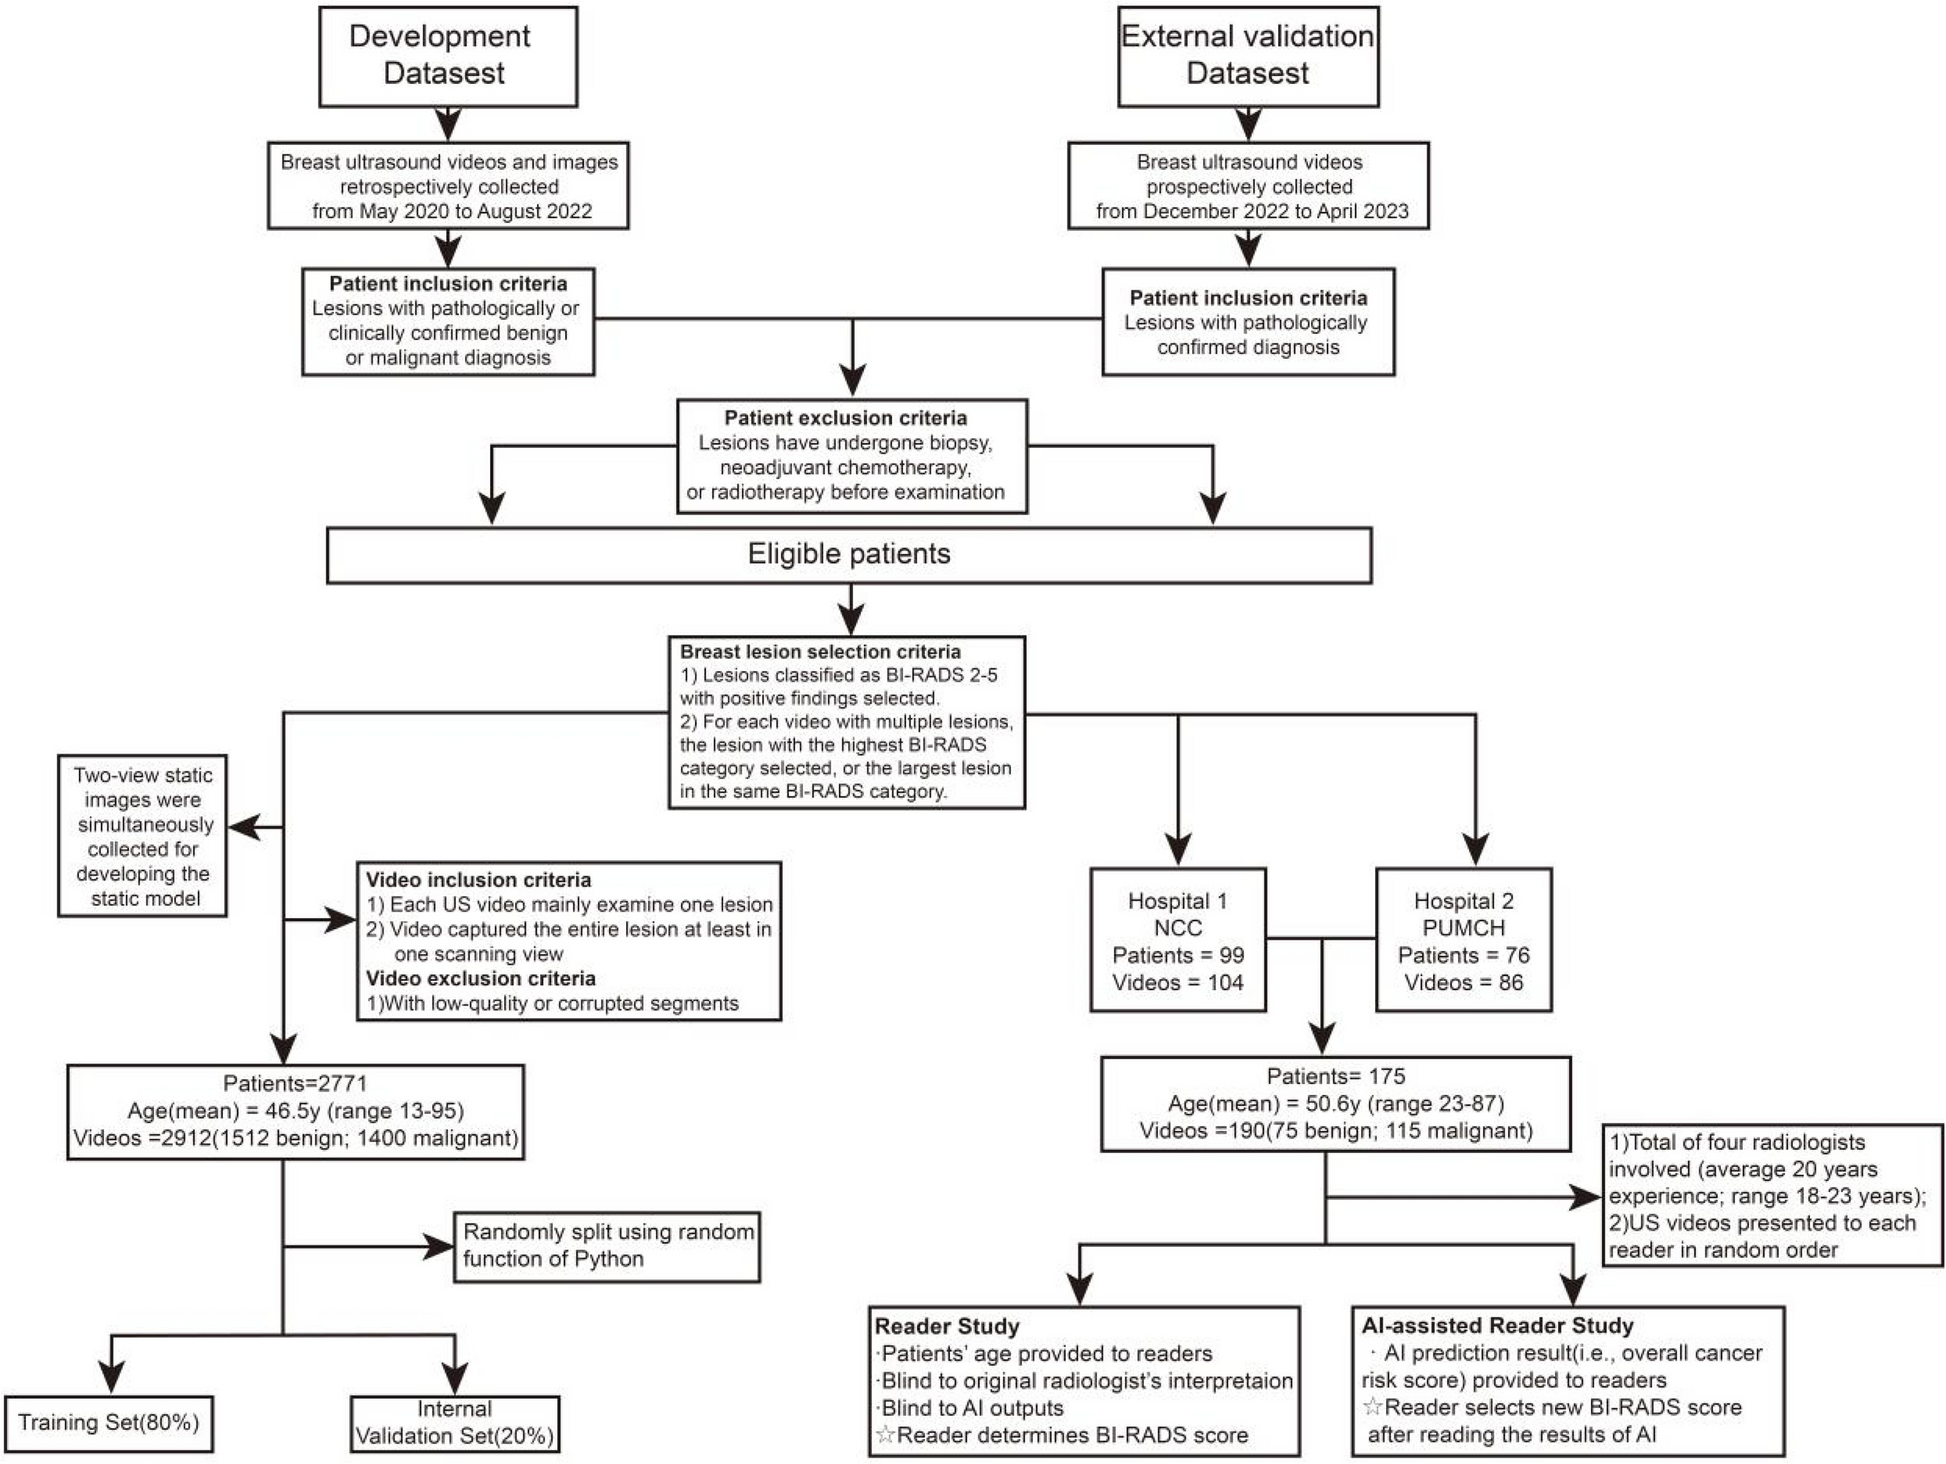
Fig. 1
Flowchart of patient inclusion
Radiomics features extractionBefore radiomics features were extracted, the images were standardized by adjusting the standard deviation to 100, resampling the volumes of interest on CT to uniform 1 × 1 × 1 mm voxels using linear interpolation, and preprocessing the CT images with all features set to a bin width of 10 HU. Radiomics features were extracted using the PyRadiomics Python package (version 2.2.0) [19]. Radiomics features encompass the grey level co-occurrence matrix (GLCM), first-order grey level run length matrix (GLRLM), grey level size zone matrix (GLSZM), grey level dependence matrix (GLDM), neighboring grey tone difference matrix (NGTDM), and shape from the segmentation regions for each MRI. Specifically, GLCM measures spatial interdependencies between voxels that display differing grey levels; GLRLM identifies the distribution of consecutive voxels that share the same grey level values throughout the image; GLSZM represents the distribution of size zones within the image; GLDM counts neighboring voxels with specific grey level differences; NGTDM calculates the grey level value discrepancy between a voxel and its surrounding counterparts’ mean values. The first-order technique outlines the voxel intensity distribution in the image region designated by the mask using standard statistical measures, whereas shape features relate to the geometric characteristics of the specific area, which entail factors such as volume, surface area, compactness, sphericity, and other relevant aspects [20].
The delta radiomics features were defined as the relative net change of radiomics features between arterial phase images (a) and native phase images (b): i.e., delta radiomics features = (a - b) / b [21].
Feature selection and classification methodsTo avoid multicollinearity and minimize the risk of overfitting when dealing with high-dimensional radiomics features, each radiomics feature was normalized [Z=(x-mean)/standard deviation] and standardized, and the batch effects were then removed. Next, Student’s t-tests of the features were performed, and all features with p < 0.05 were retained. To address multicollinearity among the features, we conducted a redundancy analysis (using Pearson or Spearman methods) and eliminated features with a correlation coefficient > 0.65.
For logistic regression (LR), the least absolute shrinkage and selection operator (LASSO) was employed for feature selection, as it imposes a penalty on the number of features and helps mitigate multicollinearity. The final selected features were then used to refit a non-penalized LR model to better interpret the linear relationships between features and outcomes. For random forest (RF), recursive feature elimination was applied to select important features based on the ability of the model to handle non-linear interactions and feature importance. Finally, LR, RF, and support vector machine (SVM) classification algorithms, along with 10-fold cross-validation, were used to identify the most predictive features from the training cohort.
Prediction models developmentUnivariate and multivariate analyses were conducted to identify the clinical and radiographic factors associated with IBT and IMB during spinal tumor surgery. To reduce the uncertainty of random grouping and balance the accuracy and complexity of the models, models were constructed using LR, RF, and SVM for the training cohort. The radiomics score of each sample was then calculated based on the regression model coefficients and the importance-ranked radiomics features. Ultimately, CT, CTE, and delta models were developed and combined with clinical models to predict the risks of IBT and IMB for spinal tumor patients, and the corresponding nomograms were constructed.
Statistical analysisStatistical analyses were performed using SPSS software (Version 26.0; IBM et al., N.Y., USA) and R software (version 4.4.0; https://www.r-project.org). Continuous variables were summarized using mean ± standard deviation, while categorical variables were expressed as frequencies and percentages. Continuous variables (Age, HB, and ALB) were compared using the independent samples t-test or the Mann–Whitney U test. Categorical variables were compared using the chi-square test or the Fisher test. To identify independent predictors of intraoperative transfusion and massive intraoperative bleeding, we conducted univariate and multivariate logistic regression analyses. Variables with a p-value < 0.05 in univariate analysis were included in the multivariate model to determine independent risk factors. Diagnostic efficacy was evaluated using the area under the receiver-operating characteristic curve (AUC), integrated discrimination improvement (IDI), accuracy, sensitivity, specificity, positive predictive value, and negative predictive value. The Youden index (i.e., maximizing “sensitivity + specificity − 1”) was used to optimize the cutoff point for dichotomizing model predictions into binary categories. Calibration curves and a decision curve analysis were used to assess the clinical utility of the nomograms of the validation cohort. The packages in R software involved in this study are shown in Supplementary Material 2.
Comments (0)