
Remember me
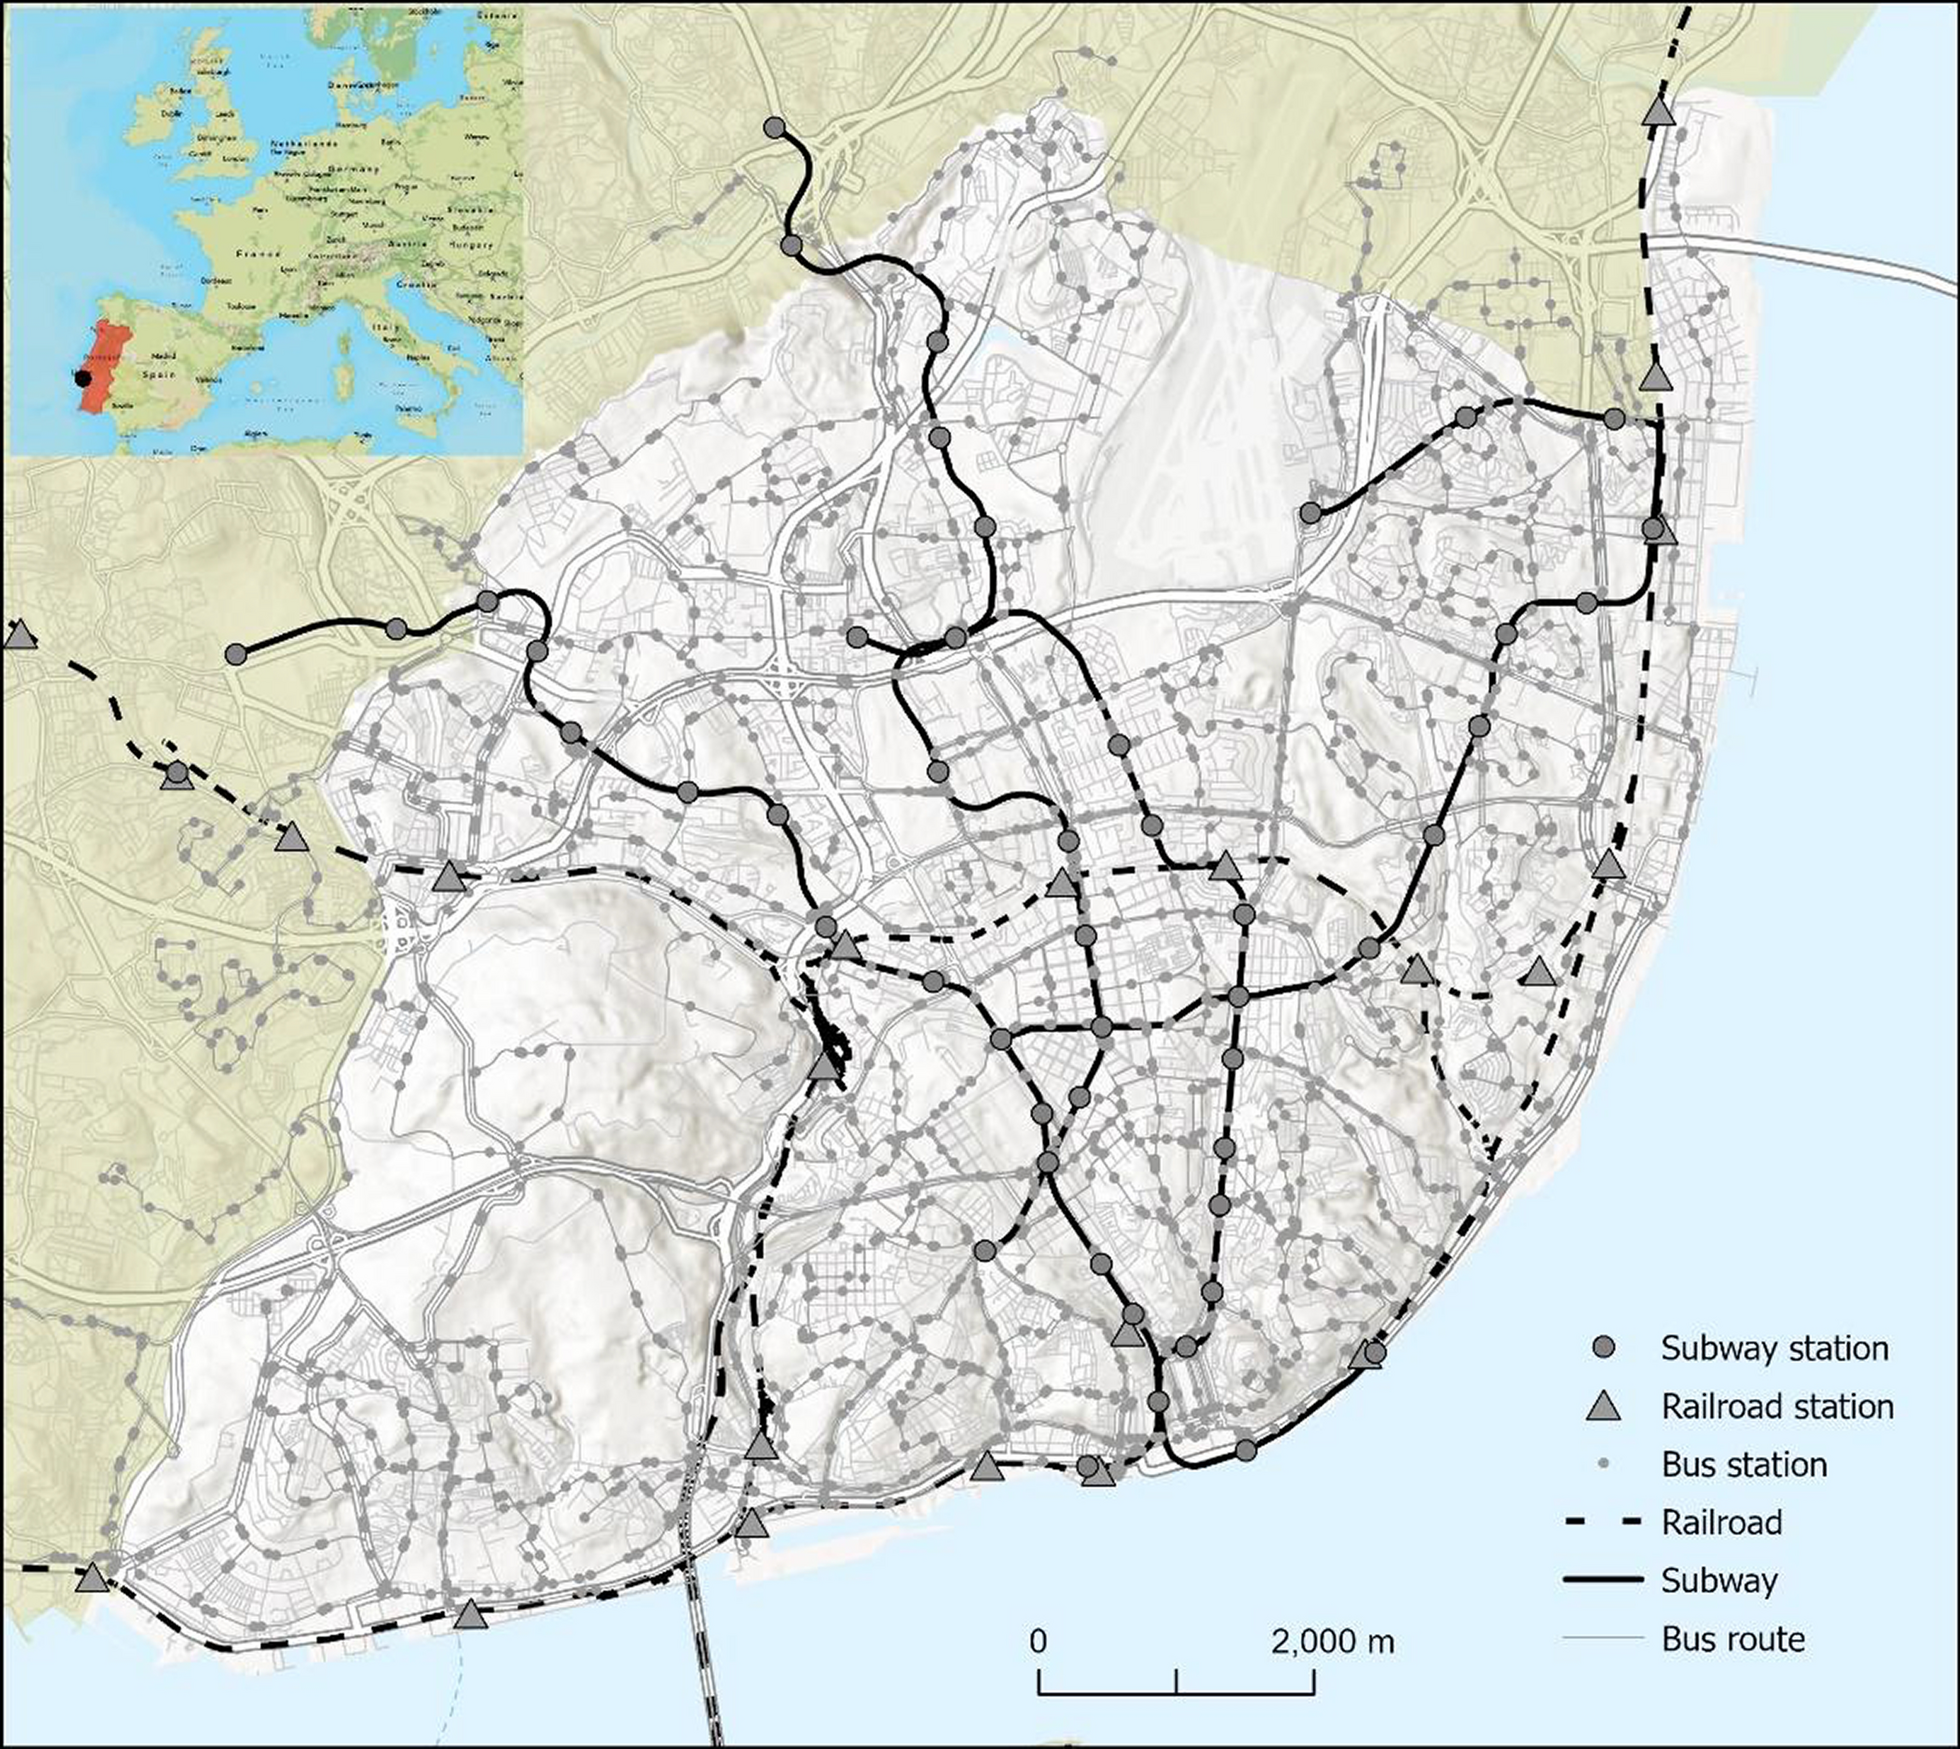

The study area of this research is Lisbon, the capital of Portugal, renowned for its advanced urban development. The Lisbon municipality covers approximately 100 km2 and is divided into 24 parishes (Fig. 1). It exhibits significant social diversity and holds relevant national importance. According to the National Institute of Statistics (INE), Lisbon’s resident population has been steadily declining since 1981. In 2021 Lisbon had about 545.142 inhabitants [20], of whom about 23% were 65 years old or older, making it one of the Portuguese municipalities with highest proportion of elderly residents. These demographic characteristics make Lisbon an important case study for assessing accessibility to essential healthcare services, particularly for older populations. Additionally, Lisbon's population is concentrated in its historic residential districts, with urban expansion along major thoroughfares connecting neighboring municipalities.
Fig. 1
Lisbon boasts a well-established transportation network encompassing diverse modes of travel. It is served by a varied transport network including the subway, trams, buses and trains. Indeed, the city center is connected to the upper and eastern districts, as well as some suburbs that are part of the Lisbon metropolitan area, by Lisbon's subway system. This system consists of four lines and 50 stations, providing multiple interchange stations with other transport modes. Additionally, local and commuter bus services operate across the municipality, connecting both intra-city locations and neighboring municipalities. Two main commuter train lines connect the municipality of Lisbon to neighboring municipalities within the district. Finally, several ferry routes connect Lisbon to the municipalities on the southern bank of the Tagus River.As a result, residents across different areas rely on various transportation options to access healthcare facilities, leading to distinct traffic patterns and varying travel times.
Study frameworkThe study framework includes four main stages: (1) collection and pre-processing of spatial data, (2) overall accessibility measurement, (3) accessibility disparity measurement, and (4) accessibility analysis for city residents (Fig. 2). To measure the impact of public transport schedules and pharmacy operational hours on accessibility, we considered five time slots throughout the day: Morning (8–9 AM), Afternoon (1–2 PM), Evening (6–7 PM), Late Night (11–12 PM), and Early Morning (4–5 AM). These time slots were selected to ensure a uniform temporal evaluation, capturing variations in accessibility throughout the day and highlighting the role of public transport availability in identifying temporal gaps. The chosen slots align with public transport schedule variations and Portuguese regulations (Portaria n.º 277/2012), which define the standard operating hours for community pharmacies in Portugal. According to these regulations, community pharmacies must operate for a minimum of 44 h per week, with the following standard hours: Monday to Friday: Open from 10 AM to 1 PM and from 3 to 7PM. Saturday: Open from 10AM to 1PM.
Fig. 2
This study focuses on walking and public transport as the primary modes of accessibility to pharmacies. These modes were chosen due to their relevance for the general population in Lisbon, particularly for vulnerable groups, such as the elderly and individuals without access to private vehicles. Private transport was excluded from the analysis, as the study aims to assess equitable accessibility, which is more closely associated with public and non-motorized transportation modes.
Data collection and pre-processingFor this analysis, a hexagonal grid approach was employed to assess pharmacy accessibility across Lisbon. Hexagons were chosen as the spatial unit due to their spatial efficiency and ability to minimize edge effects, which are common in square grid systems [3]. Unlike square grids, hexagonal grids ensure uniform distances between centroids, allowing for more consistent and precise accessibility measurements [31]. The regular grid structure of hexagons enhances spatial distribution analysis while maintaining computational efficiency. This approach has been increasingly adopted in accessibility and spatial equity studies due to its ability to capture spatial patterns with greater accuracy [25, 26].
To approximate pharmacy demand, this study utilized population distribution data at the hexagonal grid level, assuming that all residential buildings contribute equally to potential pharmacy service demand. A regular hexagonal grid was generated with centroids spaced 150 m apart, resulting in hexagons of approximately 58,457 m2 each. The centroid of each hexagon (n = 50,342) was considered the starting point (origin) for the accessibility analysis. However, to focus on populated areas, only hexagons containing residential buildings were included in the analysis (n = 1,549), excluding non-residential areas such as Lisbon Airport, green spaces like Monsanto Forest Park (a 10 km2 park in the westernmost part of Lisbon), and other non-residential zones (Fig. 3).
Fig. 3
Regular grid of hexagons and community pharmacies (n = 258) spatial distribution
Hexagon-based measurements are widely recognized as effective in walkability studies [26]. The hexagonal shape provides a more accurate representation of walkable areas than other geometric models [52]. Moreover, shorter walking distances are essential for ensuring access to healthcare services, particularly for elderly populations [35]. Research suggests that distances under 200 m are highly walkable, facilitating better health outcomes by improving access to medications and essential healthcare services [1]. Therefore, a 150-m spacing between hexagon centroids was chosen to balance spatial resolution and computational efficiency, allowing for detailed spatial variability in accessibility while keeping computational demands manageable [21]. This scale significantly reduces the number of starting points while ensuring an accurate estimation of distances between residential buildings and the nearest community pharmacy. Data on residential buildings was obtained from the Lisbon City Council, ensuring accuracy and relevance for this study.
In Portugal, community pharmacies serve as the primary providers of prescription and over-the-counter medications, operating under strict regulations to ensure equitable access to pharmaceutical services. While some supermarkets include pharmacy outlets, their presence is limited, and they were excluded from this analysis due to their secondary role in medication provision. The spatial distribution of pharmacies in Lisbon is relatively widespread, with a total of 258 pharmacies serving the municipality (Fig. 3). These pharmacies are concentrated in central areas with higher population densities, whereas peripheral areas exhibit lower densities. This distribution pattern reflects Lisbon’s urban structure, with pharmacies primarily located in historic residential districts and along major thoroughfares that connect neighboring municipalities.
The pharmacy dataset used in this study was obtained from the Lisbon City Council and the Google Maps Places API, providing detailed georeferenced locations and operational hours to ensure high accuracy for spatial analysis. While the dataset reflects the most recent available information, potential discrepancies due to changes in pharmacy operations or public transport schedules remain a limitation of this study.
Overall multimodal accessibilityThis study employed a travel time threshold-based measure of accessibility, evaluating the percentage of centroids representing residential buildings that could access at least one pharmacy within 10 min. This approach was chosen to assess spatiotemporal and multimodal variations in pharmacy accessibility.
To calculate both pedestrian and public transport travel times, we used ArcGIS Pro software along with Python programming toolboxes. The road network dataset was sourced from Navteq, and a walking-to-transit transfer speed of 4.8 km/h was assumed, following Farber et al. [13]. Specifically, pedestrian travel time was calculated based on "Walking Time", using the ArcGIS Pro Online network analysis service street network.
The public transport data used in this study was sourced from the General Transit Feed Specification (GTFS) via the city's open data portal (https://dadosabertos.cm-lisboa.pt/dataset?res_format=GTFS), which provides detailed information on scheduled public transport services, including routes, stops, and timetables. While GTFS is a standardized and reliable dataset for accessibility analysis, it reflects scheduled rather than actual travel times. As a result, variations in service reliability due to delays, traffic congestion, or operational issues may affect real-world accessibility, particularly during peak hours or in highly congested areas.
Because travel time varies significantly throughout the day [13] and depends largely on public transport frequency and individual departure times [45], we calculated public transport travel times using a temporal resolution of one minute. To minimize dependency on exact departure times, the travel time for public transport corresponds to the average travel time within each time interval considered (computed as 60 calculations per hour).
Given the hierarchical role of community pharmacies as the most frequently accessed type of healthcare service, we established a 10-min travel time threshold as the accessibility cutoff. This threshold was defined based on the relatively homogeneous distribution of community pharmacies across Lisbon and their spatial correlation with population distribution [37].
Multimodal accessibility disparityTo evaluate the multimodal disparity in accessibility to community pharmacies, either ratio or dissimilarity indicators can be used. Given the greater ease of interpretation of the accessibility gap [48], this approach was chosen, obtained through the following expression:
$$_= _= \frac_^- _^}_^+_^}$$
(1)
where \(_\) is the accessibility disparity of place i between modes p and q, \(_\) is the accessibility gap of place i, \(_^\) is the accessibility of place i considering the travel mode p, and \(_^\) is the accessibility of place i considering the travel mode q. Thus, accessibility was measured by calculating the number of different pharmacy services reachable from the hexagon centroids, while disparity was calculated as a gap, which varies between -1 and 1, where 0 indicates parity.
City residents' multimodal accessibility to community pharmaciesThis analysis evaluates community pharmacy accessibility by estimating the actual number of city residents impacted by spatiotemporal variations. Unlike the overall accessibility assessment, which used residential building centroids, this approach focuses on population distribution within the study area. It provides insights into how accessibility variations affect residents during both daytime and nighttime periods.
The analysis integrates demographic data, travel times for walking and public transport, and pharmacy operational hours. To estimate the spatial distribution of city residents, we used census data from INE [20], which includes the number of individuals per dwelling, derived from census statistical subdivisions (e.g., census blocks), and geo-referenced data on residential buildings. The total population within each hexagonal grid unit was calculated by multiplying the number of individuals per dwelling by the number of dwellings in each building. To prevent population overestimation due to building overlaps, we assigned each building’s total population to the hexagonal grid unit containing its centroid. We opted for the centroid-based assignment method instead of area-weighted interpolation to ensure that each building's population was uniquely allocated to a single hexagonal grid unit. This approach minimizes the risk of double counting when buildings intersect multiple hexagons and maintains spatial consistency across the study area.
The methodology detailed in the previous sections was then applied to calculate accessibility, incorporating travel times for walking and public transport, pharmacy operational hours, and population distribution across the hexagonal grid. To mitigate potential spatial misalignment between census statistical subdivisions (e.g., census blocks) and the hexagonal grid, we first aggregated population density values at the finest available census unit before assigning them to grid cells. This step reduced discrepancies caused by differences in spatial scales between administrative boundaries and hexagonal tessellation.
Comments (0)