Study design
This study was a two-phase mixed-methods design. Phase One utilised GCM [23] and Phase Two consisted of an online validation survey (Table 1). The GCM approach offered a standardised participative process to guide an expert reference group to sequentially (1) brainstorm, (2) sort, and (3) rate a set of ideas that informed the development of the quality appraisal tool [11, 24]. The use of GCM allowed for the construction of cluster maps to depict the compositive thinking of the group visually [23].
Recruitment
Phase One involved recruiting an expert reference group to contribute to the development of the conceptual underpinnings of the quality appraisal tool through a consensus-based approach. The literature suggests that GCM generally requires a minimum of ten participants to ensure a diversity of perspectives and robust data for analysis. However, smaller groups may be appropriate and effective when the focus is narrow, and participants are selected for their specific expertise, as in this study [25]. The eligibility criteria required participants to hold a master’s or doctoral degree in health geography, geography, biostatistics, epidemiology, environmental science, or geospatial science, and to have authored at least five relevant publications within the past ten years. These publications needed to relate to fields such as health or medical geography, spatial epidemiology, geographic information systems, or quality appraisal.
Eligible participants were identified through university networks and publicly available sources, such as relevant publications and journal editorial board memberships. Contact details, typically email addresses, were obtained from institutional websites or published articles. An email invitation was sent outlining the purpose of the study, expected time commitment, and participation process. This email included a link to a Qualtrics registration survey, which also provided a Plain Language Statement for participants to read before expressing interest. A purposive snowball sampling approach was used, whereby invited participants were encouraged to forward the expression of interest to other eligible colleagues.
Those who registered interest were sent a link to the first GCM activity. Electronic consent was obtained before commencing the first activity. Participants created a username using their email address on the groupwisdom™ platform, enabling the research team to track individual participation across activities. Participants could choose whether to remain anonymous or be acknowledged in study publications. All participants remained anonymous to each other throughout the process. The GCM activities were undertaken between September and December 2023. An advisory group was established, comprising the research investigators and one participant from the expert reference group. This group completed the final step of Phase One, using a structured approach to reach consensus on the number of clusters, the items within each cluster, and appropriate domain names for the draft quality appraisal tool. The outcomes of the GCM activities and advisory group consensus informed the draft tool, which was subjected to further validation in Phase Two.
Phase Two involved recruiting participants identified from Phase One to participate in the validation survey. The literature on instrument development recommends a panel of at least three to ten experts for content validation, with five or more often suggested to ensure sufficient control over chance agreement [26,27,28,29]. These recommendations are primarily based on research in healthcare, nursing, and psychology, where expert panels are used to establish the content validity of new instruments or tools [26, 27, 29,30,31]. The validation survey was conducted between June and July 2024. The advisory group also participated in Phase Two to review and refine the tool’s items for comprehensiveness and clarity.
Ethics
The Deakin University Human Ethics Committee approved this study (reference number: HEAG-H 88_2023). All participants were provided with a plain language statement before participating in any phase of this study. Electronic consent was obtained before commencing the GCM activities and the validation survey.
Phase 1. group concept mapping
The study followed the six-step model outlined by Trochim and McLinden [11], and Anderson and Slonim [17], including Preparation, Generation, Structuring, Representation, Interpretation, and Utilisation (Table 1). All the GCM activities were conducted online using the groupwisdom™ software (Concept Systems, Inc., Ithaca, NY) [32]. This platform allowed participants to complete each activity independently within a set timeframe, reducing the potential influence of groupthink and enabling flexibility for participants to engage at their convenience.
Generation of statements (brainstorming)
Participants were asked to brainstorm responses to the focus prompt: When evaluating health geography studies, what do you think are the spatial methodological components a quality appraisal tool should assess? The focus prompt was designed to generate an exhaustive list of potential quality appraisal tool items. During the statement editing and synthesising process, the research team reviewed participant statements, separating items that contained multiple ideas and collapsing similar responses into a single, representative statement.
Addition of items
The final list of statements generated by the participants during the brainstorming activity was compared to a list of items developed by the authors during a scoping review of existing quality appraisal tools used in health geography and spatial epidemiology research [6]. Any items identified during the scoping review that were not generated as statements during the brainstorming activity were added to the final list after a discussion with the research team to ensure the items were unique and not similar to any of the brainstormed statements. This combined list formed the conceptual foundation for the subsequent sorting and rating procedures.
Structuring of statements (sorting and rating)Sorting
Participants were asked to familiarise themselves with the statements generated in Step Two (brainstorming) and to sort them into clusters based on conceptual similarity. This sorting task was designed to reveal each participant’s perception of the interrelationships among the statements. The procedures for sorting were based on established methods detailed in the literature [22, 33, 34]. To ensure that items were grouped according to their conceptual meaning, rather than being ordered or ranked by perceived value, four restrictions were applied: (1) all statements could not be grouped into a single pile; (2) individual statements could be sorted into a pile on their own but all items could not be sorted into individual piles; (3) statements could not be grouped based on any sort of value (e.g., importance, relevance, frequency); and (4) there could not be any piles of unrelated items (e.g., ‘miscellaneous, other, or don’t know’ piles). The first two restrictions were included because if a participant grouped all items into a single pile or every item into its own, they would have provided no information about the interrelationships among the statements [34]. Participants then named each pile they created to capture its underlying theme; this process informed the names for the preliminary domains for the quality appraisal tool.
Rating
Participants then rated each statement for its importance and feasibility of appraisal using two rating questions: (1) How important do you think the item is for assessing the spatial methodological quality of health geography studies? and (2) How feasible do you think the item is to assess the spatial methodological quality of health geography studies? A 5-point Likert scale was used to rate the level of importance (5 = very important; 1 = not important at all) and feasibility (5 = very feasible; 1 = not feasible). Participants were instructed to use the entire rating scale and to rate each item relative to all other items rather than provide an absolute rating.
Group concept mapping analysis
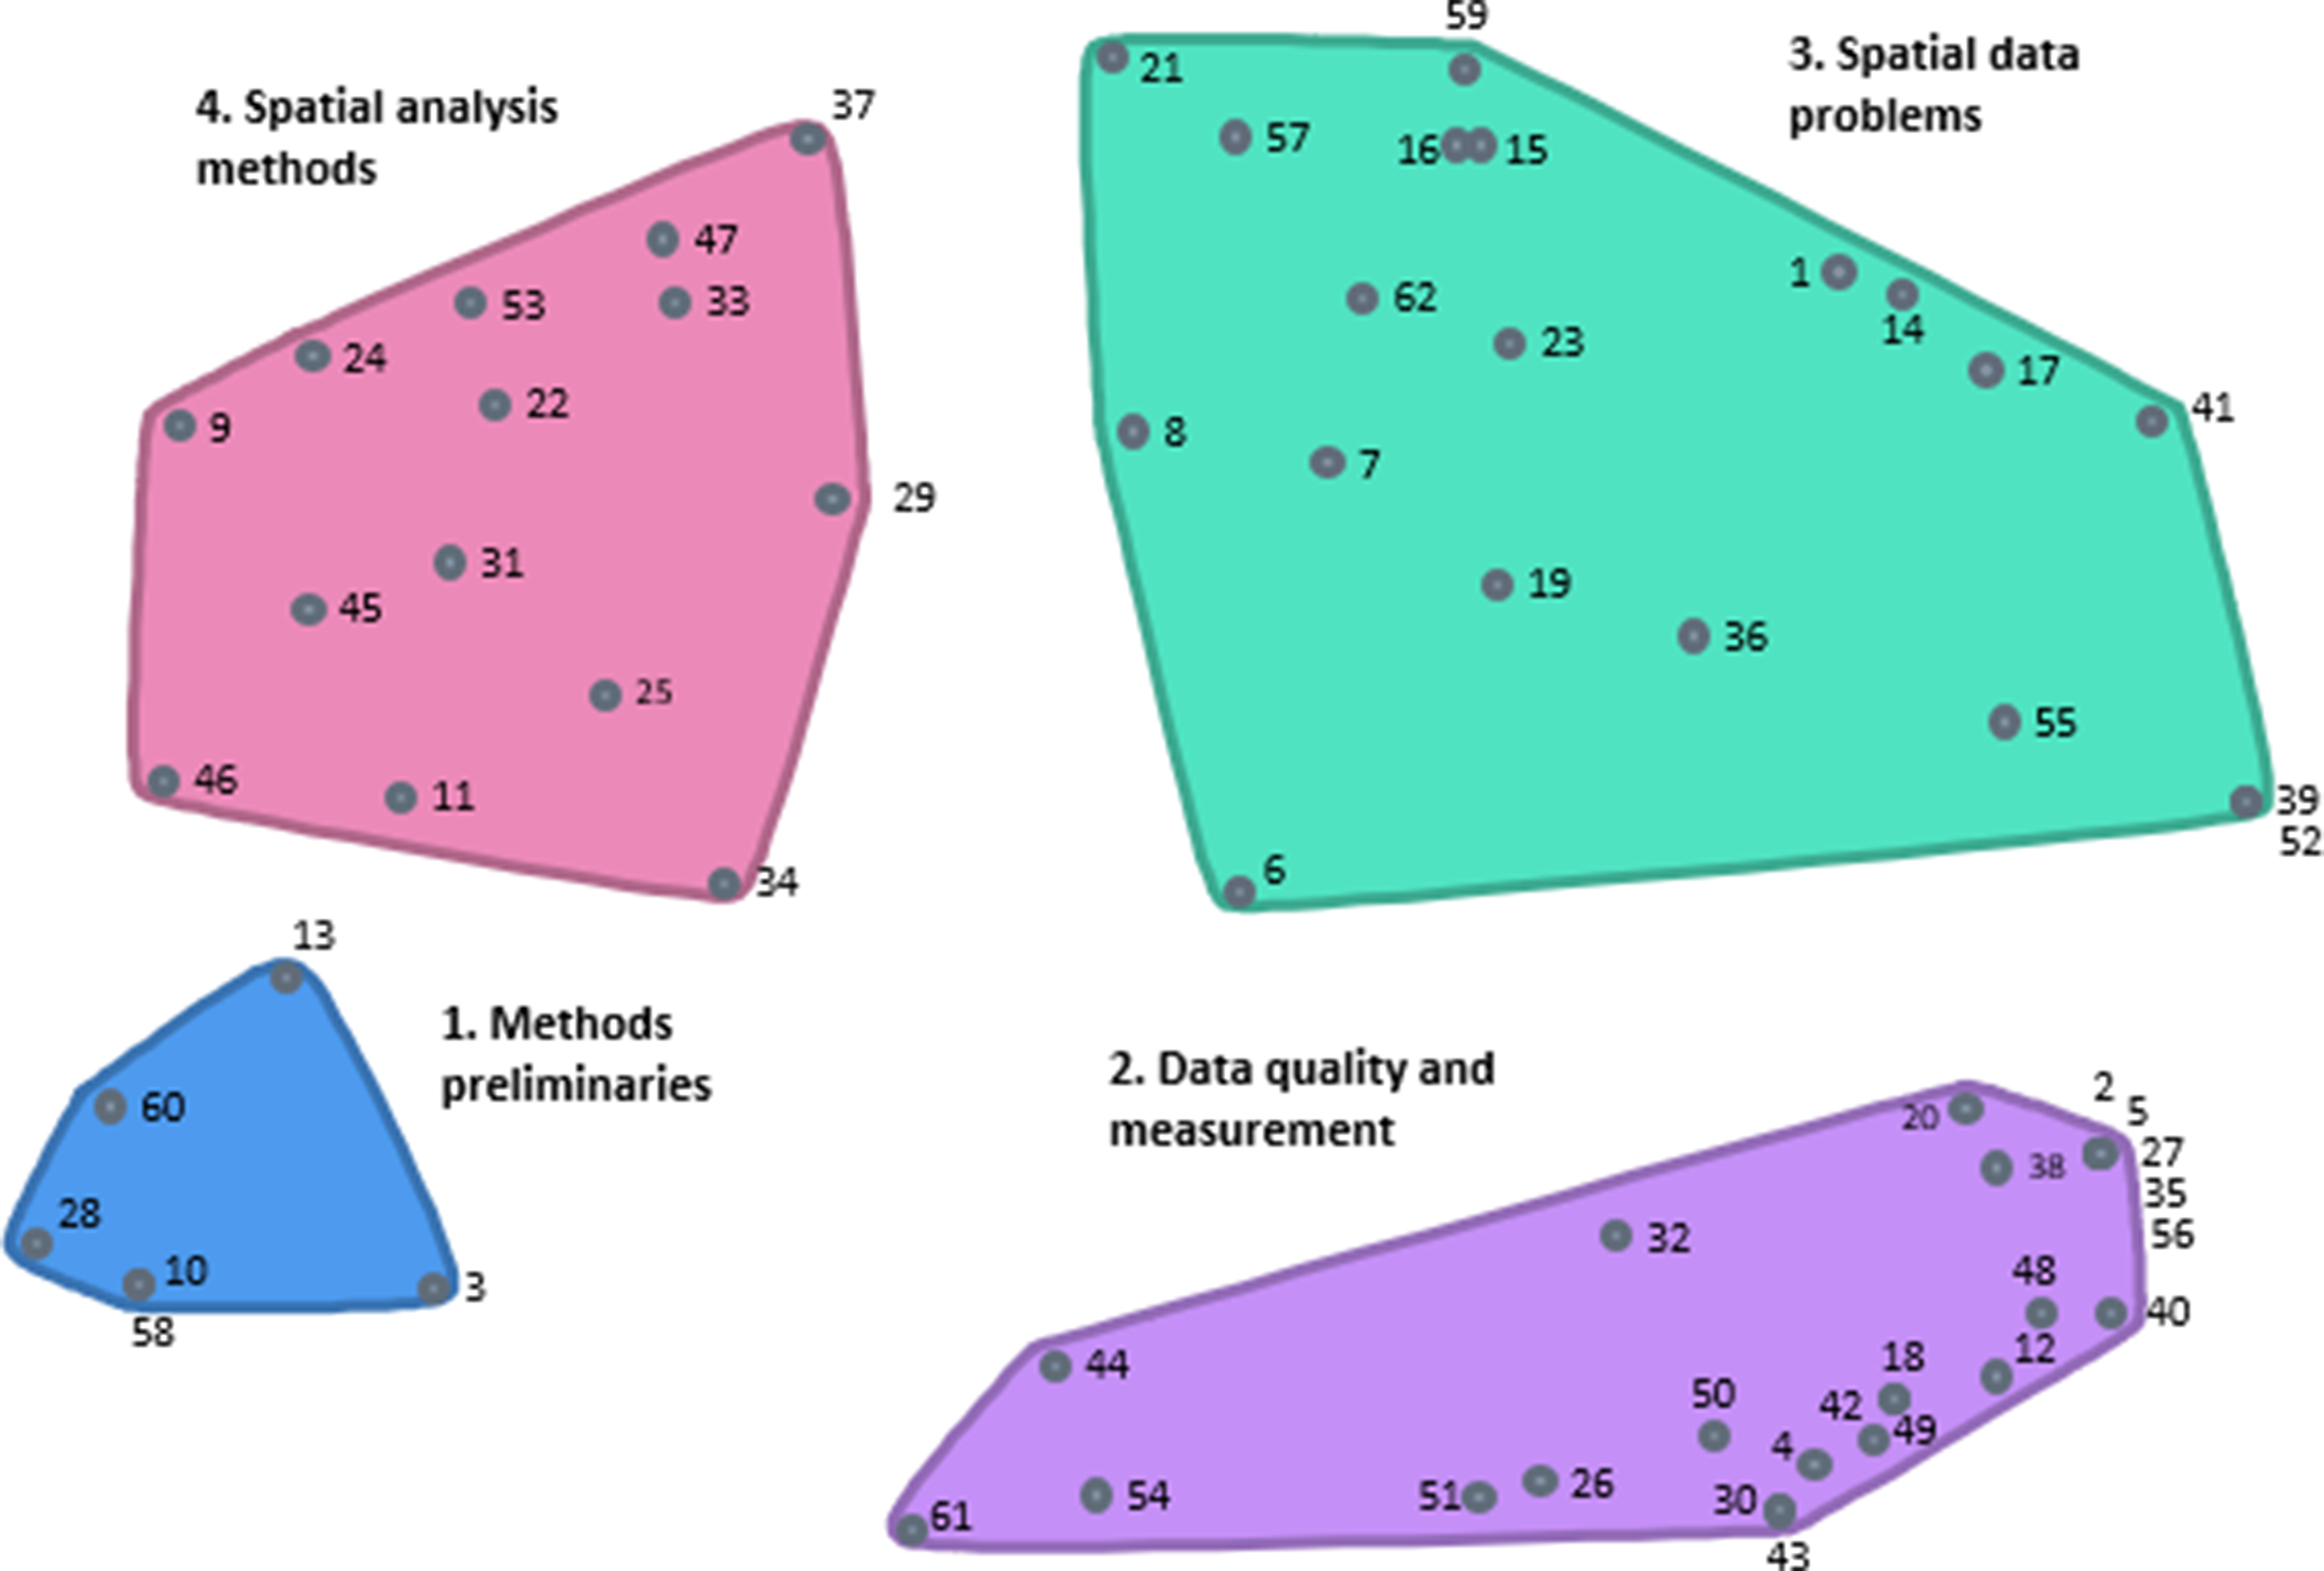
After the participants had completed the sorting and rating activities, the research team performed a data quality check to ensure they followed the instructions (e.g., not creating piles based on a value and using the entire rating scale). Data were analysed using multidimensional scaling (MDS) and hierarchical cluster analysis. The MDS analysis generated a point map, a two-dimensional (x, y) visualisation of statements where distances reflect their perceived similarity. The stress value (a key diagnostic in multidimensional scaling with values from 0 to 1) measures how well the MDS map represents the participants’ sorting data, with lower values indicating a better fit. In GCM studies, there is a less than a 1% probability of a point map having either no structure or a random configuration if the stress value is below an upper limit of 0.39 [35, 36].
Hierarchical cluster analysis was undertaken to partition the statements on the point map into clusters of related items (cluster maps), representing conceptual groupings of the original set of statements. Mean ratings for each statement and cluster were calculated. Bridging values for an individual statement indicate whether that statement was generally sorted with nearby statements. Statements sorted more frequently with nearby statements had bridging values close to 0, and those sorted more frequently with statements in other areas had bridging values closer to 1. Lower bridging values for a cluster indicated a more stable and narrowly focused thematic content. To identify the most appropriate cluster representation of the participants’ sorting data, the advisory group examined the cluster maps from a 6-to-4-cluster solution to determine whether the contents conceptually belonged together and achieved group consensus on the most conceptually appropriate cluster solution.
Descriptive statistics were generated for importance and feasibility ratings for each statement. The mean ratings for each statement were then used to create a bi-variate scatter plot (Go-Zone Plot). This was divided into quadrants using the grand mean for each rating scale, visually representing each statement’s relative perceived importance and feasibility [35]. The division into quadrants facilitates the interpretation of results. Statements rated above the grand mean for both importance and feasibility (i.e., Q1 in the top right quadrant of the Go-Zone plot) were included in the final list of items for the quality appraisal tool.
Phase 2. content validation
Content validity refers to the degree to which the tool includes all relevant items and domains and adequately reflects the entire construct to be measured [26, 37, 38]. Aspects of content validity that should be assessed include (1) relevance, (2) comprehensiveness, and (3) clarity [39]. Content validation relies on experts’ judgment about the content of the items included in the tool [38]. The second phase of this study assessed the content validity of the quality appraisal tool items through an online validation survey.
Content validity survey
The final list of statements in Q1 of the Go-Zone plot underwent content validation to become items of the quality appraisal tool. The validation survey assessed the tool’s relevance, clarity, and comprehensiveness [29, 40]. The validation survey was developed in Qualtrics and sectioned into four domains, with items inputted under their respective domains. Each section briefly described the domain and asked participants to rate each item’s relevance. Relevance was assessed using a 4-point ordinal scale [41]. Clarity ensured the items were written clearly and appropriately for reviewers from varying backgrounds (e.g., health geographers, epidemiologists, or clinicians) by asking: How clear is this item? The survey evaluated the clarity of each item through a dichotomous Clear/Unclear response. Each item had the option to provide comments to improve the clarity. Comprehensiveness, assessed in the final survey question, explored whether the quality appraisal tool contained all pertinent items to appraise a study’s methodological quality by asking: Does the tool cover all the important items? Participants could also suggest additional items or items to remove. Any new or revised items were reviewed and validated by the advisory group.
Content validity analysis
The content validity of the quality appraisal tool was analysed using the content validity index (CVI), content validity ratio (CVR), and modified kappa [29]. Both, the item-level CVI (I-CVI) and the scale-level CVI (S-CVI) were analysed [26]. The I-CVI was calculated as the number of experts giving a relevance rating of either 3 or 4, dichotomising the ordinal relevance scale into relevant (score ≥ 3) or not relevant (score ≤ 2), divided by the total number of experts. Values for CVI range from 0 to 1, and an I-CVI of 0.8 or higher is recommended for a scale to be judged as having excellent content validity [29]. Items with values between 0.70 and 0.79 require revisions, and values below 0.70 are eliminated [27]. The S-CVI is calculated using the number of items in a tool that achieved a rating of ‘most relevant’. There are two methods for calculating S-CVI: the Universal Agreement (UA) among experts (S-CVI/ UA) and average CVI (S-CVI/Ave). The S-CVI/ UA is calculated by adding all items with I-CVI equal to 1 and dividing by the total number of items. The S-CVI/Ave is calculated by dividing the sum of the I-CVIs by the total number of items. The calculation of both the S-CVI/ UA and the S-CVI/Ave was undertaken to monitor for potential variability in values with six raters. The UA approach only includes items with 100% agreement and is, therefore, more conservative, potentially underestimating the scale content validity. The Average method is more liberal and is recommended [26]. For a scale to be judged as having excellent content validity, values for S-CVI/UA ≥ 0.80 and SCVI/Ave ≥ 0.90 are recommended. The CVR measures the essentiality of an item [27]. Values for CVR range between + 1.00 and − 1.00; a higher score indicates greater agreement among participants [42]. The modified kappa statistic was also calculated to determine the degree of agreement beyond chance, as the CVI does not consider the possibility of inflated values, and it is recommended to calculate a modified kappa alongside the CVI [27]. Kappa values range from + 1.00 to -1.00, with a positive kappa indicating inter-rater agreement occurring more frequently than would be expected by chance [43]. A kappa value of + 1.00 demonstrates complete agreement among raters; values above 0.75 are considered excellent, between 0.60 and 0.74 good, 0.40 and 0.59 fair, and 0.40 and 0.0 poor. A zero kappa indicates that agreements are no more than can be expected by chance [27].


Comments (0)