Whether through the use of spatial statistics or cartographic visualization, geospatial data can be a powerful resource for researchers looking to link health outcomes to environmental risk factors. As important as this type of research is, however, it cannot come at the expense of patient privacy; as the saying goes, ‘first, do no harm’. Geographic masks are techniques that offer an avenue for exploring and distributing useful spatial health data without violating the privacy of the people that data describes. Sadly, geographic masks are not readily available to the users that would benefit most from them. Major GIS applications and libraries alike lack geographic masking functions, requiring would-be users to dive into niches of academic literature to identify, understand, implement, and evaluate the masks that would benefit them. For many, this friction simply puts geographic masks out of reach. This can lead to one of two problems: either sensitive data gets published without being properly anonymized, violating privacy, or it stays locked away, preventing other researchers from being able to explore it whatsoever [1, 2]. The goal of this article is to showcase geographic mask tooling that makes both of these outcomes more easily avoidable.
Fundamentally, geographic masks transform spatial point data with the intent to protect geoprivacy while simultaneously preserving the utility of that data for analysis [3]. Unfortunately, these two objectives are fundamentally at odds: the more we do to protect privacy in a spatial dataset, the less useful the data becomes. The goal of any geographic mask is to optimize this trade-off, such that privacy is sufficiently protected while incurring the least amount of information loss. Many geographic masks have been developed over the years, each attempting in their own way to best satisfy this fundamental goal [4,5,6]. As a result, there are now a variety of masks to choose from. Actually making this selection, however, can be quite difficult.
This difficulty stems from the fact that every mask performs differently depending on the underlying nature of the data, and measuring these differences can be the basis of an entire research publication by itself. Many geographic masking studies use a wide variety of methods for assessing privacy protection and information loss, often with interpretations that are at odds with each other [7]. Moreover, even if a would-be masker found three studies that each used identical methods to assess a handful of different masks, their results would be difficult to utilise as they are specific to the dataset being masked. For instance, variations in population density and urban form can greatly affect the outcome of a masking procedure [8]. A mask applied to data in a sprawling city like Orlando would likely perform quite differently than in a highly dense city like New York.
The underlying structure of the data itself also affects geographic masking: how many points are there, are they dense or sparse, who or what are they describing, are they clustered, do they span extremely mixed population densities, and do they represent fixed locations or do they move over time? Further complicating things is the fact that most masks have parameters, such as maximum displacement distance, that must be taken into account. It is impossible to know what the optimal parameters are without first testing a variety of them. Finally, mask performance can vary solely due to the randomization element that many masks rely on, meaning that studies that evaluate masks should ideally do so over many iterations of the mask. Ultimately, each of these factors add up such that just because one study showed a given masking technique to be the best for their data and context, does not mean it will be the best for your data and context.
This means that it is important to perform some level of testing and validation on a masked dataset before publishing it. Such testing may not need to be as comprehensive as a full research study, but there should be some level of validation nonetheless. Unfortunately, this is both difficult and time consuming. Geographic masking can already be a burdensome process even without performing this analysis, and studies have shown that many researchers forgo privacy protection entirely and simply publish sensitive location data in maps [1, 2].
Our previous research has attempted to reduce this friction by developing both masks and tools that are more simple to use [9, 10]. This article is an extension of this research, and describes an open-source Python package for geographically masking point data, called MaskMyPy. MaskMyPy was first introduced within a 2020 article proposing a new method for geographic masking, called Street Masking [10]. At the time, the software largely focused on providing a small number of easy-to-use geographic masking functions for anonymizing GeoDataFrames, with the Street mask being its primary feature. This article presents a new, more powerful iteration of this tool with a much larger focus on the analysis aspect of geographic masking. It allows users to quickly execute a number of geographic masks along with any combination of parameters on a given dataset, all while automatically calculating privacy and information loss metrics. This allows for rapid comparison and evaluation of mask performance, making it far less burdensome to robustly protect geospatial data. Moreover, its features may help aid other researchers in developing new geographic masks, providing a framework for this research community to build upon.
This article begins with a brief overview of geographic masking and existing tools. Next, it highlights the core features of MaskMyPy, including its inbuilt masks, analysis tools, and management features. These features are then used to analyze the results of hundreds of mask iterations, with the goal of highlighting a range of often overlooked factors that impact mask performance. Finally, the article concludes by discussing the importance of, and need for, comprehensive privacy tooling in academic research.
Geographic masks
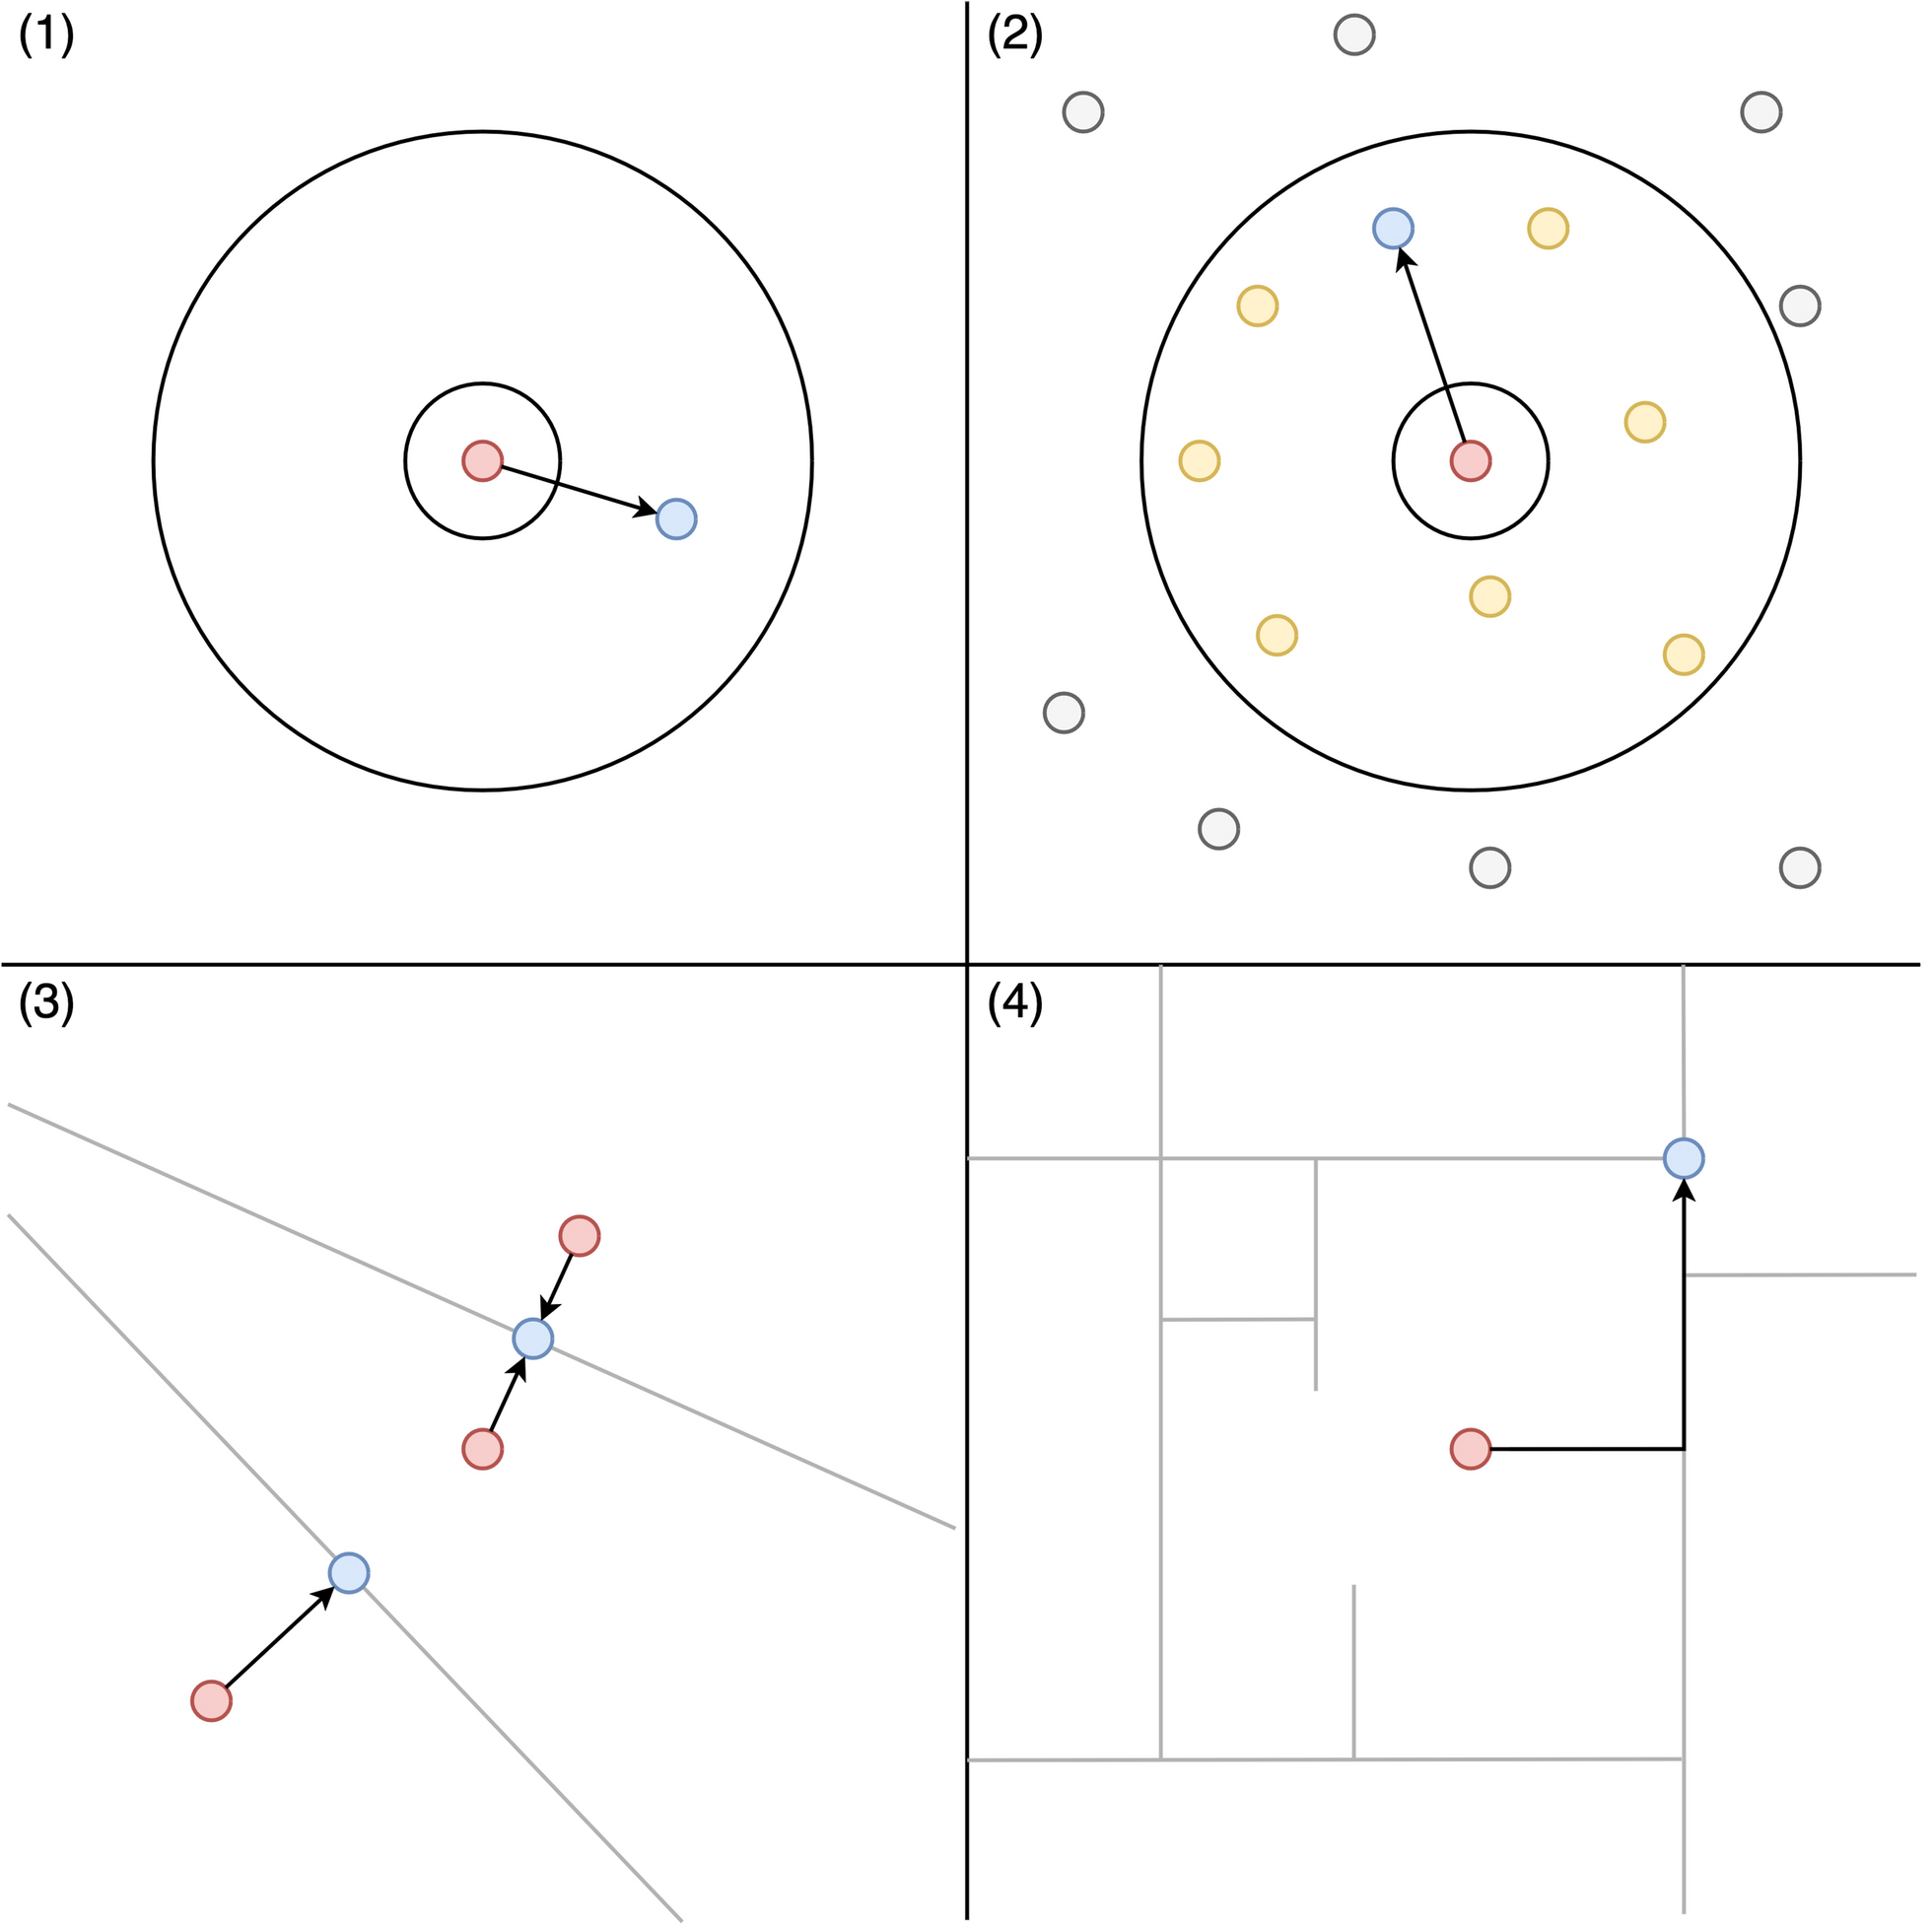
Geographic masks have steadily evolved over the last two and a half decades. First proposed by Armstrong et al. [3], early masks are best exemplified by affine transformations and random perturbation. Affine transformations include techniques that translate, rotate, or scale point patterns globally by a predefined value in order to protect privacy. A concern with these techniques, however, is that re-identifying a small subset of the data can lead to the entire dataset being re-identified as well, as all points are transformed using the same values. A partial solution to this is to split the dataset into a grid and perform different affine transformations locally to each cell [11]. Random perturbation, on the other hand, provides a much stronger solution to this problem, as every point is displaced randomly within a given maximum distance [3]. Because each point is treated independently, re-identifying one point (or even a small subset of points) in a given dataset cannot be used to then re-identify other points in the same dataset.
Subsequent masks often tweak this basic formula in order to make up for random perturbation’s weaknesses. For instance, a weakness of random perturbation is that points may only be displaced small distances (e.g. 2 m), providing almost no privacy protection. Donut masking adds a minimum displacement distance to solve this issue [4]. Another weakness is that points can be displaced to impossible locations, such as the ocean. Location swapping and the verified neighbor mask both solve this issue by leveraging contextual address data; instead of displacing points entirely at random, they will relocate given a point to a randomly selected address nearby, helping to ensure that the masked data remains more realistic [6, 12].
However, other masks have been developed that take entirely different approaches. For instance, Adaptive Areal Elimination (AAE) seeks to provide a guaranteed minimum level of privacy [5]. It does this by iteratively aggregating census polygons until their combined population reaches a minimum threshold. Then, points are displaced within each aggregated polygon. This approach ensures that a minimum level of privacy is achieved even when the population is heterogeneously distributed.
Of course, researchers have developed more masking techniques than can be described here. Briefly, these include Street masking (which relocates points along the OpenStreetMap road network) [10], Voronoi masking (which relocates points by creating voronoi polygons and snapping them to the nearest edge) [13], multi-scale masking (which relocates points by strategically switching digits in their coordinates on the Military Grid Reference System) [14], Triangular Displacement (which relocates points based on multiple risk factors with a focus on computational efficiency) [15], NRand-K (which relocates each point based on the density of other points nearby) [16], and Adaptive Voronoi masking (which combines elements of Voronoi masking and Adaptive Areal Elimination) [17]. This is not an exhaustive list, and there are further variations of masks one may consider, such as whether to use a uniform or gaussian distribution when performing random perturbation, or whether to select the displacement distance entirely at random or by weighing it using population data. Indeed, the wide variety of ways to go about geographic masking underscores the importance of evaluation and tooling.
Mask evaluation
Geographic masks are evaluated based on two primary concerns: how much they protect privacy, and how much information loss they incur. Beginning with privacy protection, researchers have largely settled on one primary evaluation metric: spatial k-anonymity. Spatial k-anonymity is an adaptation of the popular k-anonymity metric [18,19,20], which measures the uniqueness of records in a given dataset. For example, a record is 10-anonymous if it is indistinguishable from 9 other records in the same dataset. Spatial k-anonymity on the other hand may consider a masked address as 10-anonymous if there are 9 other addresses closer to it than to its original, unmasked location [21]. However, as Seidl et al. [7] note, there is a degree of disagreement in the literature regarding this definition. More specifically, should k-anonymity be measured relative to the original sensitive location, or relative to the masked location? In our opinion, and given that the goal of geographic masking is to prevent reverse geocoding of the masked data, it seems fitting to measure it based on the masked location, as this is what an adversary seeking to re-identify the address would be dealing with. Nevertheless, this does represent an inconsistency in the literature that easily goes unnoticed.
Moreover, it must be noted that spatial k-anonymity estimates are somewhat imprecise. When census data is used in the calculation, there is an inherent assumption that the population within the census area is uniformly distributed, which is rarely, if ever, the case. The use of address data ameliorates this problem, but tends to use addresses as a proxy for individuals, which introduces its own issues. Finally, spatial k-anonymity has also been measured without considering a background population, and instead considers a masked address 10-anonymous if 9 other masked addresses within the dataset are closer to the unmasked address than the masked address [22]. This coincides more closely with the original formulation of k-anonymity, but is extremely difficult to satisfy spatially without incurring extreme information loss.
While spatial k-anonymity poses a dominant yet somewhat ambiguous measure of privacy protection, measures of information loss are both more varied and yet more clear cut. Fundamentally, measuring information loss means measuring changes to the point pattern introduced by the masking process. This is commonly achieved by looking at how masking changes the number, location, and/or size of clusters that can be identified in the data [4, 6, 12, 19, 23]. For instance, one can use Ripley’s K function to measure clustering at multiple spatial scales on both the unmasked and masked data, and then plot the difference between the two [6, 12]. Any difference, whether it be towards greater clustering or dispersion, is an indication of information loss. Other clustering metrics that are commonly used include the average nearest neighbor index [6, 15] and SatScan [4, 12, 19, 23]. Alternatively, one can look towards changes in descriptive statistics, such as how much the mean center of the point pattern has drifted due to masking [12, 13], or by simply measuring average distance that each point was displaced [5, 12, 19]. These are only some of the many ways to quantify information loss. Ultimately, it is best to look towards multiple complementary measures to assemble a more complete picture of what is lost to the masking process.
Existing tools
There exist a small number of tools that use geographic masks for the purpose of privacy protection, which are summarized in Table 1. In 2019 we developed MaskMy.XYZ, which is a web application for applying donut masking to sensitive locations within the browser [9]. While being very easy to use and providing rudimentary tools for measuring privacy and information loss, it is primarily designed for quickly masking small datasets rather than being a comprehensive masking application. Alternatively, GeoPriv is a QGIS plugin that comes closer to this goal, as it offers three separate masking techniques: spatial clustering, Laplacian noise, and the NRandK mask [16, 24]. GeoPriv is a plugin for QGIS, and has the advantage of being usable directly inside an existing and popular GIS environment.
Table 1 A summary table comparing some of the different tools available that allow users to geographically mask their data, or make use of geographic masks to achieve their desired purposeWhile MaskMy.XYZ and GeoPriv are explicitly for the purpose of geographic masking, other tools make use of geographic masking to achieve a larger goal. For instance, Privy.to is another web-based application that leverages geographic masks, temporal obfuscation, and encryption to allow users to privately and securely share their location with others [25]. MapSafe takes a similar approach by combining geographic masking, encryption, and blockchain technology to allow users to anonymize sensitive geospatial data, share it based on different levels of trust, and securely notarize it on the Ethereum blockchain without exposing either the masked or unmasked data [26].
However, when compared to the wealth of geographic masking techniques that have been developed in GIScience, there is a clear lack of GISystems tooling to translate these into reality. As Boeing [27] concisely writes, “to conduct better science, we need to build better tools”. Indeed, we are in an age where spatial data abounds, but often this data is highly sensitive and cannot be easily shared without sparking legitimate privacy concerns. Translating the wealth of GIScience theory about geoprivacy and geomasking into GISystems tooling is a key step towards unlocking this data and allowing other researchers to tap into its latent potential. Better tooling can also improve the science of geographic masking itself by reducing the evaluation overhead. These are the twin goals of MaskMyPy.


Comments (0)