
Remember me
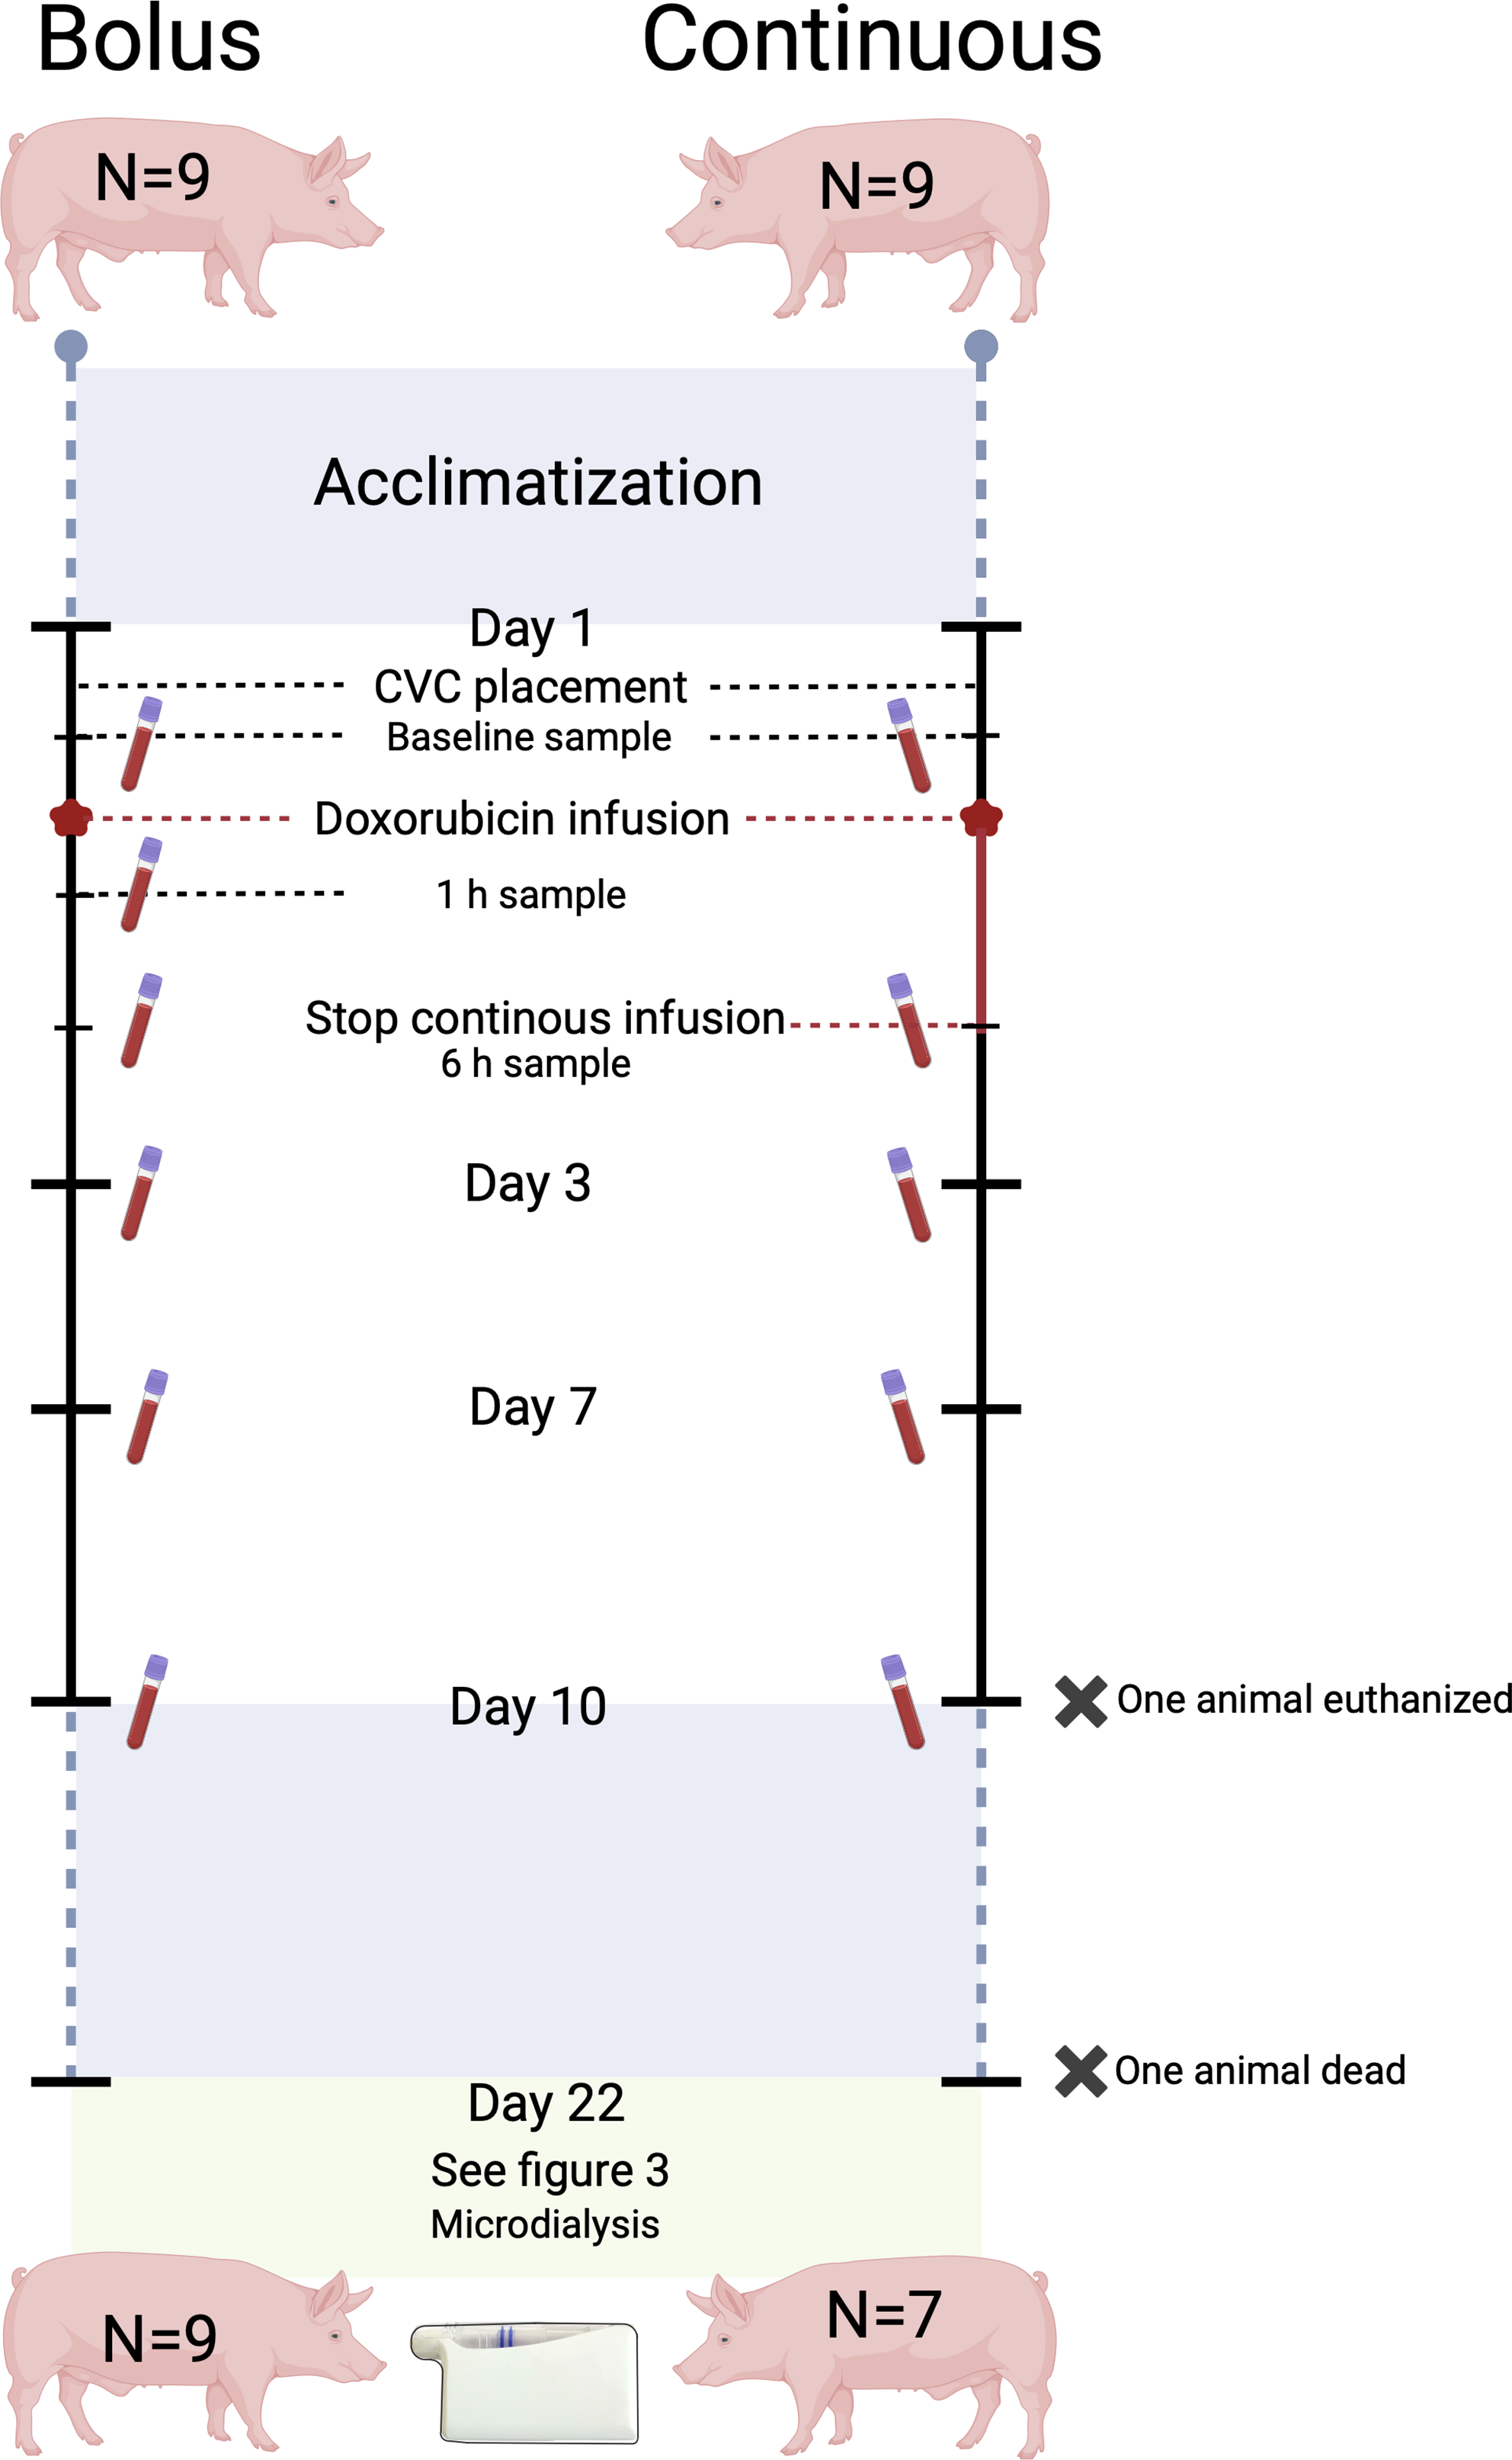
Eighteen pigs were included and randomized into two groups of nine, receiving either two bolus or continuous administrations on day 1 and 22. On day 22, twelve hours of microdialysis sampling of doxorubicin bone and soft tissue concentrations was performed.
Ethical approvalThe study was conducted at the Department of Clinical Medicine, Aarhus University, Aarhus, Denmark. Approval was obtained from the Danish Animal Experiments Inspectorate (license No. 2021-15-0201-01079) and carried out in accordance with existing laws. All chemical analyses of doxorubicin were performed at the Department of Forensic Medicine, Aarhus University Hospital, Aarhus N, Denmark. Kidney and liver values were analysed by the Department of Clinical Biochemistry, Aarhus N, Denmark. The study was carried out in accordance with the ARRIVE-guidelines [30].
MicrodialysisMicrodialysis is a catheter-based sampling tool that allows for a dynamic and continuous sampling of molecules below the cut-off value of the semi-permeable membrane located at the tip of the catheter. The semi-permeable membrane allows concentration-dependent diffusion. As the catheter is connected to a perfusion pump continuously perfusing the catheter at a set flow rate, an equilibrium between the membrane and the surrounding extracellular space will not occur. This means that the concentration of the molecule of interest, quantified in the dialysate (collected in the collecting tube), only constitutes a fraction of the absolute concentration in the surrounding tissue. This fraction is referred to as the relative recovery, which must be calculated and corrected to estimate absolute tissue concentrations. In the present study, relative recovery was estimated using retrodialysis by drug with doxorubicin performed at the end of the study. Formulas for calculation can be found elsewhere [29, 31].
All microdialysis equipment was purchased from M Dialysis AB (Stockholm, Sweden). Based on results from a previous study, the equipment used for the collection of doxorubicin were the type 70 catheter with a 30 mm membrane and the type 67 intravenous catheter also with a membrane length of 30 mm (cut-off of 20 kDa) [32]. For all catheters, the flow rate was set at 1 µl/min, and the perfusion fluid was saline 0.9%. Sample collection was done in 1.5 ml LoBind Eppendorf tubes (Eppendorf, Hamburg, Germany) [32].
Animals, sample size and randomizationEighteen female pigs (Danish Landrace) were included in the study and randomized into two groups of nine. Randomization was done before the first intervention as block randomization of two (as one for the first two animals), by drawing a note indicating Group 1 (bolus infusion) or Group 2 (continuous infusion) from a non-translucent envelope.
Sample size was, due to a lack of relevant clinical assumptions based on results, from a study measuring doxorubicinol concentrations (metabolite of doxorubicin) in plasma as well as the hepatic system. Using a two-independent means power calculation with a mean doxorubicinol AUC (min×mM) of 3.8 (SD 1.4) in plasma (n = 4), a mean doxorubicinol AUC of 2.0 (SD 0.8) in the hepatic system (n = 4), a power of 90% and a significance level of 5%, a group size of n = 8 was found [4].
The animals arrived at the research facility a minimum of 14 days before the first intervention, providing sufficient time for acclimatization and human contact training. They were kept singularly in pens with a light cycle of 12 h. Straw was used as bedding, and the animals had access to water ad libitum. Feeding was restricted (farm pig ration) to control weight gain.
DosageDoxorubicin dosage is traditionally administered based on body surface area. However, due to a lack of a suitable formula for the pig breed used in the present study, a dosage based on weight (2 mg/kg) was opted for. This approach has previously provided clinically relevant plasma concentrations [32]. Animals were fed to reach a mean weight of 66 kg on day 1 and 75 kg on day 22 resulting in dosages of 132 mg and 150 mg of doxorubicin, respectively. Pigs gain weight much faster than humans, wherefore, the dosage on day 22 had to be increased compared to the dosage on day 1. The actual attained mean weight was 65 kg on day 1 and 73 kg on day 22.
Study set-upDay 1The first intervention indicated day 1 of the study period. The animals (mean weight: 65 kg) were sedated in their pens with zoletil mix ((25 mg/ml tiletamin + 25 mg/ml zolazepam) + 6.25 ml xylazine (20 mg/ml) + 1.25 ml ketamine (100 mg/ml) + 2.5 ml butorphanol (10 mg/ml) 1 ml/10 kg)) and placed under general anaesthesia with a combination of continuous intravenous infusion of propofol (Fresenius Kabi, Bad Homburg, Germany) and fentanyl (B. Braun, Melsungen, Germany). Initial dosages were 30 mL/h and 10–12 mL/h, respectively. A central venous catheter (CVC) was placed in the ear of each animal (size 4–6 F). This was not feasible for two animals, and insertion in the external jugular vein was used.
After placement of the CVC, baseline blood samples were drawn (Fig. 1). Hereafter, 500 mL of saline was administered through the CVC over 20–30 min, followed by administration of 132 mg doxorubicin soluted in 500 mL of saline 0.9%, given as either a bolus infusion over 5–15 min or a continuous infusion over 6 h. Blood samples were taken after 1 h (only bolus group) and 6 h. After doxorubicin infusion, an additional 100–200 mL saline was administered. All animals spent the same amount of time under anaesthesia (7–8 h) and were monitored with pulse, saturation and temperature. Animals were woken from anaesthesia and brought back to their in-house pens.
Fig. 1
Overview of the sampling from day 1 until day 22. Created with Biorender
Day 2 till day 21; doxorubicin samplesBlood samples, for investigation of doxorubicin concentrations as well as liver and kidney status, were taken from the CVC on days 3, 7, and 10. The CVC was flushed daily with heparinized saline. After the blood sample on day 10, the CVC was removed. From day 11 to day 21, the animals were exposed to no further interventions.
All animals were observed several times daily and in the first days following the first doxorubicin administration scored on pulse, saturation, temperature, breathing, general behaviour, eating and defecation. In case of any signs of infection in terms of redness and swelling around the CVC, the ear was washed with chlorhexidine and fucidin ointment. Three animals were also treated with the antibiotic linco-spectin (i.m) due to signs of infection. Three animals were treated briefly with primperan on suspicion of nausea. Diarrhoea was a fairly common side effect a few days after doxorubicin treatment and was treated with vetmulin (i.m). A few animals had a decreased appetite in relation to the diarrhoea and were offered alternative food options. Symptoms of nausea/vomiting in combination with reduced well-being lasting more than 72 h meant exclusion from the study. All animals displayed a gradual increase in body weight up until day 22.
Day 22The animals (mean weight: 73 kg) were sedated with zoletil mix and transported to the surgical facility. Upon arrival, animals were placed under general anaesthesia at initial dosages of 40 mL/h propofol and 25 mL/h fentanyl. By ultrasound guidance, two CVCs were placed in the external jugular veins and an arterial sheath in the groin. Microdialysis catheters were placed in four tissue compartments and one catheter intravenously, for measurement of unbound doxorubicin concentrations (Fig. 2). Muscle and subcutaneous catheters were placed on the right front limb using splitable introducers guided by ultrasound. An introducer was also used for the placement of a catheter in the synovial fluid of the knee joint. An incision on the medial side of the tibial tuberosity on the outer rotated right hind limb was made approximately 2 cm distal to the tibial plateau, continuing to the midpoint of the tibial diaphysis. A cancellous drill hole (35 mm in depth and ∅2 mm) was made in the metaphysis medial to the tibial tuberosity, and a catheter was placed. Bone overheating during drilling was prevented with frequent pausing and continuous cooling with saline. The position of catheters in synovial fluid of the knee joint and cancellous bone was verified intra-operatively with fluoroscopic imaging. Furthermore, the drill hole in the cancellous bone was verified post-mortem by computed tomography (CT). After placement, the microdialysis catheters were connected to perfusion pumps and filled with perfusion fluid (saline). Doxorubicin was administered according to group assignment on day 1, but 150 mg was administered due to increased body weight.
Fig. 2
Placement of the microdialysis catheters on day 22. (1) Intravenous, (2) subcutaneous tissue, (3) muscle, (4) synovial fluid of the knee joint, and (5) cancellous bone compartments. Created with Biorender
A minimum mean arterial pressure (MAP) of 65 mmHg was maintained to secure an equal circulation between the animals. In case MAP dropped below 65 mmHg and couldn’t be stabilized on fluids or in the Trendelenburg position, norepinephrine (concentration 0.1 mg/mL) was started at 0.3 mL/h and adjusted by response. Throughout the study time, the animals received a continuous infusion of 5% glucose to maintain glucose levels, which were monitored every two hours with arterial gasses including pH.
Doxorubicin sampling day 22The start of doxorubicin administration indicated time zero (Fig. 3). The overall sampling time was 12 h. The room light was off for the entire study period due to the risk of photodegradation of doxorubicin. Sampling was identical for animals receiving bolus and continuous infusion, respectively.
Fig. 3
Overview of sampling of dialysates on day 22. Created with Biorender
Dialysates were collected every 30 min from time 0 to 120 min, every 60 min from time 120 to 360 min, and every 120 min from time 360 to 720 min. A total of 11 dialysates were collected from each compartment plus an additional three retrodialysis calibration samples. Venous blood samples (total concentration) were taken at the midpoint of each of the above-mentioned sampling intervals and additionally after 60 and 360 min. Calibration was performed with an 18.74 µg/mL doxorubicin saline solution.
Handling of samplesAll venous blood samples taken for the quantification of the total concentration of doxorubicin was collected in EDTA 1.8 mg/mL 4 mL tubes and stored at 4–5 °C for a maximum of two hours. Samples were then centrifuged at 3,000 g for 10 min at 5 °C. Venous samples taken for the evaluation of kidney and liver status were collected in lithium heparin 5 mL tubes and centrifuged at 2,000 g for 10 min at 20 °C. All plasma samples and dialysates were immediately stored at -80 °C until analysis.
Liver and kidney statusTo ensure that variations in kidney and liver function between the two groups did not influence the results, a total of ten blood samples were taken from each animal. Samples were taken on day 1 before as well as 1 h and 6 h after the start of doxorubicin administration (time 0), respectively. One sample was taken on days 3, 7 and 10. On day 22, a sample was taken before as well as 1 h, 6 h and 12 h after the start of doxorubicin administration, respectively. Except for hemoglobin, all values were attained after analysis on an Atellica CH (Siemens Atellica Solution, Siemens Healthineers, Erlangen, Germany). Hemoglobin was analyzed on an ABL90 Flex Plus (Radiometer Medical Aps, Brønshøj, Denmark).
Quantification of doxorubicin in microdialysates and plasma samples by ultra-high performance liquid chromatography and tandem mass spectrometryThe concentration of doxorubicin measured in dialysates represents the unbound concentration, while the concentration measured in plasma from venous samples is the total concentration. Doxorubicin concentrations in microdialysates/plasma were measured by ultra-high performance liquid chromatography and tandem mass spectrometry (UHPLC-MS/MS) as previously described in detail [32]. Briefly, microdialysate samples were prepared for analysis by mixing 10 µL dialysate with 190 µL internal standard solution (13CD3-doxorubicin stable isotope (Clearsynth, Mumbai, India) at 0.025 µg/mL in water: methanol (85:15) with 0.1% formic acid) in a 96-well plate (1mL Eppendorf LoBind). Blood plasma samples were prepared in 96-well plates (1 mL Eppendorf Lo-bind) by mixing 50 µL plasma with 50 µL saline (water with 0.9% sodium chloride) and 300 µL internal standard/protein precipitation solution (13CD3-doxorubicin at 0.05 µg/mL in 100% acetonitrile), followed by vortex-mixing and centrifugation (5000 ×g, 5 min). A 100 µL aliquot from the resulting supernatant was diluted with 200 µL water supplemented with 0.1% formic acid to yield the final sample. Separate samples for calibration were prepared in matched matrices at concentrations of 0, 0.001, 0.004, 0.012, 0.037, 0.111, 0.333 and 1 µg/mL using reference compound doxorubicin hydrochloride (European Pharmacopoeia Reference Standard CRS batch 7 supplied from Sigma-Aldrich, Germany). Samples were analyzed with an UHPLC-MS/MS system (Acquity UPLC coupled to a TQS mass spectrometer from Waters, Milford, Massachusetts, USA) with a C18 column (Waters UPLC HSS-C18, 1.8 μm, 100 × 2.1 mm) and using multiple reaction monitoring mode as described [32]. Calibration curves were constructed by linear regression of the peak area ratio (analyte/internal standard) versus the nominal analyte concentrations of the calibrant samples using 13CD3-doxorubicin as internal standard. The lower limit of quantification for doxorubicin was estimated to 0.002 (dialysate) and 0.003 µg/mL (plasma) and the standard requirements for precision (CV < 15%) and trueness (bias < 15%) were met.
Pharmacokinetic analysis and statisticsFor all animals and each compartment, the following pharmacokinetic parameters were determined for doxorubicin by non-compartmental analysis using Stata (version 16.0, StataCorp, College Station, Texas, USA). The area under the concentration-time curve (AUC0 − 12 h) from time zero until the end of the sampling period of 12 h was calculated using the linear up-log-down trapezoidal method. Peak drug concentration (Cmax) was calculated as the mean peak concentration of doxorubicin in each compartment. Penetration ratio was calculated by AUCtissue/AUCiv. For dialysates, all concentrations were assigned to the midpoint of each sampling interval.
The pharmacokinetic parameters for the animals receiving bolus infusion were compared to the animals receiving continuous infusion. The data was modelled separately for each compartment data to compare the groups (regression analysis with fixed effect) and analysed separately within groups to compare the compartments within groups (regression analysis with random effect). Mean plasma concentrations after 1 and 6 h on days 1 and 22 were compared in Excel (Microsoft version 16.78.3) using a t-test. A p-value < 0.05 was regarded as statistically significant. The p-values were not adjusted for multiple comparisons.
Comments (0)