
Remember me
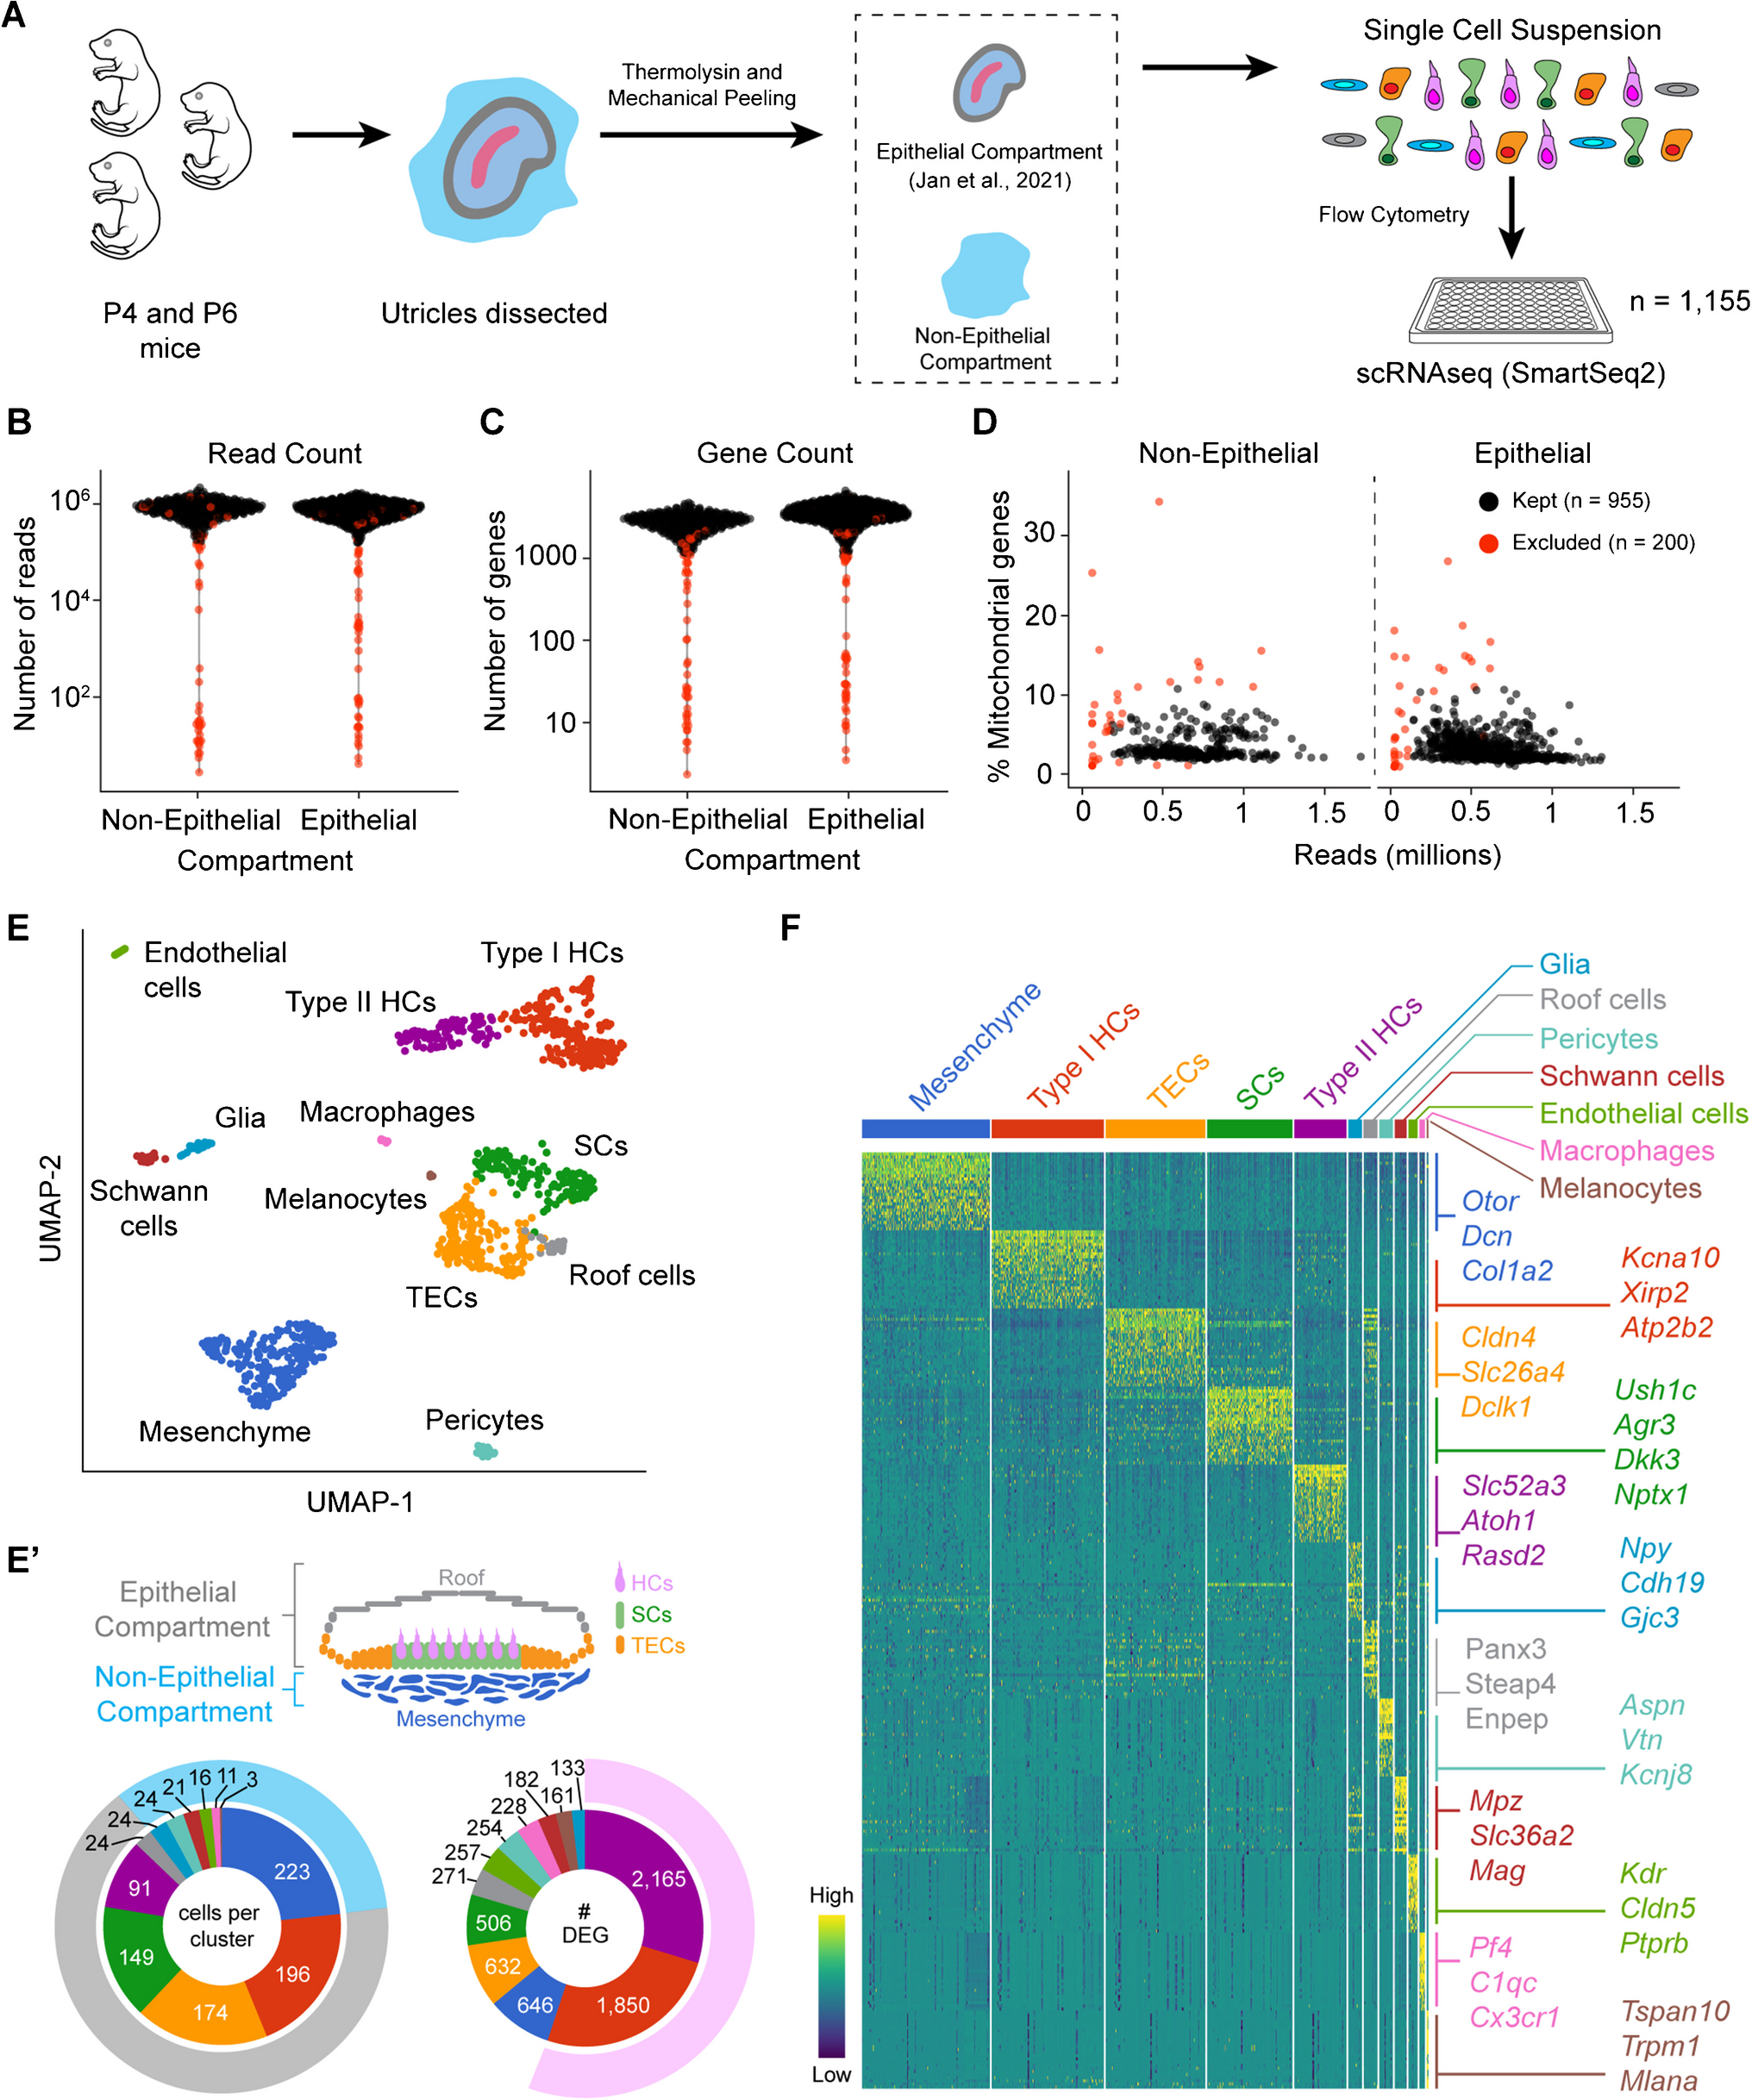

To investigate the epithelial and non-epithelial compartments of the utricle, we first mechanically separated these compartments (Fig. 1A), allowing for individual cell captures. We have previously characterized the epithelial cells of the postnatal mouse utricle [4]. Here, we used our previously published data from P4 and P6 sensory epithelia and added newly acquired P4 and P6 non-epithelial cells using the Smart-seq2 protocol [29]. Using a series of quality control steps (Fig. 1B–D), we identified 329 non-epithelial cells and 626 epithelial cells. The median read count for non-epithelial cells is 625,900, and for epithelial cells is 583,033. The median number of genes detected per cell was 2672 and 3326.5 in non-epithelial and epithelial cells, respectively. We were curious by these differences in detectable genes per cellular compartment and found that among the 12 subsequently annotated distinct cell groups (Fig. 1E), the median number of detectable genes per cellular compartment loosely correlated with the cell type’s differentiation state (Fig. 1E’). In other words, taking the number of differentially expressed genes as a surrogate of differentiation status, we observe that hair cells account for most of the difference between the median number of detectable genes between the epithelial and non-epithelial cell compartments (Fig. 1E’). Differential gene expression using a non-parametric Wilcoxon rank sum test showed a total of 16,611 genes with a false discovery rate (FDR) < 0.1 (Fig. 1F). Cell annotation based on known marker genes revealed five epithelial cell types and seven non-epithelial cell types. Similar to our prior findings, the epithelial cells fall into categories of type I (Xirp2, Kcna10, Atp2b2) and type II (Slc52a3, Atoh1, Rasd2) hair cells, supporting cells (Ush1c, Dkk3, Nptx1, Agr3), transitional epithelial cells (TECs) (Dclk1, Slc26a4, Cldn4), and roof cells (Enpep, Steap4, Panx3). The non-epithelial cells are comprised of periotic mesenchyme (Otor, Dcn, Col1a2), pericytes (Vtn, Aspn, Kcnj8), Schwann cells (Mpz, Mag, Slc36a2), glia (Plp1, Cdh19, Gjc3), endothelial cells (Kdr, Cldn5, Ptprb), macrophages (Cx3cr1, C1qc, Pf4), and melanocytes (Tspan10, Mlana, Trpm1). Taken together, these results define the cellular heterogeneity of the utricle with the epithelial compartment comprised of the hair cells, supporting cells, TECs, and roof cells, while the non-epithelial compartment is comprised primarily of mesenchyme with distinct other cell types.
Fig. 1
Transcriptomic diversity of the postnatal mouse utricle. A Schematic illustration of experimental setup depicting the harvest of utricles from neonatal mice (age P4 and P6). The sensory epithelium was separated from the underlying non-epithelial tissues following enzymatic digestion with thermolysin and mechanical peeling. These two compartments were separately placed into a single-cell suspension and underwent plate-based single-cell RNA sequencing using the Smart-seq2 method. Quality control was performed, and the cells that were excluded are highlighted in red and were based on B low read counts, C low gene counts, and D high percentage of mitochondrial genes. E UMAP plot of all cells (n = 955) that passed quality control. There were twelve identified clusters, and marker genes were used to annotate the cell types. E’ Cross-sectional diagram of the utricle highlighting the epithelial and non-epithelial cell compartments. The sunburst plot on the left shows the number of cells per cluster with the outer gray rim representing the epithelial compartment and the light blue rim representing the non-epithelial compartment. The sunburst plot on the right depicts the total number of differentially expressed genes per cell group, highlighting the two hair cell groups in light purple as the cells with the highest number of differentially expressed genes. F Heatmap showing the top 25 differentially expressed genes in each cell cluster with representative genes shown on the right side of the heatmap (full list is provided in Supplementary Data File 1). The color on the heatmap depicts relative expression from low (dark blue) to high (yellow) expression
Epithelial and Non-Epithelial Cell CompartmentsWe first focused our analysis on defining the differentiating features between the epithelial and non-epithelial compartments of the utricle (Fig. 2A). Expression of the marker gene Epcam (CD326) has previously been reported as a pan-epithelial marker (Fig. 2B) [30]. This validated our metadata and computational prediction that hair cells, supporting cells, transitional epithelial cells, and roof cells are epithelial in origin. Notably, Epcam expression is lower in hair cells (type I and type II hair cells) as a group compared to the remainder of the epithelial cells (Fig. 2B and C). Direct comparison of non-epithelial versus epithelial cells with a non-parametric Wilcoxon rank sum test shows 678 genes to be differentially enriched in the non-epithelial cells and 1255 genes differentially enriched in the epithelial cells (Fig. 2D). To validate these computational results, we selected Krt18 for immunohistologic analysis. We chose Krt18 as it is a well-known epithelial marker in other systems but has not been characterized in the inner ear. Krt18 is more highly expressed in epithelial cells compared to mesenchyme (Fig. 2D–F) (p < 0.001). Antibodies to Krt18 label cells in the epithelial cell layer, primarily supporting cells, with some limited expression in hair cells (Fig. 2G, Fig. S1).
Fig. 2
Epithelial and non-epithelial compartments of the utricle. A UMAP plot depicting the sensory epithelial cells in orange and their hair cell and non-hair cell subsets and the non-epithelial cells in blue. B Epcam expression plot demonstrating the log2 expression in each cell plotted on the UMAP. C Epcam is a marker that differentiates the epithelial compartment from the non-epithelial compartment and is present in both hair cells and non-hair cell epithelium, albeit lower in expression in hair cells. D Volcano plot demonstrating the genes enriched in the epithelial cells versus the non-epithelial cells as calculated by pseuodbulk DESeq2 analysis. A total of 678 genes are enriched in the non-epithelial compartment, while 1255 genes are enriched in the epithelial compartment (full list of genes provided in Supplementary Data File 2). E, F Krt18 is a marker that is found primarily in non-hair cell epithelial cells as shown on this UMAP expression plot and violin plot with occasional low expression in hair cells. G Anti-KRT18 antibody stains primarily the supporting cells (green) in the epithelial cell layer, with anti-MYO7A (red) as a hair cell cytoplasmic stain and nuclei stained with DAPI (blue). Orthogonal image is at the level of the hair cell layer indicated by the yellow dotted line. There are occasional hair cells that co-label with MYO7A (white arrows in merged column). Note the lack of expression of KRT18 in the mesenchyme layer. Cartoon diagram inset depicts (red horizontal line) the level at which the image was acquired. SE, sensory epithelium; MES, mesenchyme. Asterisks and arrowheads indicate the same cells
Perivascular and Immune CellsThe non-epithelial compartment of the utricle is rich in other cell types: endothelial cells, pericytes, Schwann cells, glia, macrophages, and melanocytes. Each of these cell groups has unique molecular markers when compared to all other cells in the dataset (Fig. 3A–G). Glial cells express marker genes such as Ednrb, Arpc1b, and Fabp7 (Fig. 3B). Intimately associated with the vasculature are pericytes that express Itga1, Gucy1a3, Rgs5, and Ednra (Fig. 3C). Mpz, Plp1, Mbp, and Pmp22 are all known Schwann cell genes that are defining features of utricular Schwann cells as well (Fig. 3D) [16]. The vasculature of the utricle consists of vascular endothelial cells that express Cldn5, Flt1, Ppp1r16b, and Pecam1 (Fig. 3E). Utricle macrophages express hallmark genes such as Csf1r, Aif1, Cd83, and C1qb (Fig. 3F) [31]. Finally, melanocytes are pigment-expressing cells of the inner ear that display Gpnmb, Tyrp1, Pmel, and Kcnj13 (Fig. 3G). The macrophage marker, Iba1 (Aif1), is observed to be adjacent to the rich vasculature of the non-epithelial compartment as marked by Pecam1 immunolabeling and absent from the epithelial compartment (Fig. 3H). These diverse cell types highlight the non-epithelial compartment’s roles in nutrient supply via the vasculature and the prominent role of the immune system via macrophages and glial cells.
Fig. 3
Non-mesenchymal cell types of the non-epithelial compartment. A UMAP highlighting annotated non-epithelial and non-mesenchymal cell clusters. B–G Violin plots of four differentially expressed genes in each cell cluster compared to all other cells in the dataset on a log2 expression scale. H Whole mount immunohistochemistry of the mouse utricle showing the macrophage marker anti-IBA1 (red, also known as AIF1) and the endothelial cell marker anti-PECAM1 (green) found adjacent to each other in the non-epithelial compartment. These two cell markers are absent in the epithelial compartment (second row). Cartoon diagram inset depicts (red horizontal line) the level at which the image was acquired
Mesenchymal CellsThe mesenchymal cells within the non-epithelial compartment are the dominant cell type (Fig. 1E). The main cluster of mesenchymal cells is characterized by the expression of Otor, Dcn, Coch, Car3, and Ptgds (Fig. 4A). Within the cochlea, there are multiple types of mesenchymal cells during development prior to the onset of hearing [17]. We therefore hypothesized that there are also different subgroups of mesenchymal cells within our data. To answer this question, we subset the mesenchymal cells into a separate manifold (Fig. 4B and C). Reclustering revealed three distinct subpopulations of mesenchyme (S0, S1, and S2) (Fig. 4C). Differential gene expression among these three clusters shows unique marker genes such as Plekhb1, Col8a1, and Dmp1 for S0, S1, and S2, respectively (Fig. 4D–G). We further hypothesized that some of the clusters of mesenchymal cells are age-dependent. To test this, we determined the proportion of cells of each cell cluster based on age (Fig. 4H). This demonstrates that in cluster S0, there is a higher proportion of cells from P4 than P6 when compared to clusters S1 and S2 (Chi-squared, p = 1.639 × 10⁻⁶).
Fig. 4
Heterogeneity of mesenchymal cells. A The top differentially expressed genes in the mesenchymal cell cluster compared to all other cells plotted on a log2 expression scale. B UMAP highlighting the mesenchyme cell cluster in blue, and these cells were subsetted and reclustered. C Reclustering of the mesenchyme cell group revealed three computationally distinct cell states (S0, S1, and S2) and are plotted on a UMAP, with their distribution in the pie chart inset. D Heatmap of the top differentially expressed genes in each mesenchymal cell state (subcluster) with the top three highlighted genes listed on the right (complete list of genes in Supplementary Data File 3). E–G Violin plots depicting the log2 expression of the representative differentially expressed genes in the three different cell states determined by reclustering the mesenchymal cell group, E for S0, F S1, and G S2. H The proportion of cells originating from P4 and P6 mice in each cell state are plotted here. In S0, there is a statistically greater proportion of P4 origin cells when compared to S1 and S2 states based on X2-testing (X2(2, n = 223) = 26.642, p < 0.001). I, I’ UMAP plot showing log2 expression of the mesenchymal marker Wif1. Combined in situ hybridization of Wif1 and immunohistochemistry of MYO7A shows Wif1 mRNA (green) to be primarily localized to the mesenchymal layer (this is a part of the full image shown in Fig. S2D). DAPI is shown in blue. J, J’ UMAP plot showing Dcn expression to be highly specific to mesenchymal cells with combined in situ hybridization and immunohistochemistry validation confirming expression of Dcn mRNA in the mesenchymal layer (this is part of the full image shown in Fig. S2E). DAPI is shown in blue. K Quantification of in situ hybridization puncta shows that Wif1 expression trends towards higher levels in the mesenchyme, although this is not statistically significant (t-test, p = 0.3232), while expression of Dcn is much higher in the mesenchymal compartment compared to the sensory epithelium (t-test, = 0.00525). Scale bars = 20 µm; SE, sensory epithelium; MES, mesenchyme
While some of the pan-mesenchymal markers, such as Ptgds, are ubiquitous in the mesenchyme of multiple organs, others are specific to the inner ear, such as Otor and Coch [32, 33], highlighting the unique role of mesenchyme within the inner ear. We performed validation experiments in postnatal utricles focusing on Wif1 and Dcn expression (Fig. 4I–K, S2A–B), both of which are pan-mesenchymal marker genes. Combined in situ hybridization with anti-MYO7A immunohistochemistry shows that Wif1 mRNA is localized primarily in the non-epithelial compartment of the utricle (Fig. 4I and I’; S2A). Dcn, another mesenchymal marker, was also primarily localized to the mesenchymal layer (Fig. 4J and J’; S2B). Given the quantitative nature of the transcriptomic computational analysis, we sought to determine if this translated to the tissue level. We therefore quantified mRNA expression in our tissue sections for both Wif1 and Dcn. Quantification of mRNA puncta was carried out and separated by epithelial and non-epithelial compartments (Fig. 4K). There is a statistically significant difference between Dcn expression in the epithelial compartment compared to the non-epithelial compartment. However, analysis of Wif1 compartments showed that while there is a trend toward high expression in the non-epithelial compartments, this is not statistically significant (Fig. 4K). One possible explanation for the variability seen with Wif1 in the non-epithelial compartment may be hidden spatial distributions that are not well captured by cryosections and better determined on whole mount preparations.
We next compared the utricular mesenchymal cells with recently investigated cochlear periotic mesenchyme. Rose et al. (2023) showed that the developing cochlea from embryonic day 15 and postnatal day 7 harbors four spatially distinct mesenchymal cell populations consisting of basement membrane (type I), spiral limbus (type II), modiolar (type III), and lateral wall (type IV) [17]. We reasoned that our postnatal dataset from P4 and P6 is closest developmentally to the available cochlear postnatal P7 dataset from Rose et al. (2023). Therefore, we integrated the P7 cochlea mesenchyme data with our P4 and P6 utricle mesenchyme data into the same manifold UMAP space (Fig. S2C). The utricle mesenchyme transcriptionally resembles the type IV lateral wall and type II spiral limbus cochlear mesenchyme. Nearly 90% of the utricular mesenchyme co-cluster with the type IV and type II cochlear mesenchyme (Fig. S2D). These findings support the notion that the mesenchymal cells of the vestibular apparatus resemble the cochlear mesenchyme.
Crosstalk Between Cell GroupsThe utricle has an epithelial compartment that spans the sensory and non-sensory epithelium (transitional epithelial cells and roof cells), as well as a non-epithelial compartment composed primarily of mesenchymal cells (Figs. 1E and 5A). To test the hypothesis that different cell groups in these compartments are communicating among each other, we utilized the CellChat algorithm. This computational algorithm quantitatively infers signaling inputs and outputs using single-cell RNA-seq data [26]. CellChat utilizes the Kyoto Encyclopedia of Genes and Genomes (KEGG) database and a manually curated primary literature database to interrogate approximately 2021 ligand-receptor pairs comprising secreted signaling molecules, extracellular matrix-receptor interactions, and cell–cell contacts [26]. We focused our analysis on the five sensory epithelial cell groups and the mesenchymal cells. Our computational data shows a rich environment of intercellular interactions among nearly all the groups of cells tested (Fig. 5B). The cumulative number of significant paracrine signal interactions from the mesenchymal cells totals 63, while roof cells, type II HCs, supporting cells, TECs, and type I hair cells have cumulative significant outgoing signaling interactions totaling 57, 32, 43, 50, and 29, respectively. The number of significant paracrine interactions for mesenchymal cells, roof cells, type II HCs, supporting cells, TECs, and type I HCs were 15, 17, 4, 12, 12, and 1, respectively (Fig. 5B). Taken together, these data reveal the rich paracrine and autocrine signaling that is present among all of the tested cell types with particularly high outgoing signals by the mesenchymal cells.
Fig. 5
Mesenchymal cells are the dominant signal senders. A A confocal microscopy image staining epithelial cells marked by anti-EPCAM antibody (green) and DAPI nuclei (blue) showing the location of roof cells, transitional epithelial cells (TEC), hair cells (HC), and supporting cells (SC). The mesenchymal (MES) cell compartment is located beneath the epithelial cells. B A plot depicting the number of inferred ligand-receptor interactions between each cell cluster. Individual outgoing patterns for each cell type are shown, and the thickness of each arrow represents the number of paracrine signaling interactions, and loops represent autocrine signaling. The number of ligand-receptor interactions is labeled. The dot size reflects the proportional number of cells in each cluster. C, D Heatmaps demonstrating dominant outgoing signaling (C) and incoming signaling (D) patterns for each cell cluster. For the mesenchymal cell cluster, the communication probability (warmer colors show higher probability and cooler colors lower probability) is plotted on the dot plots for the E mesenchymal cells as signal senders and F mesenchymal cells as signal receivers
The identity of the signaling pathways consists of 26 pathways with significant interactions among the different cell types (Fig. 5C and D). These signaling pathways fall into three general outgoing and incoming patterns (Fig. S3). We reasoned that since in multiple other systems mesenchymal cells are dominant signal senders, we focused on mesenchymal cells to identify specific ligand-receptor pairs with statistically significant interactions (Fig. 5E and F) [9, 11, 12]. Different cell groups within the epithelial compartment have varying interactions with the mesenchymal signals that are received (Fig. 5C and D). For example, the IGF pathway through Igf1, Igf2, and Igf3 appears to have ubiquitous but low levels of signaling to all five cell types within the epithelial compartment through both Igf1r and Igf2r. However, Bmp7 signaling that originates from the mesenchyme is primarily received by the roof cells through a combination of co-receptors: Bmpr1b + Bmpr2, Bmpr1a + Bmpr2, and Acvr1 + Bmpr2. Other signaling mechanisms, such as pleiotrophin (PTN), show robust and elevated signal-to-receptor interaction across all the cell types. The PTN pathway stands out with the highest communication probability predicted for mesenchyme as signal senders, while osteopontin (Spp1), pleiotrophin (PTN), and midkine (Mdk) pathways show the highest probability of mesenchymal signal reception (Fig. 5E and F). These data reveal both the heterogeneity and specific patterns of signaling among the cell types of the sensory epithelium and the mesenchyme.
PTN and TGFβ SignalingTo further characterize cell–cell interactions between the mesenchymal and epithelial compartments, we focused on two significant developmentally influential pathways: PTN and TGFβ signaling (Fig. 6). The Tgfβ2 signaling pathway has been implicated in early embryonic inner ear development and senescence during the otocyst stage [34]. And similarly, the pleiotrophin pathway has been shown to be involved in cell proliferation and developmental processes in the central nervous system [35, 36]. To determine how a community of cells interacts within the utricle, we applied CellChat’s social network analysis tool. Social network analysis determines the role of communication patterns in four categories: sender, receiver, mediator, and influencer [37]. We tested whether we could predict cell group behavior relative to other groups to unveil their communication patterns. Our analysis predicts that pleiotrophin has the highest signal intensity emitted from the mesenchymal cells as senders and type I hair cells as receivers, while supporting cells serve as mediator, influencer, and receiver (Fig. 6A). TGFβ signaling displays more sparse social network signaling with the dominant sending signal coming from supporting cells, while the receivers are predominantly mesenchymal cells (Fig. 6B).
Fig. 6
PTN and TGFβ signaling as examples of robust crosstalk between the epithelial and non-epithelial compartments. A Social network analysis showing the different network roles (sender, receiver, mediator, or influencer) of each cell cluster in the PTN signaling pathway. B Social network analysis showing the different network roles of each cell cluster in the TGFβ signaling pathway. C A hierarchy plot highlighting the inferred PTN signaling sources and targets with mesenchyme and supporting cells as the dominant sources of signaling. D A hierarchy plot showing the inferred TGFβ signaling sources and targets with supporting cells being the dominant signal senders. E The strength of PTN pathway outgoing and incoming signaling for each annotated cell cluster. The mesenchymal cell cluster (Mes) has the highest outgoing signal strength. F The strength of TGFβ pathway outgoing and incoming signaling for each annotated cell cluster. The mesenchymal cells display the highest incoming cell signals here. G The relative contribution of each ligand-receptor pair for the PTN and TGFβ signaling pathways. H Violin plots showing the relative expression of each ligand and receptor in the PTN pathway across annotated cell clusters. I Violin plots showing the relative expression of each ligand and receptor in the TGFβ pathway across annotated cell clusters
We utilized signaling pathway network analysis to predict which cells were expressing PTN and TGFβ signaling genes (Fig. 6C and D). The source of PTN is predominantly from mesenchyme and supporting cells (Fig. 6C and E). The dominant source of TGFβ signaling is within the epithelial compartment and is comprised mainly of supporting cells and roof cells (Fig. 6D and F). The prime target and signal receivers of TGFβ signaling are the mesenchymal cells (Fig. 6D and F). To assess the relative contribution of different ligand-receptor pairs within a family of genes, we quantified the relative contribution of each ligand-receptor pair in PTN and TGFβ pathways (Fig. 6G–I). Ptn ligand has 4 receptor partners that include Ptprz1, Sdc2, Sdc3, and Sdc4. TGFβ signaling is comprised of Tgfβ2 and Tgfβ3, both bind to receptor pairs Tgfβ1r and Tgfβ2r (Fig. 6G–I). Ptn and Ptprz1 are unique in that there is robust signaling to just the sensory epithelial cells (type I and II hair cells, and supporting cells) that spares the roof cells and TECs (Fig. 6G and H). In practical terms, this analysis reveals that, for PTN signaling, it is likely the mesenchymal cells produce most of the Ptn ligand, and the entire epithelial compartment are the most likely principal receivers. For TGFβ signaling, it is likely that the supporting cells produce the most Tgfβ ligand, and the mesenchyme are the principal receivers. Taken together, these results highlight the complex reciprocal interactions within an organ that go beyond individual cells communicating with each other.
In Vivo Validation of Ligand-Receptor PairsTo validate the computational predictions of the cell–cell interactions, we again focused on PTN and TGFβ pathways through in vivo experiments. Analysis of Ptn ligand mRNA and Ptprz1 receptor mRNA distribution in our single-cell data confirms that expression of Ptn spans nearly the entire mesenchymal cell population with some expression in the supporting cells and roof cells, while co-expression with Ptprz1 receptor is restricted primarily to the supporting cells (Fig. 7A). Ptprz1 receptor is also highly expressed in the hair cells (Fig. 7A). Tgfβ2 ligand mRNA is primarily expressed in the supporting cells with less expression in the mesenchyme, while Tgfβ2-receptor mRNA is mostly expressed in the mesenchyme with minimal expression in the TECs (Fig. 7B). There is minimal overlap in the expression of Ptn and Ptprz1 within the mesenchymal cells (Fig. 7B).
Fig. 7
Validation of PTN and TGFβ signaling within the utricle. A Co-expression UMAP plot depicting the relative expression of Ptn (cyan), Ptprz1 (magenta), and overlapping expression in blue. Ptn expression is primarily in the mesenchyme with some expression in supporting cells that overlaps with Ptprz1 expression. B Co-expression UMAP depicting the relative expression of Tgfβ2 (cyan), Tgfβ2r (magenta), and overlapping expression in blue. There is co-expression of Tgfβ2r within the mesenchyme but exclusive expression of Tgfβ2 in the supporting cells. In A and B, the sensory epithelial cells are outlined and shaded in gray. C Cross-section confocal microscopy image depicting the expression of Ptn mRNA (red), Ptprz1 mRNA (green), and hair cells stained with anti-MYO7A antibody (blue). D Representative cross-section confocal image depicting the expression of Tgfβ2 mRNA (green), Tgfβ2r mRNA (red), and anti-SPARCL1 antibody (blue). E Quantification violin plots of the number of puncta per square micron. The number of puncta per µm2 of Ptn-mRNA (ligand) expression in the mesenchymal compartment was not statistically significant when compared to the sensory epithelial compartment (t-test, p = 0.1509). However, Ptprz1-mRNA (receptor) expression was high in the sensory epithelium and lower in the mesenchyme (t-test, p = 0.003095) validating the computational predictions. The number of puncta per µm2 of Tgfβ2-mRNA (ligand) was also statistically different and was higher in the sensory epithelial compartment when compared to the mesenchymal compartment (t-test, p = 2.765 × 10e-5). Conversely, the number of puncta per µm2Tgfβ2r-mRNA (receptor) was higher in the mesenchymal compartment when compared to the sensory epithelial compartment (t-test, p = 0.02016). F Model showing the roles of Ptprz1/Ptn receptor-ligand combo on the left, and Tgfβ2r/Tgfβ2 receptor-ligand on the right
Using combined multiplex in situ hybridization and immunohistochemistry, we validated our computational prediction of the Ptn/Ptprz1 ligand-receptor pair where Ptn is nearly ubiquitously expressed throughout both epithelial and mesenchymal compartments, while Ptprz1 is restricted to the epithelial compartment (Fig. 7C). Quantification of the mRNA abundance levels validates the computational prediction and matches the expression patterns (Fig. 7E). As a second validation target, Tgfβ2 ligand transcript is primarily detected within the epithelial compartment compared to the Tgfβ2r transcript that is predominantly expressed in the mesenchymal compartment (Fig. 7D). mRNA puncta quantification shows a statistically significant difference between epithelial and non-epithelial compartments (Fig. 7E). This mRNA expression pattern mimics the predicted expression levels of Tgfβ2 and Tgfβ2r in the single-cell RNA-seq data (Fig. 7B). Taken together, these two receptor-ligand pair patterns of expression validate the computational predictions (Fig. 7F).
Expression of Hearing Loss and Vestibulopathy Associated GenesWe wanted to test whether our validated dataset has any relevance to hearing loss-related genes and vestibular disorders. To do this, we used a previously published list of human hearing loss and vestibular disorders associated genes [16]. Not surprisingly, there are many genes in both the hearing loss and vestibular disorders lists that map to hair cells or supporting cells (Fig. 8A and B). However, more interestingly, there are many genes that map to cell groups from the non-epithelial compartment. For example, Dpt in mesenchyme, Cpne4 in melanocytes, Mill2 in glia. This highlights the importance of non-epithelial cell compartments in health and disease.
Fig. 8
Mapping human hearing loss and vestibular dysfunction-related genes to the annotated mouse utricular single-cell RNA-seq transcriptome. A Heatmap of the relative expression of known hearing loss-related genes across the different annotated cell clusters. B Heatmap of the relative expression of known vestibulopathy-related genes across the different annotated cell clusters
Comments (0)