Animals
All animal experiments were performed in accordance with institutional guidelines provided by the Institutional Animal Care and Use Committee (IACUC, protocol 22080 USDA, PRV 19085) at The Rockefeller University and ARRIVE guideline. Adult American bullfrogs (Rana catesbeiana) of both sexes were purchased from Frog Pharm (Twin Falls, ID, USA). Female C57BL/6 N mice 7 to 8 weeks of age were obtained from Charles River Laboratories (Wilmington, MA, USA).
Antibodies and Reagents
We used the following antisera and dilutions: anti-MYH9 (ab238131; Abcam, Cambridge, UK; 1:50); anti-MYH10 (ab230823; Abcam; 1:50); anti-MYH14 (20,716–1-AP; Proteintech, Rosemont, IL, USA; 1:50); anti-MYL12A (16,287–1-AP; Proteintech; 1:100); anti-MYL12B (10,324–1-AP; Proteintech; 1:100); anti-MYL9 (ab191393; Abcam; 1:50); anti-phospho-myosin light chain 2 (3671; Cell Signaling Technology, Danvers, MA, USA; 1:50); Alexa Fluor 488-labeled secondary antibody (Thermo Fisher Scientific, Waltham, MA, USA; 1:500). F-actin was labeled with rhodamine-phalloidin (PHDR1; Cytoskeleton, Inc., Denver, CO, USA; 1:167).
We also employed the following reagents: Dako Protein Block Serum-Free (Agilent, Santa Clara, CA, USA); Dako Antibody Diluent (Agilent); VECTASHIELD Antifade Mounting Medium (Vector Laboratories, Newark, CA, USA); blebbistatin (ab120425; Abcam); protease XXIV (Sigma-Aldrich, St. Louis, MO, USA); PeriAcryl90 (GluStitch Inc., Delta, BC, Canada); ML7 (ab120848; Abcam); MLCK inhibitor peptide 18 (19,181; Cayman Chemicals, Ann Arbor, MI, USA).
The concentration of blebbistatin [11], ML7 [12], and MLCK inhibitor peptide 18 [23, 24] was determined according to the previous reports. Blebbistatin and ML7 were stocked in DMSO, and inhibitor peptide was stocked in distilled water. We confirmed that DMSO treatment did not cause any changes in each experiment (data not shown).
Immunofluorescence Labeling
Samples were fixed for 30 min at room temperature with 4% formaldehyde in 0.1 M phosphate-buffered saline solution (PBS). After permeabilization for 30 min at room temperature in 0.2% Triton X- 100 in PBS, they were blocked for 30 min at room temperature with Dako Protein Block Serum-Free. The samples were incubated overnight at 4 ℃ with primary antisera in Dako Antibody Diluent. Sections were incubated for 60 min at room temperature in Alexa Fluor secondary antiserum in blocking solution. VECTASHIELD was used to mount samples. To label F-actin, rhodamine phalloidin was incubated in the blocking solution for 60 min at room temperature. Confocal images were acquired with an IX83 laser scanning microscope (Olympus, Tokyo, Japan) with a UPlanS Apo 60X objective lens (Olympus).
Physiological Recording from Bullfrog Saccules
The frog saccule was dissected as previously described [25]. The dissection was performed in oxygenated artificial perilymph containing 114 mM Na+, 2 mM K+, 2 mM Ca2+, 118 mM Cl−, 3 mM D-glucose, and 5 mM HEPES at pH 7.3. The preparation was exposed for 35 min at 26 ℃ to 66 mg/mL protease XXIV in artificial perilymph. After the otolithic membrane had been detached from each specimen by the enzyme treatment, it was removed with fine forceps.
The previously reported protocol to build a two-compartment experimental chamber was optimized for the present study [25, 26]. The saccule was sealed with PeriAcryl 90 cyanoacrylate adhesive over a hole 500–700 µm in diameter in a 10-mm square of aluminum foil with the hair bundles facing upward. Vacuum grease was put on the surface of the lower and upper chambers to prevent the solutions from leaking and mixing with each other. The foil-mounted saccule was then placed atop the lower compartment which was filled with the artificial perilymph. The upper compartment was placed on the foil and filled with artificial endolymph containing 2 mM Na+, 118 mM K+, 0.25 mM Ca2+, 118 mM Cl−, 3 mM D-glucose, and 5 mM HEPES at pH 7.3. To adjust the temperature, a temperature controller (TC200; Thorlabs, Newton, NJ, USA) was placed in the upper chamber.
The optical configuration that was previously reported [27] was optimized for the present study. The frog saccule in the two-compartment chamber was placed under an upright microscope (BX51 WI; Olympus, Center Valley, PA, USA) and visualized with a 60X water-immersion objective lens (LUMPlanFL N; Olympus). The microscope was placed on an antivibration table (Micro-g; TMC, Peabody, MA). To record an oscillation and displacement of hair bundles, the specimen was illuminated with a 630 nm light-emitting diode (UHPTSR; Prizmatix, Holon, Israel). The image was projected at a magnification of 1300X onto a dual photodiode, whose calibrated signal represented hair-bundle displacement.
Estimation of Hair-Bundle Stiffness
To measure the stiffness of hair bundles, force was applied by a flexible glass fiber (Figure S1A). After a quartz capillary 1.2 mm in diameter (Q120-60-7.5; Sutter Instruments, Novato, CA, USA) had been tapered with an electrode puller (P2000; Sutter Instrument), its tip was melted and pulled laterally to form a fiber for hair-bundle stimulation. To enhance contrast on the photodiode, the fiber was sputter-coated with gold–palladium (Hummer 6.2; Anatech, Sparks, NV, USA). The stiffness and drag coefficient were estimated by measuring Brownian motion in water with photodiode sampling at 10,000 s-1 [27, 28]. The stiffness of the fibers (Kf) was 150-400 μN·m-1.
A fiber mounted on a piezoelectric actuator (PA 4/12; Piezosystem Jena, Hopedale, MA, USA) was attached to a hair bundle at the kinociliary bulb with a micromanipulator (MP285, Sutter Instrument). The fiber’s displacement (ΔXf) was controlled with LabVIEW 2019 software (National Instruments, Austin, TX, USA). The glass probe was displaced in five steps, ranging from 20 to 100 nm, to move the hair bundle in the negative direction such that the transduction channels were largely closed (Figure S1A, left and middle panels). Stimuli 100 ms in duration were presented every 200 ms. The values of ten repetitions at each stimulus magnitude were averaged and recorded. The hair-bundle displacement (ΔXHB) was calculated as the average value 30–45 ms after the onset of a stimulus pulse (Figure S1A). Finally, the stiffness of hair bundles of each step (KHB (single step)) was obtained by the following formula: KHB (single step) = [(ΔXf − ΔXHB)/ΔXHB]·Kf. KHB (single step) for each of the five steps was averaged and used as an estimate of hair-bundle stiffness (KHB). To measure the stiffness of hair bundles with broken tip links, we added 2 mM EDTA to endolymph for 30 min, then displaced bundles as mentioned above (Figure S2A,B).
Furthermore, to observe the displacement of the cuticular plate, borosilicate glass microspheres 2 µm in diameter (Duke Scientific, Palo Alto, CA, USA) were placed on the apical cellular surface above the cuticular plate (Figure S3A) and the displacement of the glass beads was measured while the hair bundle was displaced (Figure S3B,C).
The data were obtained from ten hair cells in different animals. The data from each hair bundle were the averages of the ten repetitions of the recording.
Observation of Spontaneous Hair-Bundle Oscillation
Hair-bundle oscillation is readily observable with the optical system described above. To quantify the displacements, 10 s segments of spontaneous hair-bundle oscillation were measured with the photodiode and recorded (LabVIEW 2019). A high-speed camera (Phantom VEO710L; Vision Research, Wayne, NJ, USA) was also used to record spontaneous oscillation. The video data were extracted as consecutive TIF images and the movement of hair bundles was tracked by the TrackMate plugin [29] of Fiji (ImageJ) [30]. Oscillations were recorded before and after treatment with inhibitors and after washout.
Recording of Microphonic Potentials
For the recording of microphonic potentials, which provide a means of assessing the average response of an ensemble of hair cells, a frog’s saccule was placed in a two-compartment experimental chamber [31, 32]. The saccule was sealed with cyanoacrylic adhesive (PeriAcryl 90) across a hole 500–700 µm in diameter through a circular plastic coverslip 10 mm in diameter and 200 µm in thickness (12,547, Thermo Fisher Scientific). The mounted saccule was placed between gaskets of thermoplastic material (Parafilm, Amcor, Zurich, Switzerland) to provide electrical isolation and prevent the mixing of solutions. The coverslip was placed over the lower compartment, which was filled with artificial perilymph containing 99 mM Na+, 19 mM K+, 2 mM Ca2+, 118 mM Cl−, 3 mM D-glucose, and 5 mM HEPES at pH 7.3. By partially depolarizing the hair cells, this high-K+ perilymph minimized voltage-, time-, and Ca2+-sensitive currents and thus simplified the analysis of microphonic responses [31]. The upper compartment was then added to the chamber and filled with artificial endolymph.
To elicit responses from a group of hair cells with similarly oriented hair bundles, we partially removed the otolithic membrane [31]. Displacements produced by a piezoelectric actuator (PA 4/12, Piezosystem Jena) were applied to the remaining otolithic membrane by means of a glass probe produced by melting and roughening the tip of a micropipette. The displacement of the glass probe was controlled by LabVIEW 2019 software, and the maximal amplitude was adjusted to the value that evoked a saturating response. The glass probe was displaced by ten positive and ten negative steps with equal separations in their magnitudes; an unstimulated control was also recorded. The responses were averaged across three repetitions. To estimate the resting open probability, we first determined the maximal positive response, V100%, and the greatest negative response, V0%, that were recorded between 10 and 20 ms after the onset of stimulation (Fig. 4A). Around V100% or V0%, the response was well saturated. Although it cannot be said that all channels were opened or closed at V100% or V0%, we calculated the resting open probability POR as POR = − V0%/(V100% − V0%).
The data were obtained from six different saccules. The data from each represent the average of three repetitions.
Measurement of Auditory Brainstem Responses
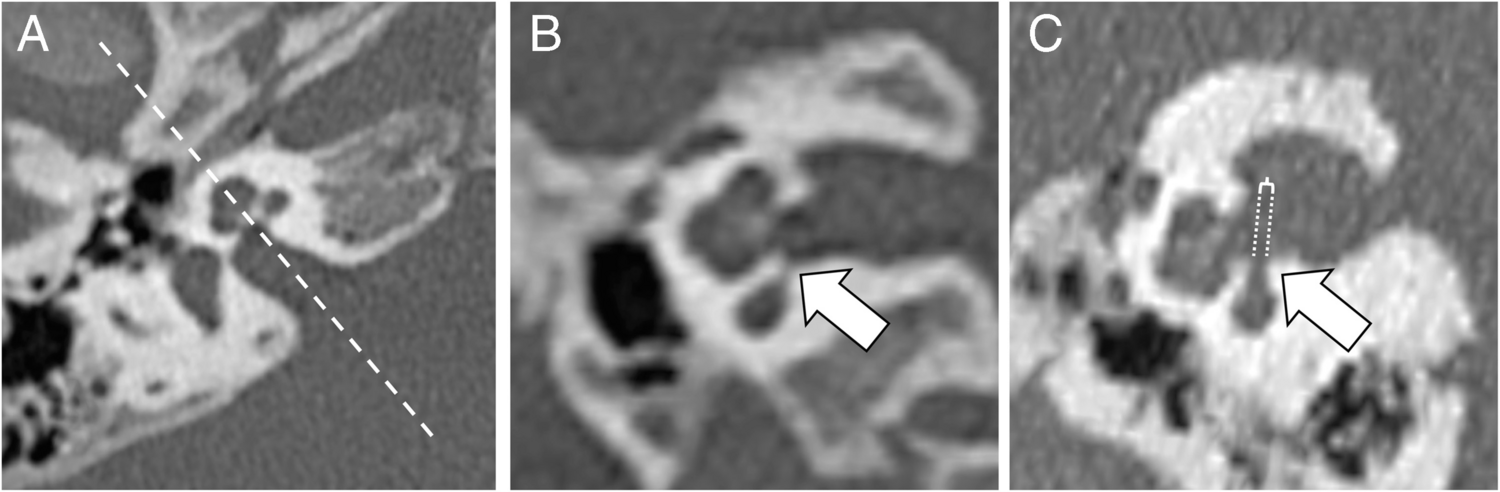
To assess the effect of inhibitors on hearing, we performed transtympanic injection of blockers prior to recording of ABRs from mice. Each animal was anesthetized with isoflurane delivered through a face mask at a concentration of 3–5% during induction and of 1–2% to maintain a surgical level of anesthesia. The tympanic membrane was visualized under a microscope and incised with a 30-gauge needle (Fig. 5A). After 5 µL of inhibitor solution or a saline control solution had been gently injected into the middle ear [33], the animal was allowed to awake and kept on a heating pad for 2 hr.
After a mouse had been anesthetized with an intraperitoneal injection of 100 mg/kg ketamine and 10 mg/kg xylazine, the ABR was recorded [34]. Computer-generated stimuli were amplified by a stereo amplifier (SA1, Tucker-Davis Technologies, Alachua, FL, USA) and delivered by a free-field speaker (MF1, Tucker-Davis Technologies). Tone-burst stimuli with rise and fall times of 1 ms and durations of 5 ms were delivered 1000 times apiece at frequencies of 4 kHz, 8 kHz, 16 kHz, and 32 kHz. Subcutaneous electrodes were inserted in three positions: a recording electrode behind the pinna, a reference electrode in the scalp, and a ground electrode in the back near the tail. The electrical signals were amplified 10,000X and bandpass filtered between 300 and 3000 Hz by a preamplifier (P55; Grass Instruments, West Warwick, RI, USA). The averaged responses were reviewed by two authors, R.O. and B.F., and hearing thresholds were determined by their agreement. In total, ten treated ears and ten control ears from ten animals were used for each analysis.


Comments (0)