
Remember me


True — Laser Doppler vibrometry (LDV) is a common methodology for auditory-related measures capable of detecting displacements that are much smaller than the wavelength of visible light. Measurements suggest that, at threshold, the human eardrum (specifically, the tympanic membrane, TyM) moves on the order of one picometer (pm; i.e., \(10^\) m) [3]Footnote 1. By comparison, the diameter of a hydrogen atom is 100 pm — two orders of magnitude larger! Fig. 1 provides some context for the remarkably small magnitude of this TyM motion and connects to Claim (H) regarding the enormous dynamic range of the earFootnote 2.
Fig. 1
Schematic to show the comparison between (top) sound pressure level at the eardrum and representative sounds at those levels and (bottom) the corresponding displacement of the eardrum [3]. Note that the human eardrum itself is very thin: only about 0.05–0.12 mm thick [5]. For the bottom plot, several objects with representative dimensions are also shown for comparison, as is the thickness of a human hair
We note that the eardrum is not a piston, in that it does not exhibit uniform motion across its surface. In fact, the sound-evoked motion of the eardrum can be highly complex (e.g., numerous higher order modes) and is not completely understood [9, 10]. Nonetheless, we provide here a simple back-of-the-envelope calculation that suggests a 1 pm displacement at threshold physically makes sense [11]. A commonly cited value is that at our most sensitive frequencies, about 1–4 kHz [12], the sound pressure threshold level (\(p_o\)) at the eardrum is \(2 \times 10^\) N/m\(^2\). This value sets the decibel “SPL” (sound pressure level) reference at 0 dB SPL. The corresponding threshold intensity (\(I_o\)) is defined at \(p_o^2/z_o\), where \(z_o\) is the characteristic acoustic impedance and is about 400 Pa s/m for ambient air. Thus, \(I_o \approx 10^\) W/m\(^2\). For sinusoidal oscillations, the air pressure depends upon several aspects of the gas itself as follows
$$\begin p = \frac \end$$
(1)
where B is the bulk modulus of the gas, \(\lambda \) is the wavelength (i.e., wave speed/frequency), and A is the amplitude of oscillation of the gas molecules. Rearranging and solving for A, one finds a value of approximately \(10^\) m, roughly in the same ballpark as the LDV measurements [3]. This means that the eardrum is moving a similar amount as the air itself in response to the acoustic pressure, which may indicate a close match in impedance between air and the TyM that reduces energy reflection. Further, we can estimate the amount of energy incident at the ear at the threshold. The human eardrum has roughly an area of 0.5 cm\(^2\), or \(5 \times 10^\) m\(^2\). Given the intensity value stated above, this would correspond to \(5 \times 10^\) W. Assume the ear requires 0.2 s to integrate a sound over near threshold for detection. The total incident energy would then be \(10^\) J (approximately \(2000\,k_BT\)), which has been shown [13] to be comparable to the incident photon energy required for visual detection!
The above calculations are specific to the human ear and different animal species may exhibit different threshold displacements. Consider the gerbil for example, where it was reported that the umbo (where the tip of the manubrium of the malleus attaches to the TyM) exhibited an approximately 1 nm amplitude for a 10 kHz stimulus at 80 dB SPL [14]. Auditory nerve thresholds at 10 kHz for gerbil are about -5 dB SPL [15]. Assuming linearity and extrapolating downwards [3, 16], that would lead to an umbo displacement of 0.1 pm, about an order of magnitude smaller than the values noted above for humans.Footnote 3 The reason for this discrepancy is not clear but may stem from the spurious assumption about linearity (e.g., eardrum motion does not scale in direct proportion with incident sound amplitude at the lowest levels, perhaps due to amplification; see Claim (J)). As a non-mammalian example, Manley [17] reported that for the Tokay gecko, eardrum displacements were 1 \(\mu \)m at 1 kHz for 100 dB re 2.0\(\times 10^\) dynes/cm\(^2\), equivalent to 100 dB SPL. This would translate (again, scaling linearly) to a 10 pm displacement at 0 dB SPL. Based on these calculations, and perhaps unsurprisingly, evolution has yielded remarkable ears across the animal kingdom.
\(\rhd \) (B) The ear is encased in the hardest bone in the bodyPartially True — The inner ear is partly encased in the petrous part of the temporal bone, also referred to as the otic capsule (Fig. 2). The name stems from the Latin word petrosus, which translates to rocky, stone-like, or petrified [18]. One suggestion is that this name derives from the notion that one primary purpose of the bone is for “offering protection from impacts, falls, and other trauma” [19], a helpful feature for the seemingly fragile inner ear. Another viewpoint is that the denser the bone, the higher the bulk modulus that would thereby affect acoustic propagation via bone conduction.Footnote 4
The density of the temporal bone is non-uniform. While the petrous portion, which sits on the floor of the cranial cavity, appears relatively dense in areas around the bony labyrinth, the mastoid portion has sections that are comparably sparse (e.g., holes to allow blood vessel passage) [24]. From a clinical perspective, this variation in density is significant, as it greatly improves surgical approaches (i.e., easier bone drilling) for procedures such as a mastoidectomy, a common approach for implantation of cochlear implants. In mammalian species used for auditory research such as gerbil, the cochlea bulges out from the base of the skull into the air-filled middle ear space (bulla). Thus, much of the murid cochlea only has a thin layer of bone around it, which may have functional consequences relative to other mammals where the cochlea is deeply embedded (e.g., see [25] for a discussion of marine mammals).
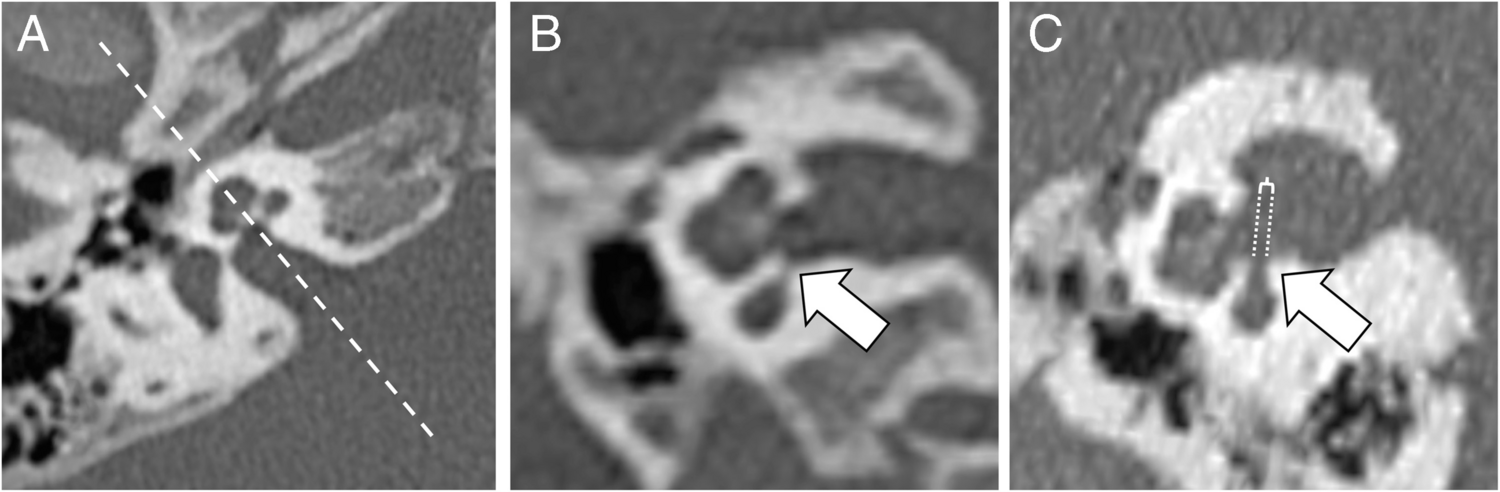
Fig. 2
A Cross-section through the base of the human skull, showing the middle ear space heading towards the cochlea. Note that around the cochlea, the bone appears denser with fewer cavities relative to the nearby mastoid area. Cross-sections of the cochlea (B) and temporal bone (C) are also shown, visually indicating the relatively dense bone surrounding the inner ear. All images are from [26] and obtained from the Wikimedia Commons where they are in the public domain
There are anecdotal accounts suggesting that temporal bone density may in fact be the highest in the body. These stem from temporal bones being used for extraction of DNA in archaeological studies (e.g., [27]). Consider this quote from [28]: “The only skeletal element for which a systematically higher endogenous DNA content compared to other skeletal elements has been shown is the petrous part of the temporal bone.” These reports allude to the petrous part of the temporal bone as being the “densest” in the body, pointing towards a 1999 tomography study [29] that claimed “The most dense element examined for each species is the petrous temporal, which is approximately 10 percent denser than the middle shaft portions of bones.” That study, however, did not examine human bones, but rather “bovids, cervids, and equids.”
Common sense dictates that other (non-bone) structures are likely the “hardest” body structures. For example, teeth are used in forensic dentistry to identify persons whose bodies have otherwise been destroyed in a fire (e.g., [30]). Another study [29] cited mineral density values of approximately 1.50 and 1.05 g/cm\(^3\) for enamel and dentine portions, respectively, while calculating cortical bone density in the range of 0.95–1.15 g/cm\(^3\). It is unclear whether temporal bones fall into the upper end of this density range. Regardless of the final calculations, temporal bones are hard, and partially encapsulate the inner ear.
\(\rhd \) (C) The ear contains the smallest bones in the bodyLikely True — Human anatomy textbooks commonly refer to the three ossicles (incus, malleus, and stapes) as being relatively small, even the “smallest” [24] or “tiniest” [31] in the body. Research articles also make similar assertions (e.g., [32, 33]), as do books on auditory sensation (e.g., [34]). Even the Guinness World Records lists the stapes as the winner in the “smallest bone” category. Relatedly, the stapedius is also commonly pointed to as the smallest striated and skeletal muscle in the body. But what is the rationale for such claims, as references are rarely, if ever, provided?
There are 200 bones in the human body [35], although this number changes with age as some bones fuse following birth. Unlike some bones in the body (e.g., skull), human ossicles are fully formed and ossified at birth, leading some to call the stapes the most “adult” bone in the developing human embryo [36, 37]. Of the three ossicles, the stapes have the shortest maximum length.Footnote 5 The footplate (which makes the final ossicular connection to the inner ear) is roughly elliptical and makes up the bulk of the stapes mass [41]. Roughly, typical dimensions are: footplate major and minor axes are 2.5 by 1.4 mm respectively (yielding a footplate area of approximately 3.5 mm\(^2\)), a height of 2.9 mm (i.e., distance from footplate to top of superstructure arch), and of a mass of 2.2–4 mg ([42], citing [43, 44]). These mass values support the argument that the stapes is the smallest bone in the human body.Footnote 6
While the claim of “smallest” appears applicable to the human middle ear ossicles, there is considerable diversity in ossicles across taxa, such that this claim may not hold true in other species. For example, terrestrial non-mammalian vertebrates such as birds and reptiles only have a single ossicle, making it unclear whether the ossicle would still be the smallest bone in their bodies. Further, in some terrestrial mammals like elephants, the ossicles appear rather large and are thought to improve ground vibration detection (e.g., [45, 46]). Similar considerations may also apply to marine mammals [45]. Numerous allometric studies of the middle and inner ears exist (e.g., [47, 48]), and it will likely prove instructive in the future to connect comparative studies with functional considerations [49].Footnote 7
To conclude this section, we quote the final paragraph from [36]: “The stapes, then, is unique in its developmental history; it is the only annulet in the human body, and the most exquisitely fashioned bone in the entire supportive system. Beginning as an obscure cog in the respiratory machine, it becomes an almost indispensable part of a sensory apparatus (...) it need not be a giant to be important. Delicacy and mobility are required for the discharge of its physiological duties; to that end, the stapes has thrown away half of its osseous self and its very marrow. It is the anatomical patriot par excellence.” As a point of contrast, a surgeon performing a stapedectomy might find this sentiment sophomoric, although a stapedectomized elephant might be very unhappy!
\(\rhd \) (D) The ear contains the most vascularized tissue in the bodyUnlikely — First, how is the degree of vascularization in the ear quantified? After all, the heart and lungs, and even tumors [53], are highly vascularized tissues. From an energy perspective, metabolic requirements for mechanical sensing systems are complex, and the vascular system is essential in this regard (see the Secomb & Pries chapter in [54]). For the cochlea, the intuitive idea is that energy is required to generate the large resting potential in the scala media (SM), [55], as explored in Claims (E) and (K). Through that lens, a high degree of vascularization makes sense: Relatively high blood oxygenation would help sustain the underlying metabolic processes needed to overcome the large electro-chemical gradients, and thereby fuel cochlear amplification.
There are two different principal pathways that supply blood to the inner ear [56]. The first pathway comes from the carotid artery and innervates the otic capsule, which constitutes the bony walls of the inner ear and contains perilymphatic fluid. This bony labyrinth is composed of several vessels extending from the end branch of the external carotid artery (maxillary, auricular, and meningeal) [57]. The second pathway comes from the cerebellar pathway (part of the vertebral arteries) and innervates the “membranous labyrinth,” which contains endolymphatic fluid and is where the hair cells reside. More specifically, this branch is the labyrinthine artery [58], which is part of vertebrobasilar branch off the cerebellar artery. It runs in parallel with the vestibulocochlear nerve along the internal auditory meatus. The stria vascularis is a thin ribbon of tissue that runs along the lateral wall of the cochlea from base to apex and is innervated by this path [56, 59]. The stria has been noted as having a high concentration of blood vessels [12, 60], but such has not been quantified.
Let us now make a simple argument based upon the relative dimensions of the cochlea. An adult has approximately 5 L of blood, and at any given time: \(\approx \) 7–10% in the heart, \(\approx \) 9–12% in the lungs, \(\approx \) 60–64% in the venous, and the remainder in the arteries and capillaries [24, 61]. While there is individual variation in cochlear dimensions [62], we can make several approximations. To first order, the volume of the cochlea is approximately 100 mm\(^3\) (\(\sim \)0.0001 L). Presumably, only a small fraction (say 5%) would comprise vasculature, which is confined to the external wall and the spiral lamina. Thus, at any given instant, a comparably small fraction of an individual’s blood (say 0.000005%) is in a given ear, an estimate roughly consistent with [63]. Understandably, there is relatively little blood flowing to the ear compared to other parts of the body. However, this does not necessarily refute the claim that the ear contains the most vascularized tissue in the body in light of other dimensional considerations.
Fig. 3
A Cochlear vasculature of the mouse via corrosion casting [64] (image used by permission of Springer Nature). Note that in the right panel, the top plot is a superposition of the two below (the bottommost showing the stria vascularis). B Heuristic schematic to consider the high degree of vascular branching. The left panel indicates a cross-section through a circular vessel of radius R. The right panel shows N (=58) vessels with radius r, where \(10 r = R\). Even though the total cross-sectional area on the right is less (i.e, the ratio of the white area to the grey area is 0.58), the epithelial surface (i.e., total circumferential length of black lines) is much larger. Thus if epithelial surface (i.e., where transport occurs) is the key quantitative measure, the case on the right is “more vascularized” by nearly a factor of 6
Recent studies of mice using cast corrosion and electron microscopy have provided detailed microanatomy of the cochlear vasculature [64, 65]. From these data, it becomes apparent that there is a high degree of vascular branching within the stria vascularis (see Fig. 3A). One takeaway from these images is that while the cross-sectional area (in a plane slicing orthogonal through the stria) may be somewhat small, the relative epithelial surface for transport is large (see Fig. 3B). Seen this way, the large degree of branching supports the cochlea as being highly “vascularized,” despite a relatively small blood volume and a rather modest number of cells being fed to (i.e., only about 10000 hair cells per cochlea). At present, we do not know if the cochlear vasculature bifurcates comparatively more than other tissues. Therefore, we conclude that the cochlea is highly vascularized, but not necessarily the most vascularized tissue.
\(\rhd \) (E) The ear has the highest resting potential in the bodyLikely True — First, let us confine considerations to membrane potentials only. That is, electrical potentials are generated across the membrane of a single cell (in contrast to cellular potentials that are generated by multiple cells). Second, we will only consider resting potentials and not activity-driven changes, such as action potentials.Footnote 8 Assuming ionic concentrations and membrane conductances are in steady-state (e.g., homeostatic conditions), this potential is nearly constant. The size of this potential varies for different cell types and ionic conditions, but is typically negative, meaning the inside of a cell is negatively charged compared to the outside (in the range of 0 to −100 mV).
For the cochlea, hair cells have a relatively normal intracellular potential relative to electrical ground (\(\approx -60\) mV). However, the stria vascularis actively pumps potassium ions (K+) against its electrodiffusive gradient. As a result, the endocochlear potential (EP) is created: a \(+80\) mV potential in the endolymph of the scala media (SM) relative to the perilymph comprising scala vestibuli and scala tympani. Thus, hair cells experience a much larger transmembrane resting potential of \(\approx 130-170\) mV across their apical surface relative to SM [66,67,68,69]. This cellular battery effectively helps drive mechano-electro transduction (MET) currents (i.e., hair bundle deflections causing K+ and calcium flow) and powers active processes. However, is this 130–170 mV the highest potential in the body?
There are numerous large trans-membrane potentials throughout the body in electrically excitable cells, such as neural action potentials (upwards of 140 mV; [70]) and cardiac cells. But as alluded to earlier, these are transient de–/re–polarizations, unlike the EP, which is relatively constant. A key facet to this large transmembrane resting potential is the unique nature of the scala media environment. To illustrate, the endolymph is considered unique in that it is an extracellular fluid that more closely resembles an intracellular fluid, in part by having a high potassium concentration [12].Footnote 9 As a result, the scala media is at \(+80\) mV relative to scala vestibuli, which leads to a \(\approx 150\) mV difference between endolymph and the inside of the cell. The unique cochlear fluid partitions do indeed appear to generate the largest resting membrane potential in the body.
\(\rhd \) (F) The ear is the fastest part of the bodyTrue — Time and spatial scales confound this statement. “Fast” is a relative term, as is “part of the body.” As a starting point, let us first consider the ear in comparison to other sensory systems. The “speed of smell” can indeed be considered fast, occurring on timescales of 10–100 ms [71, 72], though it is relatively slow compared to the ear’s response to oscillatory stimuli with periods of 0.01–10 ms. With regard to vision, the eye can be considered both fast and slow: Rhodopsin isomerization in visual phototransduction is extremely fast (i.e., femtosecond) [73], although one can readily hear a 6 kHz tone but not discern flickering in a light source at 60 Hz (see also [74]), two orders of magnitude slower. A key distinction is that signal processing in the cochlea is done hydromechanically — not neurally. This can be understood at least in part because the underlying components, primarily hair cell MET channels and motor proteins of the outer hair cell that produce motion via force generation, are much faster than the corresponding neural components (sodium and potassium channels). We first consider more generally how other parts of the body produce force, and then argue why the ear is biomechanically the fastest.
Generally speaking, individual molecular motors that metabolically act as force generators (such as actin/myosin interactions in muscles and cells, actin polymerization in filopodia, microtubule-based systems in cell division as well as flagella and cilia) tend to be comparably slow (e.g., [75, 76]).Footnote 10 However, numerous active elements collectively working together can make things relatively faster (e.g., [77, 78]), affecting important physiological functions such as cardiac muscle contraction [79]. One illustrative example are the flight muscles, which can oscillate at frequencies of 20–1000 Hz (e.g., hummingbirds clock in at 50–80 Hz, while bumblebees at 250 Hz; small midges are the fastest) [80, 81]. Another biomechanical example is the voluntary action of an “ultrafast” fingersnap, which takes several milliseconds [82].
However, the ear is faster in that it encodes mechanical oscillations at frequencies upwards of 1–100 kHz, and perhaps even higher for some cetaceans. At least for mammals, this process occurs in part because of a motor protein called prestin, which has been argued to be unique in that it “is a direct voltage-to-force converter” [83], similar to a piezo-electric material. Further, the ear can encode signals on a cycle-by-cycle basis up to several kHz [84]. This aspect, commonly referred to as “phase locking,” factors prominently into discussions on functionally important topics such as sound localization and temporal versus place coding. Some animals, such as the barn owl, can push this limit even higher, upwards of 10 kHz [85]. From this viewpoint, the ear is several orders of magnitude faster than the eye.Footnote 11
To expand, what makes the ear remarkable in the context of speed is how it pushes past the limits of biophysical “speed limits” such that a hair cell can encode precise timing information to an auditory nerve fiber. Two specific considerations bear consideration. First, the cell membrane itself acts like a low-pass filter by virtue of its resistive-capacitive (RC) time constant [55]. Second, exocytosis of neurotransmitter across the synaptic cleft between the hair cell and neuron also can only occur so fast [87]. Both these factors, and likely others, impact how timing information gets lost above a few kHz and lead to a falloff in phase locking. The structure of the synapse appears relatively optimized to not only be fast (i.e., timescales of 1 ms, [88]), but also capable of maintaining sustained responses leading to functional aspects such as “our ability to detect submillisecond differences in sound arrival at our ears” [89]. Further, the cochlea appears to have found means to still allow for cycle-by-cycle amplification well above 10 kHz (e.g., [90]), even if neural phase locking cannot maintain such speed. Historically, the RC time constant was considered a barrier to high frequency amplification, however, some more recent models posit mechanisms that could circumvent this barrier by trading off gain for bandwidth (e.g., [91]). A recent review goes so far to assert “the RC problem is, in practice, a relatively minor physical issue whose importance has been unduly magnified by viewing it through the wrong lens” [92]. Such a consideration appears consistent with the notion that evolutionary pressures have led to optimizations that result from multiple competing functionalities.
\(\rhd \) (G) The ear can detect signals below the thermal noise floorUnclear — This claim benefits from additional consideration because, as a biological detector, near threshold the ear is intrinsically more probabilistic than deterministic. That is, like the retina during scotopic (low-light) vision, a decision as to whether a stimulus is present or not derives from setting a threshold with respect to some underlying probability distribution [93]. This chiefly arises due to the presence of noise, which can manifest in several different fashions in the inner ear. For example, hair bundles experience thermal flu
Comments (0)