
Remember me


We first applied Weighted Gene Co-expression Network Analysis (WGCNA) to identify gene modules significantly associated with disease phenotypes. In the AP dataset, a soft-thresholding power of β = 6 was selected to construct a scale-free network, achieving a scale-free topology fit index (R²) of 0.85 with high mean connectivity. Based on the resulting gene correlation-based hierarchical clustering dendrogram (Figure S1A, B), the “brown” module (Cor = 0.56, p = 3 × 10⁻¹¹) and “pink” module (Cor = − 0.51, p = 3 × 10⁻⁹) were identified as the most significantly correlated with AP status (Fig. 3A).
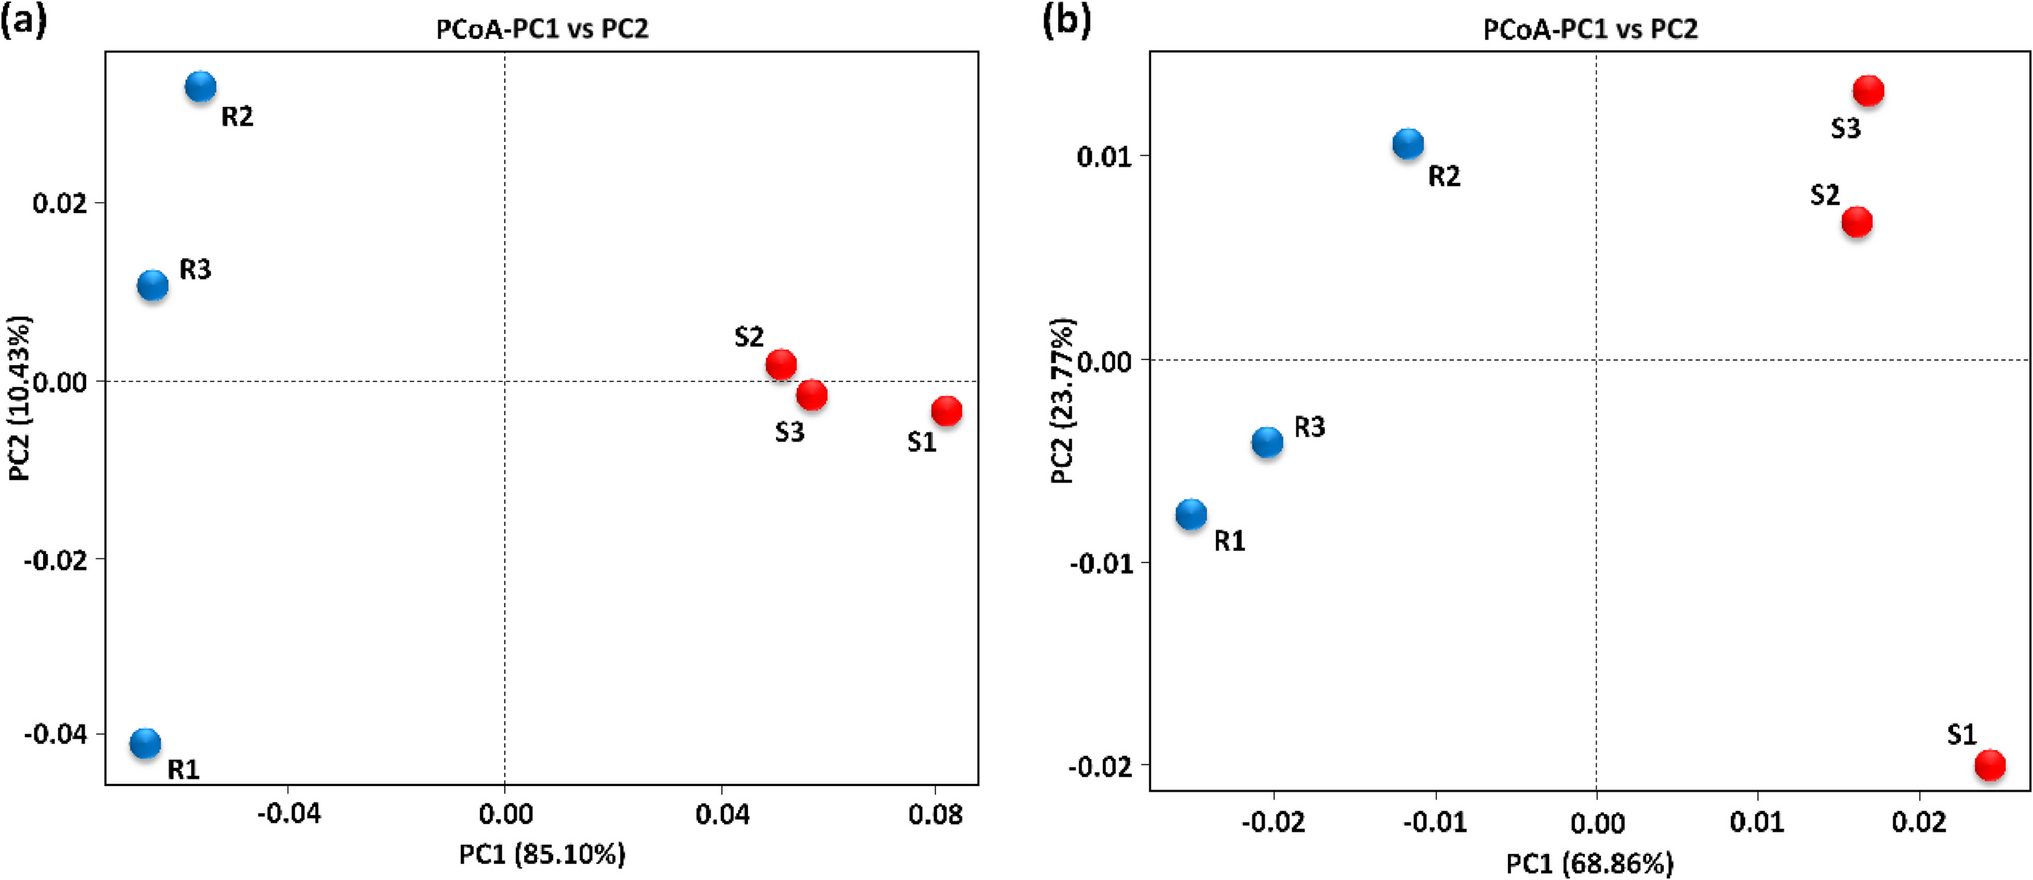
For the sepsis dataset, batch effects among GSE54514, GSE57065, and GSE95233 were corrected using the ComBat algorithm. Principal component analysis (PCA) revealed distinct separation between datasets prior to correction (Figure S2A), while post-correction samples clustered tightly together, indicating effective batch adjustment (Figure S2B). A soft threshold of β = 4 was then chosen, achieving a scale-free topology (R² = 0.85) with satisfactory mean connectivity (Figure S2C, D).
Hierarchical clustering identified several key modules associated with sepsis traits, including the “green” module (Cor = 0.11, p = 0.02), “royalblue” module (Cor = 0.12, p = 0.02), and “cyan” module (Cor = − 0.14, p = 0.004) (Fig. 3B), which were selected for further analysis based on their relevance.Differential expression analysis of the AP and sepsis datasets was performed using the limma package in R, identifying 4,459(Fig. 3C, FigS2E) and 667 DEGs (Fig. 3D, FigS1C), respectively.
Fig. 3
Identification of trait-related gene modules and differentially expressed genes in AP and sepsis. (A–B) Heatmaps showing module–trait relationships based on weighted gene co-expression network analysis (WGCNA) in acute pancreatitis (A) and sepsis (B). Each row represents a co-expression module labeled by color, and each column represents a clinical trait (Control or Treated). The values within each cell represent the Pearson correlation coefficient between the module eigengene and the trait, with the corresponding p-value shown in parentheses. Modules with strong positive or negative correlations are highlighted in red and blue, respectively, indicating potential trait relevance. (C–D) Volcano plots illustrating differentially expressed genes (DEGs) in AP (C) and sepsis (D) datasets. Each point represents a gene, with red and blue indicating significantly upregulated and downregulated genes, respectively, based on thresholds of|lgFC| ≥ 0.6 and adjusted p-value < 0.05. Grey dots represent non-significant genes
Functional characterization analysisWe performed a cross-analysis of module characteristic genes with DEGs, resulting in 37 common significantly expressed genes shared by sepsis and AP, as depicted in the Venn diagram (Fig. 4A). These differentially expressed genes were further subjected to Gene Ontology (GO) and Kyoto Encyclopedia of Genes and Genomes (KEGG) pathway enrichment analyses. The GO enrichment analysis revealed that biological processes (BP), cellular components (CC), and molecular functions (MF) were all associated with oxidative phosphorylation. Specifically, BP terms included aerobic electron transport chain, ATP synthesis coupled electron transport, respiratory electron transport chain, and oxidative phosphorylation; CC terms included respiratory chain complex and mitochondrial respirasome; and MF terms included oxidoreduction-driven active transmembrane transporter activity (Fig. 4B, C). The KEGG pathway analysis demonstrated that these significantly enriched DEGs were notably involved in the oxidative phosphorylation pathway (Fig. 4D).
Fig. 4
GO and KEGG Enrichment Analysis of Common Core Genes in Acute Pancreatitis and Sepsis. (A) Venn diagram of common differentially expressed genes between acute pancreatitis and sepsis identified through WGCNA network analysis and DEG overlap; (B, C) Circular and dot plots showing GO enrichment analysis of common genes; (D) KEGG pathway enrichment analysis of common genes. An adjusted p-value < 0.05 was considered statistically significant. The ordinate represents the enriched terms, and the abscissa represents the proportion of genes involved in each term. The size of the dots indicates the number of genes, while the color of the dots reflects the p-value
Construction and analysis of the protein-protein interaction (PPI) network for core genesUsing the STRING database, we generated a PPI network comprising 26 nodes and 134 edges, reflecting a dense and highly interconnected structure among proteins encoded by the selected core genes. The network was visualized with Cytoscape (Fig. 5A), where node color intensity indicates connectivity, with darker nodes representing higher centrality and potential biological significance.
To further interpret the biological functions of these genes, we carried out KEGG pathway enrichment analysis via the ClueGO and CluePedia plugins (Figure S3). The results highlighted significant enrichment in the OxPhos pathway, implicating these genes in mitochondrial metabolism, ROS production, and inflammatory responses. Moreover, their involvement in pathways regulating immune function and energy balance suggests a potential mechanistic link between AP and sepsis progression.
For pinpointing central genes within the interaction network, we utilized four complementary topological analysis methods—MCC, DMNC, MNC, and Degree—available through the CytoHubba plugin. Cross-method consensus revealed seven hub genes that were consistently top-ranked across all algorithms (Fig. 5B), reinforcing their importance as regulatory nodes within the co-expression network.
Fig. 5
PPI Network and Functional Enrichment Analysis of Common Genes in Acute Pancreatitis and Sepsis. (A) PPI network of common genes identified in acute pancreatitis and sepsis, visualized using the CytoHubba plugin in Cytoscape. Nodes represent genes, and the edges represent interactions between them. The color intensity of the nodes corresponds to the degree of centrality, with darker shades indicating higher degrees of connectivity. (B) Bar plot showing the gene expression levels of hub genes in the oxidative phosphorylation pathway. The horizontal axis shows the hub genes, and the vertical axis represents gene expression
To identify reliable diagnostic markers, we applied two machine learning algorithms—SVM-RFE and Random Forest (RF)—using 10-fold cross-validation to reduce overfitting. SVM-RFE selected the optimal gene set based on the lowest classification error (Fig. 6A, C), while RF, built with 500 trees, ranked genes by mean decrease in Gini impurity, retaining those with scores above 2 (Fig. 6B, D). The top 30 genes were visualized using a lollipop plot. By intersecting results from both methods across AP and sepsis cohorts, we identified six core hub genes—NDUFA1, COX7A2, COX7B, UQCRQ, SNRPG, and NDUFA4—consistently ranked as top features (Fig. 6E).
Fig. 6
Identification and Network Analysis of Common Key Genes in AP and Sepsis. (A, B) Importance plots of hub genes identified in AP using machine learning methods (SVM-RFE and RF); (C, D) Importance plots of hub genes identified in sepsis using machine learning methods (SVM-RFE and RF);(E) Venn diagram showing the overlap of key genes identified by RF and SVM-RFE in AP and sepsis. Six common hub genes (NDUFA1, COX7A2, COX7B, UQCRQ, SNRPG, and NDUFA4) were identified across both diseases; (F) GeneMANIA analysis of core related DEGs and their co-expressed genes in the network; (G) Box plot depicting the differential expression of the six shared hub genes between AP patients and control groups; (H) Box plot comparing the expression levels of the six common hub genes in sepsis patients and controls
To validate the biological relevance of these candidates, we performed GeneMANIA network analysis, which confirmed that five of the six genes (NDUFA1, COX7A2, COX7B, UQCRQ, and NDUFA4) were tightly linked to the OxPhos pathway (Fig. 7F). Additionally, differential expression analysis via t-tests showed that all six hub genes were significantly upregulated in both AP and sepsis samples relative to controls, supporting their potential utility as diagnostic biomarkers (Fig. 6G, H).
Fig. 7
ROC Curves for Key Hub Genes in Training and Validation Sets for AP and Sepsis. (A) ROC curves for individual hub genes (NDUFA1, UQCRQ, COX7A2, NDUFA4, SNRPG, COX7B) in the training set of AP patients, with their corresponding AUC values. The overall model achieved an AUC of 0.969, with a 95% confidence interval (CI) of 0.933–0.995; (B) ROC curves for individual hub genes in sepsis patients, with corresponding AUC values. The overall model performance is shown on the right, achieving an AUC of 0.869, with a 95% CI of 0.826–0.908; (C) ROC curves for hub genes in the GSE3644 dataset, showing high predictive accuracy with AUC values ranging from 0.889 to 1.000. The model‘s performance achieved an AUC of 1.000 (95% CI: 1.000–1.000); (D) ROC curves for hub genes in the GSE28750 dataset, showing varying levels of predictive accuracy, with AUC values ranging from 0.698 to 0.975. The model’s performance achieved an AUC of 1.000 (95% CI: 1.000–1.000)
Diagnostic value and validation of core biomarkersWe conducted a thorough evaluation of the diagnostic potential of these six core hub genes in samples from sepsis and AP. Initially, receiver operating characteristic (ROC) analysis was performed on the training set. The analysis of AP samples indicated a strong correlation among the six genes, with a combined ROC curve AUC value of 0.969 (95% CI: 0.933–0.995). Individually, the AUC values for each gene were all above 0.75: NDUFA1: 0.960, COX7A2: 0.863, COX7B: 0.824, UQCRQ: 0.814, SNRPG: 0.965, and NDUFA4: 0.782 (Fig. 7A). In sepsis samples, all six genes had an AUC value greater than 0.70: NDUFA1: 0.806, COX7A2: 0.772, COX7B: 0.730, UQCRQ: 0.813, SNRPG: 0.749, and NDUFA4: 0.789. The combined ROC analysis of the six genes yielded an AUC value of 0.869 (95% CI: 0.826–0.908) (Fig. 7B).
To validate the effectiveness and reliability of our model, we selected GSE3644 and GSE28750 datasets as validation sets. Given the high genetic, signaling pathway, immune response, and inflammatory regulation similarities between mice and humans, mouse models serve as valuable tools for studying human diseases. In particular, they effectively simulate key pathological processes such as immune cell activation, cytokine regulation, and metabolic stress. Additionally, due to the limited availability of comprehensive human AP datasets, we utilized mouse models for validation in this study.Analysis of the AP dataset revealed that five key genes demonstrated strong diagnostic performance, with ROC curve AUC values all exceeding 0.8, as follows: NDUFA1: 1.000, COX7A2: 0.944, UQCRQ: 0.944, SNRPG: 0.972, NDUFA4: 0.889. Furthermore, when combining all six genes for joint ROC analysis, the AUC reached 1.000, with all genes displaying statistically significant differential expression (p < 0.05) (Fig. 7C). Similarly, sepsis dataset analysis indicated a strong association among these six genes, with a combined ROC AUC of 1.000. Individually, these genes also exhibited high AUC values: NDUFA1: 0.897, COX7A2: 0.698, COX7B: 0.935, UQCRQ: 0.765, SNRPG: 0.840, NDUFA4: 0.975 (Fig. 7D). These genes also showed significant differential expression in the validation sets.
In conclusion, our findings demonstrate that these genes possess high diagnostic value for both AP and sepsis, highlighting their potential as reliable biomarkers for early disease detection.
Analysis of transcriptional regulation and prediction of potential drugsWe constructed a lncRNA-miRNA-mRNA regulatory network for the six hub genes (Fig. 8), revealing the complex regulatory relationships among lncRNAs, miRNAs, and mRNAs. The network comprises two sub-networks centered around SNRPG and NDUFA4. SNRPG is mainly regulated by multiple lncRNAs, such as LINC00265 and SSTR5-AS1, through hsa-miR-93-3p and hsa-miR-185-5p. These lncRNAs may bind to miRNAs via the competing endogenous RNA (ceRNA) mechanism, thereby reducing the direct inhibition of SNRPG by miRNAs. Similarly, NDUFA4 is indirectly regulated by multiple lncRNAs (e.g., TP73-AS1 and CDR1-AS) through hsa-miR-7-5p and hsa-miR-877-5p. This figure illustrates the intricate interactions between lncRNAs, miRNAs, and mRNAs, suggesting that multiple lncRNAs may modulate the expression levels of key genes SNRPG and NDUFA4 by competing with miRNAs. This regulatory network is crucial for understanding disease mechanisms and identifying molecular targets.
Fig. 8
mRNA-miRNA-lncRNA Co-expression Network for Hub Genes SNRPG and NDUFA4 in Acute Pancreatitis and Sepsis. Red oval nodes represent mRNA, green triangular nodes indicate miRNA, and blue diamond-shaped nodes represent lncRNA
We downloaded drug data closely related to the six hub genes from the CMap. The results indicated that selenium, metformin hydrochloride, hydralazine, retinoic acid, pingyangmycin, and terpineol could alleviate or even reverse the disease state (Fig. 9A). The molecular structures of some of the predicted drugs are presented in Fig. 9B.
Fig. 9
Correlation Analysis of Various Compounds with Hub Genes and Chemical Structures. (A) displays the statistical correlation data for several compounds (selenium, metformin hydrochloride, hydralazine, vitinoin, pingyangmycin, and pinosylvin), including significance (P-value), odds ratio, combined score, and associated genes. (B-F) show the chemical structures of each compound
Immune infiltration analysis of shared diagnostic genesOur analysis evaluated the immune cell composition in AP and sepsis patients, revealing significant differences in immune cell profiles between patient and control groups (Fig. 10A, B). In both AP and sepsis patients, compared to healthy controls, significant differences were observed in T cells CD4 memory resting, T cells CD4 memory activated, NK cells resting, neutrophils, and mast cells resting (Fig. 10C, D). Specifically, T cells CD4 memory activated and mast cells resting were significantly increased in AP and sepsis patients, whereas T cells CD4 memory resting were decreased. Additionally, NK cells resting and neutrophils showed significant changes in the patient groups, reflecting distinct effects of these diseases on innate and adaptive immunity. Regarding B cell subsets, B cells naive were abnormally expressed in AP patients, while B cells memory showed notable changes in sepsis patients, suggesting differences in B cell differentiation and function regulation under these disease states. These findings highlight specific immune system alterations in AP and sepsis, providing critical insights into immune dysregulation mechanisms in these pathological states.
Fig. 10
Immune Cell Infiltration Analysis for AP and Sepsis Datasets. (A, B) Correlation heatmaps of immune cell infiltration in AP and sepsis, showing the relationships between various immune cell types. Positive correlations are represented in red, while negative correlations are shown in blue, with the color intensity indicating the strength of the correlation. (C, D) Violin plots illustrating the proportions of various immune cell types in the control (blue) and disease (red) groups in the AP and sepsis datasets, respectively. Significant differences in cell type abundance are observed between the groups. The p-values indicate the statistical significance of these differences between groups
Additionally, we examined the correlation between core immune-related DEGs and immune cell components in patients with sepsis and AP (Fig. 11A). The results indicated that in AP patients, COX7A2 and NDUFA4 exhibited negative correlations with resting CD4 memory T cells, whereas COX7B and NDUFA1 showed positive correlations with activated CD4 memory T cells. Furthermore, COX7B and SNRPG were negatively correlated with resting NK cells. COX7A2 and NDUFA4 also displayed negative correlations with neutrophils, while UQCRQ was positively correlated with resting mast cells. In sepsis patients(Fig. 11B), COX7A2 and COX7B were negatively correlated with resting CD4 memory T cells, while NDUFA4 and SNRPG exhibited positive correlations with activated CD4 memory T cells. Additionally, COX7B was negatively correlated with resting NK cells, and neutrophils showed positive correlations with COX7A2 and NDUFA1. Resting mast cells were negatively correlated with UQCRQ. These findings highlight specific associations between certain DEGs and immune cell components across different pathological states, suggesting a crucial role for these genes in immune regulation in both AP and sepsis. This discovery offers new insights into the mechanisms of immune dysregulation in these conditions and establishes a foundation for future therapeutic strategies.
Fig. 11
Correlation Analysis of Hub Genes with Immune Cell Infiltration in AP and Sepsis. (A) Correlation analysis of six hub genes (COX7A2, COX7B, NDUFA1, NDUFA4, SNRPG, UQCRQ) with various immune cell types in acute pancreatitis (AP). The correlation coefficients are represented along with the p-values, indicating the strength and significance of the correlation between gene expression and immune cell infiltration. The size of the circles represents the absolute correlation (abs(cor)), and the color scale represents the p-value, with darker colors showing more significant correlations; (B) Correlation analysis of the same six hub genes with immune cell infiltration in sepsis
Predictive value of core genesIn order to explore the potential of these hub genes as diagnostic markers for acute pancreatitis (AP), we measured the protein and transcript levels of UQCRQ, COX7A2, SNRPG, and NDUFA4 in serum specimens collected from AP patients (n = 3) and healthy individuals (n = 3). All four genes exhibited a clear upregulation trend in the AP group. Western blot analysis revealed markedly elevated protein levels of these genes in AP patients relative to controls (Fig. 12A). Consistently, qRT-PCR results confirmed a significant increase in their mRNA expression levels (Fig. 12B–E). These differences were statistically significant across three independent biological replicates (P < 0.05 to P < 0.0001).These findings suggest that mitochondrial dysfunction may contribute to the pathophysiological progression of acute pancreatitis, with UQCRQ, COX7A2, SNRPG, and NDUFA4 potentially acting as central regulators in this process. Notably, the consistent overexpression of these hub genes highlights their promise as candidate diagnostic biomarkers for identifying and monitoring severe cases of acute pancreatitis.
Fig. 12
Expression analysis of UQCRQ, COX7A2, SNRPG, and NDUFA4 in control and AP groups. (A) Representative Western blot images showing the protein expression levels of UQCRQ, COX7A2, SNRPG, and NDUFA4 in control samples (CON-1, CON-2, CON-3) and acute pancreatitis samples (AP-1, AP-2, AP-3). ALBUMIN was used as a loading control.(B–E) Quantitative qRT-PCR results showing mRNA expression levels of UQCRQ (B), COX7A2 (C), SNRPG (D), and NDUFA4 (E) in three biological replicates from the control group (blue) and AP group (red). Data are presented as fold change relative to the control group. Statistical analysis was performed using unpaired t-tests (*P < 0.05, **P < 0.01, ***P < 0.001, ***P < 0.0001)
Comments (0)