
Remember me

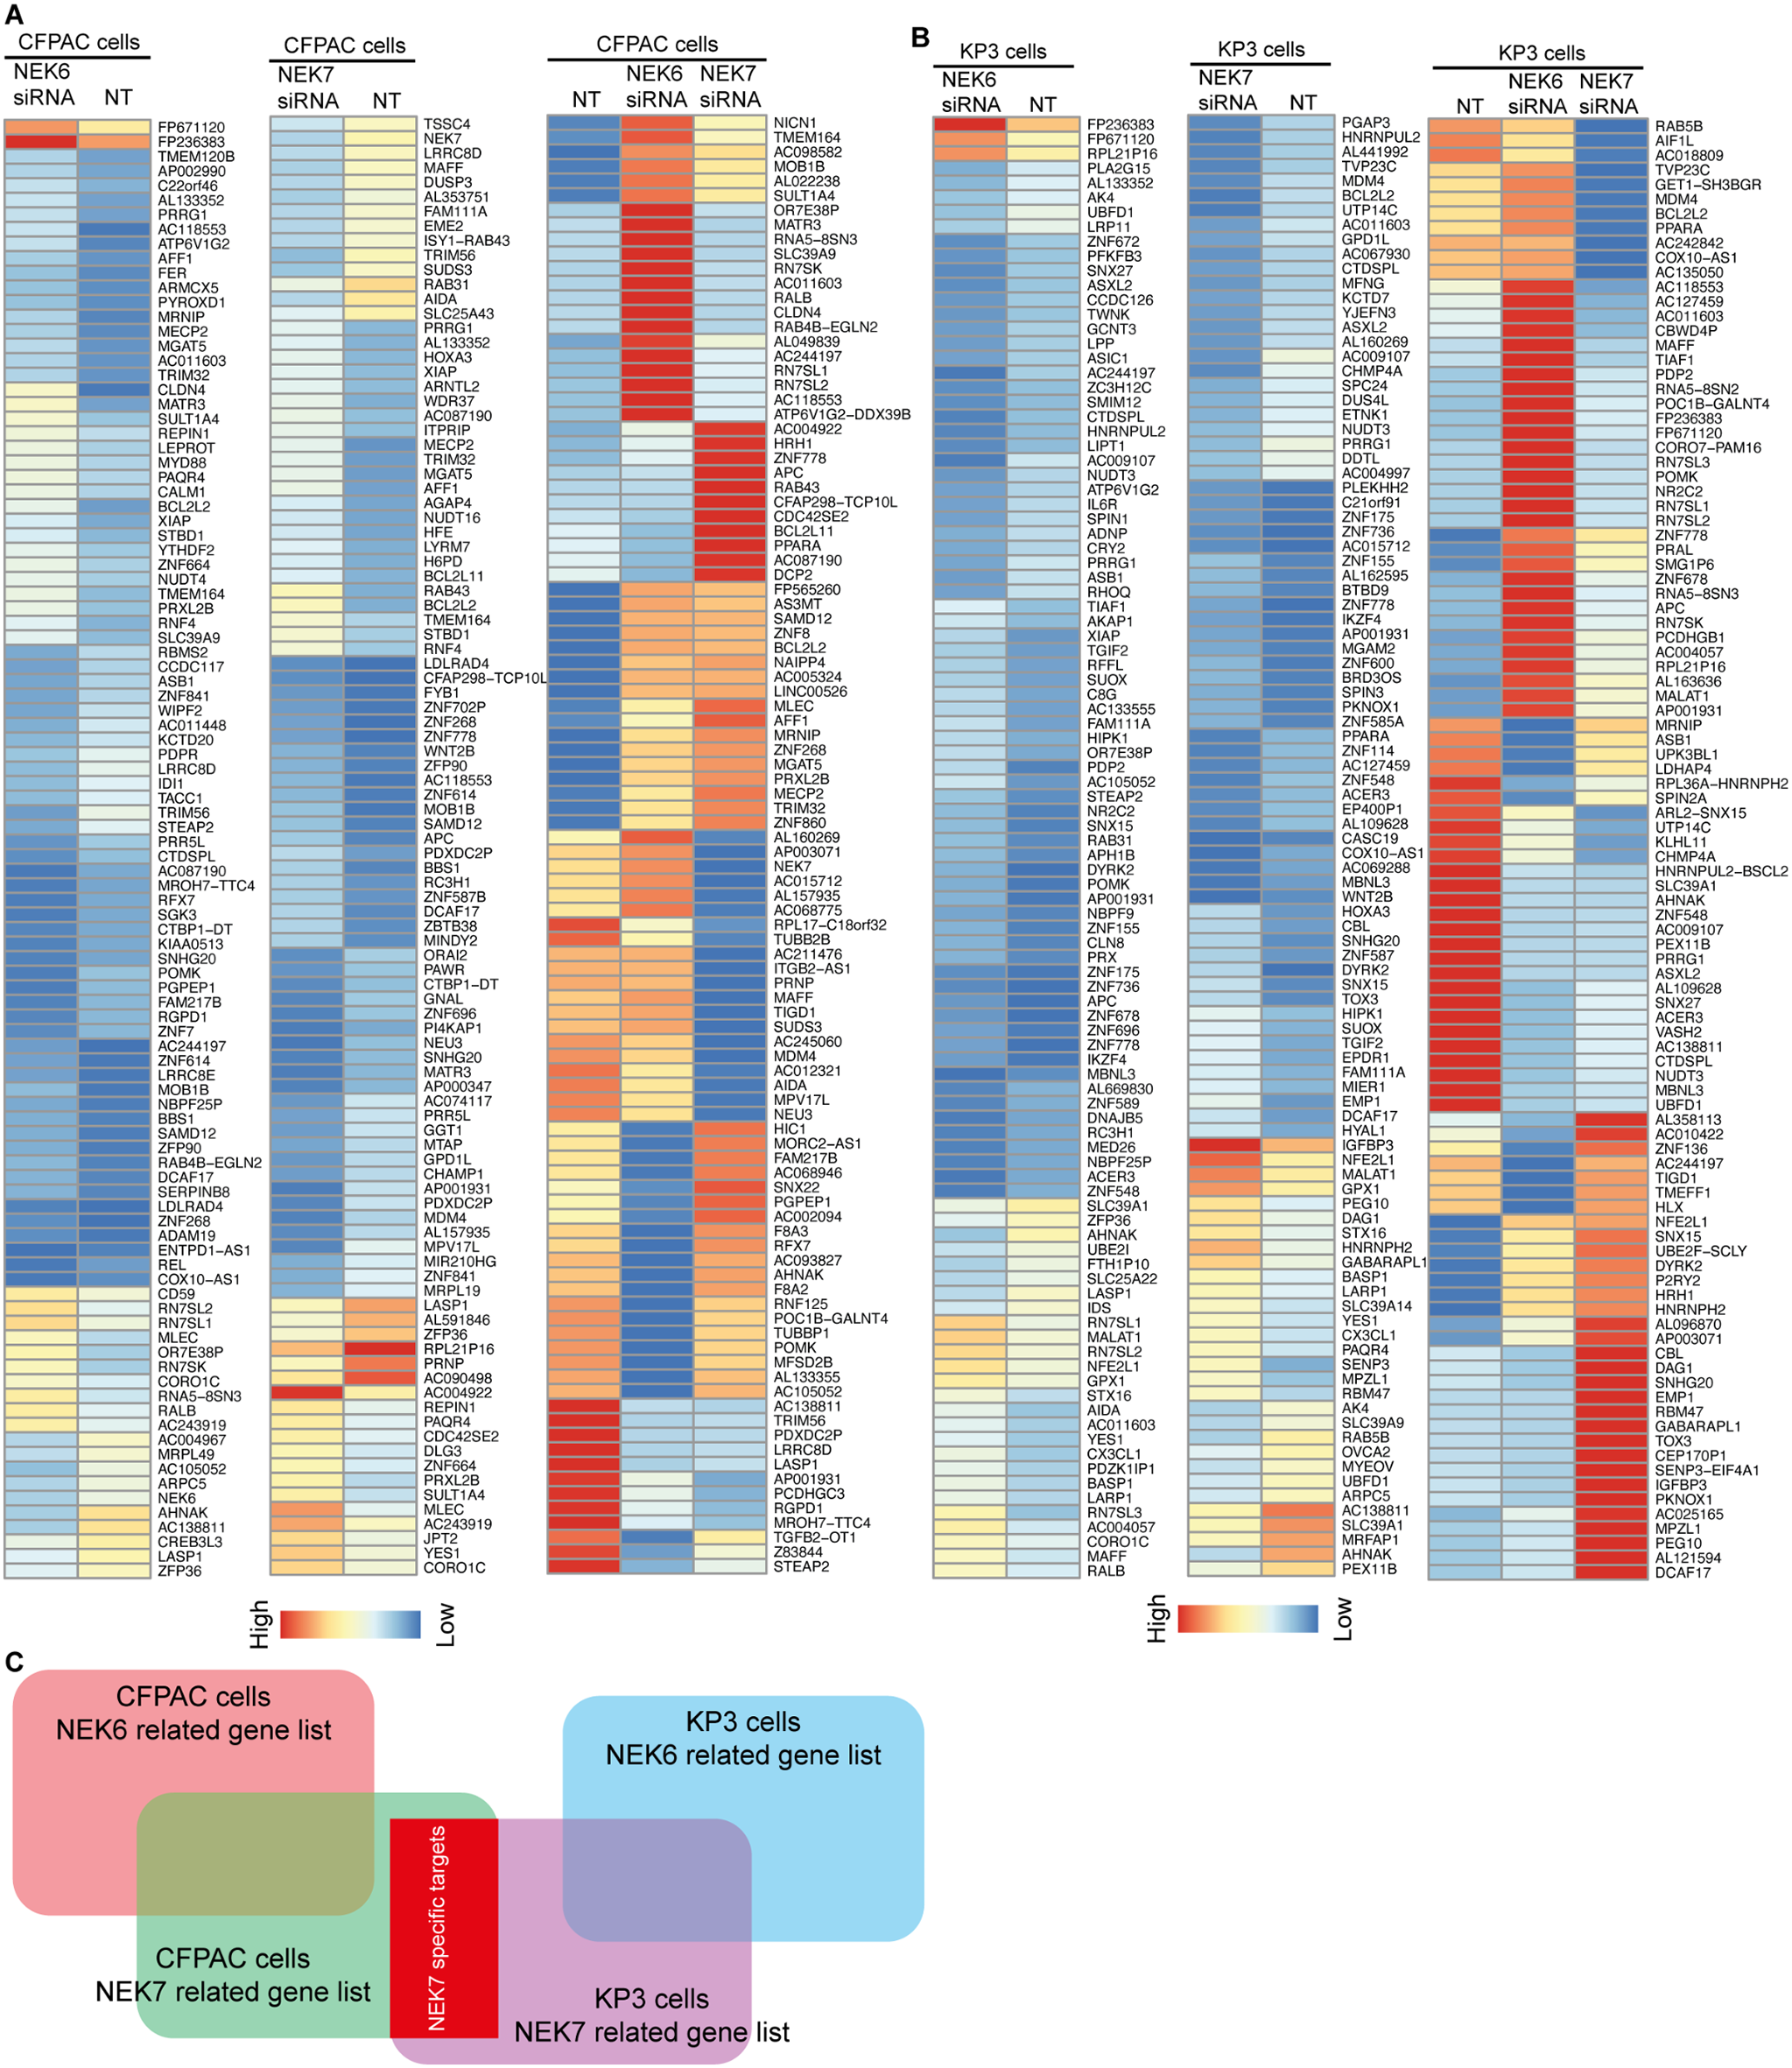
In order to probe the biological function of NEK7 on pyroptosis in PDAC. We performed RNA downregulation of NEK6 and NEK7 using short interfering RNA (siRNA) in PDAC cell lines respectively (Figure S1). Then, high-throughput transcriptome sequencing (RNA-seq) has been employed to examine the gene-expression pattern after manipulation of NEK6 and NEK7 expression. We then identified the differentially expressed genes between control and knockdown groups in CFPAC and KP-3 cells (Fig. 1A and B, |logFC| = 1, p < 0.05). The Venn diagram (Fig. 1C) was used to visualize gene list of NEK7-specific targets comparing NEK6.
Fig. 1
Screening of differentially expressed genes after NEK6 and NEK7 downregulation in PDAC cell lines. (A) Heatmap of differential expression genes between control and NEK6 / NEK7 downregulation groups in CFPAC cell line. (B) Heatmap of differential expression genes between control and NEK7 / NEK7 downregulation groups in KP-3 cell line. (C) Venn diagram NEK7 specific targets screening
The biological functions of these genes were further confirmed through the use of PanCancer GSEA analysis using datasets obtained from TCGA database. As shown in Fig. 2A, the biological role of the genes in pyroptosis had been further screened using GSEA in PanCancer (p < 0.05) and we identified a pyroptosis candidate gene set composing 10 genes. In order to verify and further screen candidate genes that are involved in NEK7-mediated pyroptosis in PDAC, the Spearman’s correlation between NEK7 and candidate genes was assessed. We examined the correlation between the screened candidate genes and NEK7 at RNA expression level and identified a pyroptosis gene set that highly correlated with NEK7 (Fig. 2B, cor > 0.2). Combing the results above, we have obtained a NEK7-Specific Pyroptosis Gene Set (NEK7-SPGS) composed of 7 genes (CARF, EEF1A1P16, GOLM2, MEMO1P1, SCAMP1, TNFSF13, and ZSCAN31). The expressions of these genes in PDAC tissues were validated by Human Protein Atlas databse (https://www.proteinatlas.org) or past research findings (Figure S2) (Uhlén et al. 2015; Mao et al. 2021). To validate the importance of these genes in clinical features, we assessed the clinical significance of NEK7-SPGS. As shown in Fig. 2C, comparison of NEK7-SPGS between normal and tumor tissues using datasets from GTEx and TCGA databases was performed. Statistically significant upregulations of CARF, EEF1A1P16, GOLM2, MEMO1P1, SCAMP1, and TNFSF13 were observed in pancreatic tumors compared to that in normal tissues. Meanwhile, ROC analysis for NEK7-SPGS was carried out for classifying pancreatic tumor tissues versus normal tissues using GTEx and TCGA databases. As shown in Fig. 2D, ROC curves reflected that the expression level of NEK7 (AUC = 0.949), EEF1A1P16 (AUC = 0.951), GOLM2 (AUC = 0.972), MEMO1P1 (AUC = 0.922), SCAMP1 (AUC = 0.968), and TNFSF13 (AUC = 0.936) accurately discriminated between the pancreatic tumor and normal tissues with AUC > 0.8. In summary, analyses above identified a NEK7-specific gene set associated with pyroptosis, which has clinical implications. Meanwhile, the relationship between NEK7-SPGS and clinical features were examined using TCGA database (Figure S3).
Fig. 2
NEK7-specific pyroptosis gene set screening. (A) PanCancer GSEA analysis of NEK7-specific targeted genes. (B) The spearman’s correlations between NEK7 and NEK7-SPGS. (C) Comparison of NEK7-SPGS expression in normal and pancreatic tumor tissues (datasets were obtained from TCGA and GTEx databases) (D) AUC analysis of NEK7-SPGS between normal and pancreatic tumor tissues
NEK7-SPGS is highly associated with T helper cell infiltration of tumor microenvironment in PDACTo further explore the role of NEK7-SPGS in PDAC, we characterized the biological functions of NEK7, CARF, EEF1A1P16, GOLM2, MEMO1P1, SCAMP1, TNFSF13 and ZSCAN31 using RNA expression dataset obtained from TCGA database. For each gene, the pancreatic tumor samples from database were classified into high- or low-expressing groups according to whether or not the RNA expression of the candidate gene was higher than the median expression level of the candidate gene. Then, the differentially expressed genes were screened using DESeq2 package, with genes differentially expressed in their high- or low-expressing groups. Specifically, we set a p < 0.05 and |logFC| > 1 as thresholds for differentially expressed genes (Love et al. 2014). Gene ontology analysis for biological functions of differentially expressed genes was enriched by Metascape database (Zhou et al. 2019). Then, the results were arranged to reveal the biological roles of NEK7, CARF, EEF1A1P16, GOLM2, MEMO1P1, SCAMP1, TNFSF13, and ZSCAN31 in PDAC. As shown in Fig. 3A, the functional annotations of the genes were highly correlated with Pancreatic secretion and NABA-related pathways, implicating that the biological roles of NEK7 and NEK7-SPGS might be involved in TME remodeling of PDAC. In order to further investigate the mechanisms by which NEK7 and NEK7-SPGS affect TME in PDAC, we profiled the infiltration levels of immune cell types in tumor tissues obtained from TCGA PDAC cohort using ssGSEA analysis. Then, the correlations between NEK7-SPGS and immune infiltration levels were calculated. As shown in Fig. 3B, the NEK7-SPGS showed a positive correlation with T helper cells, suggesting a tight relationship between NEK7-SPGS and infiltration of T helper cells in PDAC. To further validate the relationship between NEK7-SPGS and T helper cells, the pancreatic tumor samples were stratified based on the median expression of the NEK7-SPGS into the high or low group. We then compared the immune infiltration level of T helper cells in two groups: tumors with high versus low NEK7-SPGS levels in PDAC. We observed that NEK7, CARF, EEF1A1P16, GOLM2, MEMO1P1, and SCAMP1 high expressions were significantly accompanied by higher levels of T helper cell immune infiltration level (Fig. 3C). The above findings discovered a significant correlation between the NEK7-SPGS and immune infiltration of T helper cells in PDAC.
Fig. 3
Prediction of NEK7-SPGS biological functions. (A) Gene ontology analysis of NEK7-SPGS by Metascape online tool. (B) Spearman’s correlations analysis between NEK7-SPGS and immune infiltration levels was determined by ssGSEA analysis. (C) Comparison of T helper cell infiltration between low- and high-expression group of NEK7-SPGS. Wilcox test was performed
NEK7-SPGS is associated with tumor microenvironment via T cells induced inflammatory responseIn order to further understand the biological functions of NEK7-SPGS in PDAC, we clustered pancreatic tumor samples according to expression level of NEK7-SPGS and the samples were classified into two clusters (cluster 1 and cluster 2) using ConsensusClusterPlus R package. Heatmap showed the differentially expressed genes between the two clusters (Fig. 4A). Survival curves were generated by Kaplan-Meier survival analysis. Although the difference in survival did not attain statistical significance, we observed an obvious difference between cluster 1 and cluster 2 two years later (Fig. 4B). The differentially expressed genes between cluster 1 and cluster 2 were subjected to gene ontology enrichment analysis using Metascape database. The results suggested that NEK7-SPGS was involved in regulation of TME (NABA MATRISOME ASSOCIATED and NABA CORE MATRISOME) and inflammatory response in PDAC (Fig. 4C). To further confirm the correlation between NEK7-SPGS and TME, as well as inflammatory response, we performed weighted gene co-expression network analysis (WGCNA) to identify the modules associated with differentially expressed genes according to clustering (Fig. 4D). The biological functions of modules were determined by gene ontology analysis. Consistent with the result in Fig. 4C, we found dramatic enrichments in TME (NABA MATRISOME ASSOCIATED) and inflammatory in grey module (Fig. 4D). Pyroptosis of cancer cells regulates the TME by releasing damage-associated molecular patterns (DAMPs) and proinflammatory cytokines. Then, DAMPs in TME induced activation of the NLRP3 inflammasome pathway, resulting in its downstream IL-1β secretion, CD4 + T cell effector functions (Ershaid et al. 2019); Jain et al. 2018). On the basis of the above results and previous studies, we propose that the NEK7-SPGS shows a high correlation with the PDAC TME and inflammatory, and we speculate that there is a relationship between NEK7-SPGS-induce T helper cell immune infiltration and NEK7-SPGS induced-inflammatory. To validate the correlation between NEK7-SPGS-induce PDAC TME variation and NEK7-SPGS-induced-inflammatory, we examined the correlation between T helper cell immune infiltration level and NLRP3 inflammasome-dependent inflammatory response. The Spearman’s correlation analysis showed that T helper cell immune infiltration level highly correlates with NLRP3 RNA expression level in PDAC (Fig. 5A). We also observed a strong rise in T helper cell immune infiltration level in NLRP3 high expression PDAC tissues (Fig. 5B). Furthermore, we examined correlation between NLRP3 and NEK7-SPGS, and we found significant correlations between NEK7, CARF, EEF1A1P16, GOLM2, MEMO1P1, SCAMP1, TNFSF13 and NLRP3 (Fig. 5C). Thus, we proposed that NEK7-SPGS may regulate T helper cells in TME through inflammasome/pyroptosis pathway (Fig. 5D).
Fig. 4
Identification of consensus clusters based on expression of NEK7-SPGS. (A) Heatmap of differentially expressed genes between cluster1 and cluster 2 were identified based on expression of NEK7-SPGS. (B) Kaplan-Meier survival curve between cluster 1 and cluster 2 of patients. (C) Gene ontology analysis differentially expressed genes. (D) The WGCNA analysis using differentially expressed genes and the Gene ontology analysis of grey module
Fig. 5
The relationship between NEK7-SPGS and inflammatory response. (A) Spearman’s correlation analysis between T helper cell infiltration level and NLRP3 expression level. (B) Comparison of T helper cell infiltration between low- and high-expression group of NLRP3. Wilcox test was performed. (C) Spearman’s correlation analysis. (D) Schematic diagram of NEK7-SPGS involved in tumor microenvironment remodeling
Establishment and validation of the NEK7-SPGS-related prognostic signatureThe pancreatic tumor samples from TCGA dataset were divided into training cohort and testing cohort using a 1:1 subgroup sampling ratio. The training cohort was used for signature construction, and the testing cohort was used for validation of the consequent signature in training cohort. The differentially expressed genes between the two clusters that corresponded to NEK7-SPGS expression were subjected to prognostic signature establishment. LASSO regression was carried out to screen the optimal genes. A prognostic significance was constructed and evaluated using univariate Cox regression and LASSO regression analyses (Fig. 6A and Figure S4). The pancreatic tumor samples in training and testing groups were split into high-risk group and low-risk group according to the risk scores based on the median. We then performed Kaplan-Meier survival analyses to evaluate the survival of the patients between the low- and high-risk groups. Log-rank test was used to determine statistical significance. As shown in Fig. 6B i, there is a significant difference in survival between the low- and high-risk groups (longrank test, p < 0.05). The higher risk accompanied by a worse survival condition compared with those in the lower risk group using dataset from entire TCGA cohort (Fig. 6B i). Meanwhile, we obtained consistent outcomes in TCGA training cohort and testing cohort (Fig. 6B ii and iii). Progression-free survival result was remarkably similar to overall survival result (Fig. 6C). In addition, based on ROC analysis, the corresponding areas under the curves (AUC) were all greater than 0.7 in predicting 1-, 3-, and 5-year survival of patients. Therefore, the time-dependent ROC curves demonstrated that the prognostic signature was convincible (Fig. 6D). Further stratification of survival analysis showed that the risk scores increased with PDAC severity at histological grade 1 and 2 (Fig. 6E). These results are sufficient to show the accuracy and stability of the NEK7-SPGS-related prognostic signature in PDAC.
Fig. 6
Establishment of NEK7-SPGS-related prognostic signature (A) Identification of differential expression genes (between cluster 1 and cluster 2) related to the PDAC risks by univariate cox regression analysis. (B) Kaplan-Meier curves showed that high-risk group was accompanied by worse survival than low-risk group. (i) Overall survival of TCGA total cohort. (ii) Overall survival of TCGA training cohort. (iii) Overall survival of TCGA testing cohort. (C) Progression-free survival of TCGA total cohort. (D) The ROC curve analysis of the NEK7-SPGS signature for predicting patient survival. (E) Kaplan-Meier curves between low-risk group and high-risk group based on whole-TCGA cohort (i) grade 1 and grade 2, (ii) grade 3 and grade 4
Chemotherapeutic sensitivity of NEK7-SPGS-related prognostic signature in PDACWe next explored the practicability of the NEK7-SPGS-related prognostic signature in guiding clinical therapies. To predict chemotherapeutic sensitivity of NEK7-SPGS-related prognostic signature between high- and low-risk groups, we estimated the half-maximal inhibitory concentration (IC50) of chemotherapeutic drugs in patients with PDAC using pRRophetic algorithm (Geeleher et al. 2014). The results revealed a series of chemotherapy agents showed significant alterations of IC50 between low- and high-risk groups (Fig. 7A). It can be proposed that the chemotherapeutic sensitivity of these 37 drugs between the high- and low-risk groups of PDAC patients yielded significant changes. It is noteworthy that the IC50 of gemcitabine and paclitaxel showed dramatic alterations between low- and high-risk groups. As shown in Fig. 7A, patients in high-risk group revealed a lower chemotherapeutic sensitivity to gemcitabine and paclitaxel, which are the first-line drugs for treating advanced PDAC (O’Reilly and Abou-Alfa 2007); Xiong et al. 2006). The mechanism of gemcitabine or paclitaxel resistance in patients with PDAC results in an unsatisfactory therapeutic effect during the treatment of PDAC. Chemo-resistance as a major hurdle in PDAC treatment has gained increased attention in recent years. Here, we revealed the sensitivity of low- and high-risk patients to gemcitabine and paclitaxel, which might offer a visual field for researchers to develop drugs with high efficacy in PDAC therapeutic treatment.
Fig. 7
(A) Sensitivity analysis of chemotherapeutic drugs in patients at low- and high-risk groups
SCAMP1 inhibits the progression of PDACTo explore the effect of NEK7-SPGS in the tumor progression, we examined the biological function of SCAMP1, which is a member of NEK7-SPGS. We downregulated the expression of SCAMP1 in CFPAC-1 and KP-3 cells. We then examined the effect of SCAMP1 downregulation on cell migration and invasion. We observed that SCAMP1 downregulation markedly inhibited the migratory and invasive capabilities (Fig. 8A and Figure S5A, p < 0.05). Next, we established an orthotopic xenograft model by implantation of CFPAC-1 cells in nude mice. PDAC progression was evaluated by bioluminescence imaging. SCAMP1 downregulation suppressed the PDAC progression in vivo (Fig. 8B). Based on the above results, we proposed that SCAMP1 downregulation may contribute to the progression of PDAC which implying the role of NEK7-SPGS in tumor progression of PDAC. Moreover, we performed an RNA-sequencing analysis of PDAC cells after knockdown of SCAMP1. Proving that knockdown of SCAMP1 in PDAC cells significantly increased drug sensitivity to gemcitabine (Fig. 8C).
Fig. 8
Knockdown of SCAMP1 reduces migration, invasion, and tumor formation of PDAC cells. (A) CFPAC-1 cells were transfected with the SCAMP1 siRNAs for 48 h, migration and invasion assays were performed. Graphs show the quantification of cells calculated from five fields. Original magnification:100×. Scale bars = 100 μm. (B) Tumor formation was monitored and quantified weekly using bioluminescence imaging after SCAMP1 downregulation. (C) RNA-seq of PDAC cells was performed after knockdown of SCAMP1. Sensitivity analysis of gemcitabine was examined according to the RNA-sequencing dataset
Comments (0)