Cell lines
Human LUAD cell lines (PC-9, HCC827, and H1975), a human lung cancer cell line (H1299), HEK293T cells, and mouse Lewis lung carcinoma (LLC) cells were purchased from the Cell Bank of the Chinese Academy of Sciences (Shanghai, China). Cells were cultured in RPMI‑1640 or DMEM with 10% fetal bovine serum (FBS) at 37 °C in a humidified 5% CO2 atmosphere. All cells were authenticated by short tandem repeat (STR) profiling and tested without mycoplasma contamination.
Infection and transfection
For stable infection, recombinant lentiviruses (Hanbio, Shanghai, China) for gene interference were introduced into cells (PC-9, HCC827) and organoid, followed by puromycin selection for stable models. For transient transfection, siRNAs (RiboBio, Guangzhou, China) and plasmids (Hanbio; Sangon Biotech, Shanghai, China) were introduced into cells (PC-9, HCC827, H1975, H1299 and HEK293T) using Lipofectamine 2000 (Invitrogen, CA, USA) according to the manufacturer’s instructions. The utilized nucleic sequences are listed in Table S1.
ScRNA-seq and RNA-seq (tissue bulk and cell lines)
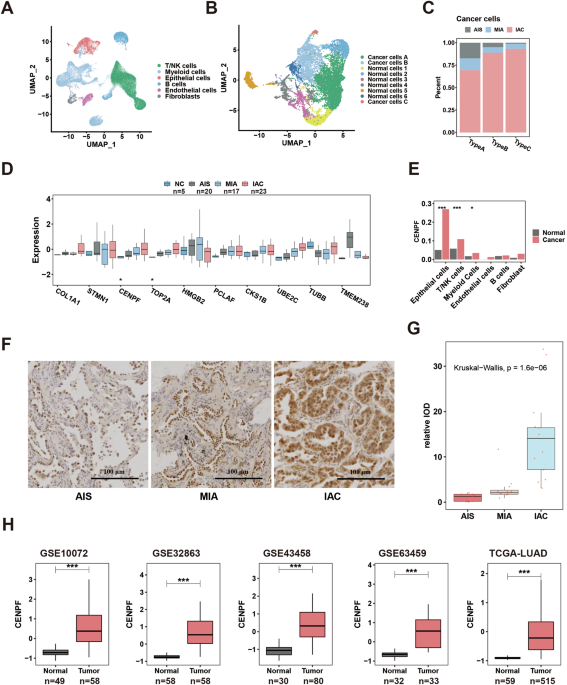
Nine clinical specimens (AIS: n = 3; MIA: n = 3; IAC: n = 3) (female: n = 6; male: n = 3; ranging from 37 to 69 years old) used for scRNA-seq (under accession GSE189357, deposited at GEO: https://www.ncbi.nlm.nih.gov/geo/) were collected from Tangdu Hospital, the Fourth Military Medical University (Xi’an, China), in accordance with ethics authority approval and all participants provided informed consent. Detailed methods for scRNA-seq are similar to those used in previous studies [23]. In brief, after modified tumor sampling, a single-cell suspension was generated through enzymatic dissociation, filtration, centrifugation, and red split fusion, and then, droplet-based scRNA-seq was performed on a NovaSeq 6000 (Illumina, CA, USA) platform after a final cDNA library was established (Genergy Inc., Shanghai, China). Cell Ranger (10x Genomics, CA, USA) was used to generate gene expression matrices based on the Ensembl GRCh38 human transcriptome. The quality control, integration and subsequent analysis of scRNA-seq data are described below (“Bioinformatics and statistical analysis”).
Sixty-five clinical specimens (NC: n = 5, AIS: n = 20, MIA: n = 17, IAC: n = 23) (female: n = 44; male: n = 21; ranging from 48 to 74 years old) used for bulk RNA-seq (under accession HRA005169; deposited at CNCB-NGDC: https://ngdc.cncb.ac.cn/) were collected from Tangdu Hospital, the Fourth Military Medical University (Xi’an, China), in accordance with ethics authority approval and all participants provided informed consent. Total RNA extracted from LUAD samples or cell lines (Knockdown model of CENPF in PC-9 cell lines by sh-NC/CENPF lentivirus; sh-NC: n = 3; sh-CENPF-1: n = 3; sh-CENPF-2: n = 3) (under accession HRA005374; deposited at CNCB-NGDC: https://ngdc.cncb.ac.cn/) was prepared to establish a cDNA library, which was sequenced on the Illumina NovaSeq™ 6000 platform (LC Bio Technology Co., Ltd., Hangzhou, China). The inclusion criteria were carefully defined as the following: (1) histological diagnosis of LUAD; (2) maximum diameter of the tumor ≤ 3.0 cm; (3) no lymphatic metastasis or distant metastasis; (4) no prior history of any other malignant tumors; and (5) radical lobectomy/segmentectomy.
Tissue microarray (TMA), immunohistochemistry (IHC), and evaluation
A total of 262 LUAD specimens (131 paired cancerous tissues and normal tissues) (female: n = 46; male: n = 85; ranging from 33 to 82 years old) for TMA construction as well as early-stage LUAD specimens (AIS: n = 9; MIA: n = 12; IAC: n = 16) (female: n = 20; male: n = 17; ranging from 38 to 78 years old) were collected from Tangdu Hospital, the Fourth Military Medical University (Xi’an, China), in accordance with ethics authority approval and all participants provided informed consent; detailed information about TMA can be found our previous study [24]. In brief, microarrays, specimens and organoids were dewaxed, antigen repaired, treated with hydrogen peroxide and blocked; then, they were incubated with specific primary antibodies (Ki-67: GB111499, Servicebio, Wuhan, China; CENPF: GTX70137, GeneTex, CA, USA; TERT: 54247, SAB, MD, USA; TERT: ab230527, Abcam, Cambridge, UK, and GB11915, Servicebio; Napsin A: GB121012, Servicebio) and horseradish peroxidase (HRP)-labeled secondary antibody, followed by staining, counterstaining and microscopy. The slides were scanned, digitalized, and quantified using a Pannoramic MIDI based on the H-score (3D HISTECH, Budapest, Hungary) [25].
Quantitative reverse transcription-polymerase chain reaction (qRT‒PCR)
Total cell RNA was extracted using RNAiso reagent (TaKaRa, Dalian, China), and cDNA was synthesized from 1.0 μg of total RNA using PrimeScript RT Master Mix (TaKaRa). Real-time PCR was performed using SYBR Premix Ex Taq II (TaKaRa) with an Mx3005p Real-Time PCR detection system (Agilent Technologies, CA, USA). β-actin was used as an internal reference. The 2−ΔΔCt method was used to determine relative gene expression. The sequences of primers used are listed in Table S1.
Western blot (WB)
Proteins from cell lysates were separated by SDS‒PAGE and transferred to a nitrocellulose membrane, which was incubated with primary specific antibodies (β-actin: 4970S, CST, MA, USA; cyclin A2: 27242-1-AP, Proteintech, Wuhan, China; cyclin B1: 28603-1-AP, Proteintech; cyclin D1: 26939-1-AP, Proteintech; cyclin E1: 11554-1-AP, Proteintech; TERT: ab230527, Abcam; TP53(DO-1): sc-126, Santa Cruz, USA and 60283-2-Ig, Proteintech; CENPF: ab5, Abcam and 58982S, CST; Histone H3: 4499S, CST; HA: T501, SAB and 3724S, CST; CEBPB: 40657, SAB; MAZ: 44263, SAB; Flag: 48043, SAB and 66008-4-Ig, Proteintech; E2F1: 3742S, CST), followed by HRP-conjugated secondary antibody (specifically, we used conformation-specific anti-rabbit IgG (5127, CST) and anti-mouse IgG (ab131368, Abcam) for immunoprecipitation). ECL reagent (Merck Millipore, Darmstadt, Germany) was applied for protein detection.
Immunofluorescence (IF)
Paraformaldehyde-fixed cells were incubated with the appropriate primary antibody (Ki-67: 27309-1-AP, Proteintech; CENPF: GTX70137, GeneTex; PCNA antibody: ab29, Abcam) at 4 °C overnight in a moist chamber, washed with PBS, and incubated with Alexa Fluor 488/594- or CY3-conjugated secondary antibodies. Nuclei were stained with DAPI.
Plate and soft agar colony formation experiments
Cells (CENPF-knock-down model of PC-9 and HCC827 cell lines) in the logarithmic growth stage were fully mixed into a single-cell suspension, seeded in six-well plates with 2 ml of medium containing 10% FBS with or without 0.35% agar, stained with crystal violet after 2–3 weeks, and the area of colonies was measured by Image-Pro Plus (Media Cybernetics, MD, USA). At least three independent experiments were performed in triplicate.
Tumoursphere formation
Cells (CENPF-knock-down model of PC-9 and HCC827 cell lines) were cultured in serum-free medium with cell line-specific annexing agents. A total of 1000–5000 cells were seeded in six-well ultralow attachment plates (Corning, NY, USA) and cultured for 1–2 weeks. The area of spheres was scored by Image-Pro Plus (Media Cybernetics, MD, USA). At least three independent experiments were performed in triplicate.
CCK-8 proliferation assays
Cells (CENPF-knock-down model of PC-9 and HCC827 cell lines, with or without telomerase reverse transcriptase (TERT) overexpression) in the logarithmic growth phase were fully mixed, inoculated in a 96-well plate, and continuously cultured for 96 h, and the number of living cells was measured every 24 h with a CCK-8 kit (Dojindo, Kumamoto, Japan). At least three independent experiments were performed in triplicate.
Cell cycle assays
Cells (CENPF-knock-down model of PC-9 and HCC827 cell line) were washed with phosphate-buffered saline (PBS), fixed with cold 75% ethanol, incubated with RNase A, stained with propidium iodide, and then analyzed by flow cytometry. At least three independent experiments were performed in triplicate.
Immunoprecipitation (IP) and liquid chromatography-mass spectrometry-(LC-MS) based proteomic analysis
The primary antibody (CENPF: ab5, Abcam; HA: 3724S, CST; Flag: 66008-4-Ig, Proteintech; E2F1: 3742S, CST and TP53: 60283-2-Ig, Proteintech) was added in an optimal amount to magnetic beads diluted in PBS with Tween-20 and then incubated with rotation at room temperature for crosslinking. After that, the supernatant was removed, and the bead-antibody complex was washed by using a magnet. Then, the cell samples extracted using a MinuteTM total protein extraction kit (Invent Biotechnologies, Plymouth, MN, USA) were added to the bead-antibody complex to immunoprecipitate the target antigen. Based on the experimental objectives, for a portion of the samples, SDS loading buffer was then added prior to SDS-PAGE and western blot analysis.
Finally, the supernatant was removed, and the beads, antibody, and antigen were gently washed and collected for further identification by LC‒MS (in-gel) following the manufacturer’s instructions (LC Bio Technology Co., Ltd., Hangzhou, China) (PC-9 cell lines, IP of CENPF: n = 3; IgG: n = 3; Input: n = 1; under accession OMIX004768; deposited at CNCB-NGDC: https://ngdc.cncb.ac.cn/) and western blotting. In the LC–MS process, after the protein is accurately quantified, its three-dimensional structure is first unfolded through reductive alkylation. Following enzymatic digestion, the resulting peptide segments are extracted. These peptide segments are then analyzed using mass spectrometry technology (Q-Exactive, Thermo Scientific) to obtain their respective mass spectra. Finally, the protein present in the sample is identified using protein identification software (Proteome Discoverer). The quality of the identification is rigorously assessed based on factors such as the distribution of peptide matching errors, the charge distribution of the peptides, and the length distribution of the identified peptide sequences.
Chromatin immunoprecipitation (ChIP)
ChIP assays were conducted according to the manufacturer’s protocol (The SimpleChIP® Plus Enzymatic Chromatin IP Kit: 9005, CST). Briefly, cells were fixed with formaldehyde, and the chromatin was fragmented by enzymatic digestion and sonication. Then, precleared chromatin was immunoprecipitated overnight with specific antibodies (anti-dimethyl-histone H3 (Lys4): 07–030, Merck Millipore; anti-trimethyl-histone H3 (Lys4): 07–473, Merck Millipore; anti-trimethyl-histone H3 (Lys27): 07–449, Merck Millipore; anti-acetyl-histone H3 (Lys9): 07–352, Merck Millipore). The following antibodies were selected for negative and positive controls: Normal Rabbit IgG: #2729, CST; Histone H3 (D2B12) XP® Rabbit mAb: #4620, CST. The enrichment of specific DNA fragments were analyzed by qPCR. The primers used are listed and explained in Table S1.
Luciferase reporter assays
Luciferase activity was determined in cell lysates using a dual-luciferase assay system (Promega, WI, USA). The CENPF promoter fragment (2000 upstream from the transcription start point of the human CENPF gene) was cloned and inserted into the pGL3 vector (Promega) to establish the pGL3-CENPF-Promoter-Luc plasmid. Moreover, the pRL-TK plasmid (Promega) carrying Renilla luciferase was co-transfected for normalization.
Patient-derived organoid (PDO) culture
Briefly, isolated fresh LUAD tissues (stage IA) obtained from Tangdu Hospital, the Fourth Military Medical University in accordance with ethics authority approval, were cut into pieces, washed, and dissociated in digestion buffer (Advanced DMEM/F12 medium (Lonza, Basel, Switzerland) with 10% penicillin/streptomycin, 1.5 mg/mL collagenase type II, 500 U/mL collagenase type IV, 0.1 mg/mL dispase type II, 10 μM Y-27632 (Tocris Bioscience, Bristol, England) and 1% FBS) for 0.5 –1 h at 37 °C. After washing, filtering with a 70-μM cell strainer (Biosharp), and centrifugation, the cell pellets were embedded in Matrigel (Corning), plated in 24-well plates and cultured in medium containing Advanced DMEM/F12 (Thermo Fisher Scientific), Noggin (R&D Systems), R-Spondin (R&D Systems), EGF (R&D Systems), Glutamax (Invitrogen), HEPES (Invitrogen), N-2 additive (Invitrogen), B27 cell culture additive (Thermo Fisher Scientific), N-acetylcysteine (Tocris Bioscience), nicotinamide (Tocris Bioscience), A83-01 (Tocris Bioscience) and SB202190 (Sigma-Aldrich). The medium was changed approximately every 4 days.
Cell-derived transplantation tumor models
LLC cells in the logarithmic growth phase (5 × 10⁵ cells/100 µl) were subcutaneously injected into the right posterior flank of each nude mouse (GemPharmatech, Nanjing, China, 4-week-old). Once the tumor volume reached ~50 mm3, mice were randomized into the indicated groups (5 animals/group). Intratumour injection of scramble or adeno-associated virus 6 (AAV6)-sh-CENPF was performed once every 2 days, four times. The tumors were measured every 3 days. Mice were killed 4 weeks later, and tumors were further assessed by weight and IHC.
Patient-derived xenograft (PDX) models
Tumors from one LUAD patient (invasive lung adenocarcinoma, IIA: T2bN0M0) were fragmented and then subcutaneously transplanted into immunodeficient mice for engraftment to build PDX models (Tangdu Hospital, the Fourth Military Medical University, Xi’an, China and GemPharmatech, Nanjing, China). After growth, the tumors were subcutaneously transplanted into 10 NOD/ShiLtJGpt-Prkdcem26Cd52Il2rgem26Cd22/Gpt (NCG) mice (GemPharmatech, Nanjing, China, 7-week-old). Once the tumor volume reached ~50 mm3, mice were randomized into the indicated groups (5 animals/group). Intratumour injection of scramble or sh-CENPF lentivirus was performed once every 3 days, four times. The tumors were measured every 3 days. Mice were killed 4 weeks later, and tumors were further assessed by weight and IHC.
Autochthonous mouse models of LUAD
Seven-week-old echinoderm microtubule-associated protein-like 4 and anaplastic lymphoma kinase (EML4-ALK)-LSL mice (Shanghai Model Organisms Center, Shanghai, China), were intratracheally intubated with purified AAV6-Cre to trigger spontaneous LUAD derived from oncogenic EML4-ALK protein, as well as scramble or AAV6-sh-CENPF (6 animals/group). Mice were killed 3 weeks following virus infection, and the whole lungs were examined by haematoxylin–eosin staining (HE) and IHC.
Enzyme-linked immunosorbent assay (ELISA)
CENPF autoantibody production in patient serum was detected using an ELISA kit (Human ACA;CENPF ELISA Kit, Shanghai Enzyme-linked Biotechnology Co., Ltd., China). Clinical serum (NC: n = 21; AIS: n = 236, IA: n = 286) (female: n = 176; male: n = 313; missed: 54; ranging from 25 to 84 years old) were collected from Tangdu Hospital, the Fourth Military Medical University (Xi’an, China), in accordance with ethics authority approval and all participants provided informed consent. Briefly, micropores were precoated with antibodies specific to the target antigens. Subsequently, 50 µL of the specimen, standard substance, and HRP-labeled detection antibody were added. The samples were incubated for 1–2 h at room temperature, followed by thorough washing and the addition of chromogenic substrate reagents. The absorbance (OD value) was measured at 450 nm using a microplate reader (Infinite 200 Pro, Tecan, Switzerland), and the sample concentrations were calculated accordingly.
Public datasets
The bulk transcriptome data and clinical information of LUAD were acquired from The Cancer Genome Atlas (TCGA) (TCGA-LUAD) [26] and the Gene Expression Omnibus (GEO) repository (GSE10072 [27], GSE13213 [28], GSE32863 [29], GSE41271 [30], GSE42127 [31], GSE43458 [32], GSE63459 [33], GSE72094 [34]). The scRNA-seq data of LUAD in E-MTAB-6149 were downloaded from ArrayExpress [35]. The CancerSEA and Cancer Cell Line Encyclopedia (CCLE) databases also provided information on the transcriptome profiles of single cells and cell lines in LUAD [36, 37].
Bioinformatics and statistical analysis
For scRNA-seq data, the R package Seurat was used for analysis [38]. Briefly, after quality control (gene numbers between 200 and 5000), the gene expression matrix was normalized (Function: NormalizeData), and 2000 genes with the most highly variable expression were selected (Function: FindVariableFeatures). The integrated data (Function: FindIntegrationAnchors and IntegrateData) were scaled, the dimensionality was reduced (Function: RunPCA, RunUMAP, and RunTSNE), and the data were clustered (Function: FindClusters; Total cells: resolution = 0.1; Epithelial cells: resolution = 0.2). Differentially expressed genes (DEGs) (Function: FindAllMarkers) with differences indicated by a P value < 0.05 and a log2 fold change (log2FC) > 0.25 were considered marker genes, which were used to identify cell types. Copy number variation (CNV) was determined to identify malignant epithelial cells (R package: infercnv). Gene set enrichment analysis (GSEA) was performed to assess biological significance based on the Hallmark databases (based on DEGs, ranked in FC order) [39].
For bulk transcriptome data, RNA-seq of cell lines and proteomic analysis, z-scaling was used for normalization, and UMAP/T-SNE (Packages: umap and Rtsne) was used to visualize the distribution of samples from different sources [40, 41]. The single-sample gene set enrichment analysis (ssGSEA) was used to quantify the relative content proportion of specific cells (DEGs of these cancer cells as background gene set) in the bulk transcriptome data [42]. Biological process enrichment was based on Reactome databases (R package: ReactomePA), and GSEA was performed to assess biological significance based on the Hallmark and Encyclopedia of Genes and Genomes (KEGG) databases (based on associated genes of target genes, ranked in correlation coefficient order) (clusterProfiler package) [39, 43,44,45]. The DESeq2 package and limma package were utilized for DEGs analysis [46, 47].
Cox analysis, Kaplan‒Meier curves, and the log-rank test and weighted log-rank test (Peto-Peto test) were used for survival analysis (Packages: survival and survminer). The Benjamini‒Hochberg (BH) method was used for P value correction for multigroup comparisons. A nomogram was used to estimate survival probability (Packages: rms). Receiver operating characteristic (ROC) curves were used for the diagnostic analyses (Packages: pROC). The GitHub platform and devtools packages were used for R package development and storage. The Wilcoxon rank-sum test, Kruskal–Wallis test, two-group t test, ANOVA, Dunnett’s t test, Tukey’s test, and Dunn’s test were utilized for differential analysis of measurement data according to data characteristics. Pearson correlation analysis was used to estimate correlativity. The chi-square test was used for rate comparison. The sample size was calculated utilizing the PASS software, taking into account the pre-experimentally estimated effect size, standard deviation, and the proportion of individuals within each group. The utilization of the random table method ensures the allocation of participants into groups in a randomized manner (investigator was blinded to the group allocation), enhancing the rigor and validity of the experimental design. The R package ggplot2 was used for graphing. R language was adopted for the above-mentioned operations, with a two-sided P value (or adj. P value) <0.05 considered to be statistically significant [48].

Comments (0)