Next-generation sequencing
The next generation sequencing was conducted by Novogene in Beijing, China. The samples were obtained from the Second Affiliated Hospital of Dalian Medical University. Each sample used 3 mg of RNA for RNA sample preparation. A 1% agarose gel was used to assess RNA degradation and contamination. The Qubit 2.0 fluorometer with the Qubit RNA analysis kit was utilized to quantify RNA concentrations, while the Bioanalyzer 2100 system with the RNA Nano 6000 assay kit was employed to evaluate RNA integrity. The BallCross suite includes interactive decomposition of transcriptome assembly, visualization of transcriptional structures, unique rich features for each locus, and post hoc annotation from assembly features to annotation features. Transcripts with adjusted p values below 0.05 were considered differentially expressed. Each group consisted of three tissue samples.
Tissue collection
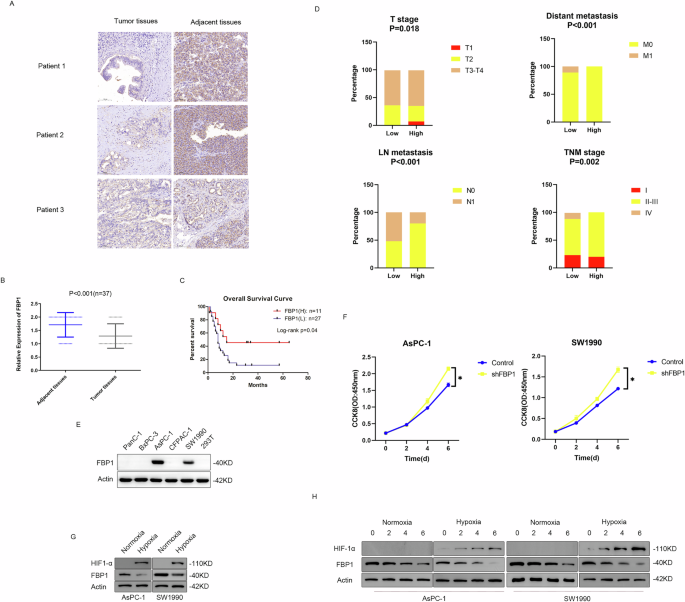
FTC specimens were obtained from three patients who provided informed consent and agreed to participate in accordance with the ethical standards of the Second Affiliated Hospital of Dalian Medical University (Dalian, China). Adjacent normal thyroid tissue samples were collected from the same patients, with a distance of more than 2 cm from the tumor lesion. All samples were confirmed by pathologists as FTC based on histopathological evaluation. These patients had not received any local or systemic treatment prior to surgery.
IHC staining analysis
Tumor samples from 20 patients diagnosed with follicular thyroid carcinoma, along with their corresponding adjacent tissues, were fixed in paraffin, sectioned, and stained using hematoxylin and eosin (Clinical and pathological information of patients can be found in Supplementary Table 2). The paraffin sections were then subjected to heat at 60 °C for 30 min. After dewaxing, antigen retrieval was performed using sodium citrate. Subsequently, the sections were treated with 3% H2O2 and blocked with goat serum. Following this, the sections were exposed to anti-EPHA5 antibody (diluted at 1:150), washed with PBS, incubated with biotinylated secondary antibody for 10 min at room temperature. Signal amplification was achieved by treating the sections with 3,3-diaminobenzidine tetrahydrochloride (DAB) followed by counterstaining with hematoxylin for 5 s. Finally, the slides were dehydrated using a series of alcohol gradients before being covered with coverslips and examined under a microscope. The immunostaining intensity was classed into four categories: negative (value = 0), weak (value = 1), moderate (value = 2) and strong (value = 3). The percentage of positive cell was classed into four categories: 0–25% (value = 0), 26–50% (value = 1), 51–75% (value = 2) and 76–100% (value = 3).
Cell culture
The human thyroid cell lines Nthy-ori 3-1, FTC133 and FTC238 were obtained from SHANGHAI WHELAB BIOSCIENCE LIMITED (Shanghai, China). Nthy-ori 3-1 and FTC133 cells were cultured in RPMI 1640 medium (Gibco) supplemented with 10% heat-inactivated fetal bovine serum (FBS) (Gibco) and 1% penicillin-streptomycin solution (Solarbio, Beijing, China). FTC238 cells were cultured in DMEM (Gibco, Grand Island, NY, USA) supplemented with 10% FBS and 1% penicillin-streptomycin solution (Solarbio). All cells were maintained in an incubator at 37 °C and 5% CO2.
Cell viability assay
Cells in the logarithmic growth phase will be treated with trypsin and then evenly distributed into 96-well plates. Each set of wells will consist of five replicates. Fill the outer wells of the plate with PBS and place it in a 37 °C, 5% CO2 incubator. Inoculate each well with a total of 5 × 10³ cells and allow them to adhere together. After aspirating the medium, treat the cells with specified concentrations of substances for a specific period. Add CCK-8 solution at a rate of 10 ml per well and then incubate the plate at 37 °C for 1 h. Measure the optical density (OD) at 490 nm using a microplate reader for each well, taking an average value, and repeating the experiment at least three times.
Colony formation assay
A total of 1000 cells were mixed well with 3 mL of culture medium containing 10% FBS in six-well plates. The cells were then maintained in an incubator at 37 °C and 5% CO2 for 1 week. After that, the plates were removed, the medium was discarded, and the residual medium was gently washed away with running water. The cells in the wells were fixed with paraformaldehyde for 30 min and then stained with 0.1% crystal violet. Clusters containing 30 or more cells were counted as one colony.
RNA interference and plasmid constructs
siRNA targeting EPHA5, negative control siRNA, and overexpression of EPHA plasmid were purchased from Gene Pharma (Shanghai, China). The sequences of the si-EPHA5 constructs were (si-EPHA5#2: 5’-GCA UGU GCA AGG CAG GAU ATT-3’, and si-EPHA5#3: 5’-CCA GCU ACA CGA UUA UCA ATT-3’). The sequences of the si-STAT3 constructs were (siRNA -STAT3: 5’-UGCUGUAGCUGAUUCCAUUGGGCCA-3’). The transfection procedures were performed according to the protocols. The FTC cells were transfected with specific siRNAs and overexpression of EPHA5 plasmid vectors using Lipofectamine 3000 transfection reagent (Invitrogen, Shanghai, China).
Quantitative reverse-transcription polymerase chain reaction (qRT-PCR)
Total RNA was extracted using RNAiso Plus (TaKaRa, Kusatsu, Japan), and cDNA synthesis and RNA amplification were performed using Prime Script RT kit and SYBR Premix Ex Taq II (TaKaRa), respectively. The expression level normalized to β-actin was determined in each sample by calculating ΔΔCt. The sequences of the primers used are shown in Supplementary Table 1.
Western blot analysis
Reagents used for western blot analysis included primary antibodies against EPHA5 (obtained from Santa Cruz, USA), STAT3 (purchased from Santa Cruz, USA), p-STAT3 (sourced from Santa Cruz, USA), cleaved caspase-3 (acquired from Beyotime Institute of Biotechnology, Shanghai, China), PCNA (obtained from Proteintech, Wuhan, China), Cyclin D1 (sourced from Proteintech, Wuhan, China) and β-actin (acquired from Beyotime Institute of Biotechnology, Shanghai, China). Protein quantification was conducted using Gel-Pro Analyzer version 4.0 software (Media Cybernetics, MD, USA).
Coimmunoprecipitation (coIP)
Total protein in FTC-238 was extracted using IP lysis buffer (20 mM Tris-HCl, 150 mM NaCl, and 1% Triton X-100, pH 7.5). For coIP experiments, the protein AG magnetic beads (Bimake, Selleck Chemical, Houston, TX, USA) were incubated with amounts of anti-STAT3 antibodies or anti-EPHA5 antibodies and according to the manufacturer’s instructions. The precipitate was washed there times with washing buffer. The pre-extracted protein supernatant and the antibody-bound magnetic beads were incubated at room temperature for 2–3 h. The precipitate was washed there times with washing buffer. Then, 50 ul of 1 × loading buffer was added to resuspend the precipitate, and boiled in boiling water for 10 min. Finally, the supernatant was collected by magnetic separation and western blotted with anti-EPHA5 and anti-STAT3 antibodies together as primary antibody at 4 °C overnight, followed by incubation with an anti-IgG light chain specific secondary antibody (Abbkine Scientific Co., Ltd., USA).
Immunofluorescence assay (IF)
The FTC-238 cells were grown on glass coverslips in 24-well plates, fixed with a 4% solution of formaldehyde, and permeabilized using 0.5% Triton X-100/PBS. After that, the cells were incubated with 5% BSA for half an hour at room temperature and then exposed to primary antibodies against EPHA5 (1:200, Santa Cruz, USA) and STAT3 (1:500, Proteintech, Wuhan, China) overnight at 4 °C. Following this step, they were treated with fluorescent dye-conjugated secondary antibody (Proteintech, Wuhan, China) for 2 h at 37 °C before being mounted with DAPI.
TUNEL assay
FTC cells were plated in 24-well dishes, fixed with a 4% formaldehyde solution, and permeabilized with 0.1% Triton X-100/PBS. Subsequently, the cells were rinsed three times for 5 min each with PBS, followed by the preparation of a fluorescent working solution according to the provided instructions and its addition to each well (50 μ/well). The cells were then incubated in a 37 °C water bath for 1 h. After gently washing with PBS three times for 5 min each, DAPI dye was introduced into each well and incubated in a 37 °C water bath for 30 min. Finally, the cells underwent another round of gentle washing with PBS three times for 5 min each before being observed under a fluorescence microscope.
Annexin V-FITC apoptosis detection kit
FTC cells were grown in 24-well plates, then the cell culture medium was removed and the cells were washed once with PBS. After that, the PBS was centrifuged at 1000 × g for 5 min. Following this, 195 μl of Annexin V-FITC binding solution was added, along with 5 μl of Annexin V-FITC, and gently mixed. Then, 10 μl of propidium iodide staining solution was added and gently mixed again. The mixture was then incubated in the dark at room temperature (20–25 °C) for 10–20 min before being placed on ice; aluminum foil can be used to protect it from light. Finally, it was immediately observed under a fluorescence microscope.
BeyoClick™ EdU-488 cell proliferation test kit
FTC cells were grown in a 24-well plate. EdU was mixed with cell culture medium at a ratio of 1:500 (10 mM) to make a working solution of 20 μM EdU. After warming the 20 μM EdU at 37 °C, an equal amount was added to the wells, resulting in a final concentration of 10 μM EdU in the plate. The cells were then allowed to incubate for an additional 2 h. Once the EdU labeling was complete, the culture medium was replaced with 0.5 ml of 4% paraformaldehyde for fixation at room temperature for 15 min. The fixative was then discarded, and each well was rinsed with washing solution. After removing the washing solution, each well received an addition of 0.5 ml PBS containing 0.3% Triton X-100 and was left at room temperature for approximately 10–15 min to facilitate permeabilization. The permeabilization solution was then removed, followed by one or two washes with washing solution. Next, add Click reaction mixture per well and gently agitate the culture plate to ensure even coverage over samples during incubation away from light at room temperature for 30 min. Subsequently, the Click reaction mixture should be removed and subjected to 3 washes using washing solution. After that, Hoechst staining solution (1×) should be added at a volume of 0.4 ml per well and incubated under light-protected conditions at room temperature for 10 min before removing excess Hoechst stain. The samples should then be thoroughly washed three more times with washing liquid as previously described before being observed under an inverted fluorescence microscope.
Drug treatment
The STAT3 inhibitor (SH-4-54) was purchased from MedChemExpress. For in vivo experiments, SH-4-54 dissolved in DMSO was administered through intraperitoneal injection at a dose of 5 mg/kg every 3 days. For in vitro studies, SH-4-54 was dissolved in sterile DMSO and used to treat FTC cells at a concentration of 10 μM for a duration of 48 h.
Animals
Athymic nude mice (6 weeks old) were procured from the Specific Pathogen-Free (SPF) Animal Experimental Center of Dalian Medical University. The animal care and experimental procedures were reviewed and approved by the Institutional Animal Care and Ethics Committee of Dalian Medical University. After 1 week of adaptation, 20 nude mice were divided into 4 groups marked as (NS group); (NS group + SH-4-54); (group EPHA5 + SH-4-54); or (group si-EPHA5 + SH-4-54) in the right groin (1 × 10⁷ cells in 200 μl of PBS). After 1 week, the tumors had grown to a measurable size. Tumor length (L) and width (W) were measured weekly with calipers, and tumor volume (V) was calculated using the formula V = LW2/2. Nude mice were sacrificed 4 weeks after tumor injection. All tumors were collected within 20 min of euthanasia and promptly frozen in liquid nitrogen.
Statistical analysis
All measurement data are processed with mean ± SD. Statistical analysis software used SPSS 19.0 for data analysis. For the data conforming to the normal distribution, the statistical method of one-way ANOVA was used to compare the mean between groups, and the Turky method was used to test. For the data that does not conform to the normal distribution, the statistical test method adopts the rank sum test (nonparametric test). p < 0.05 indicates statistical difference.

Comments (0)