
Remember me


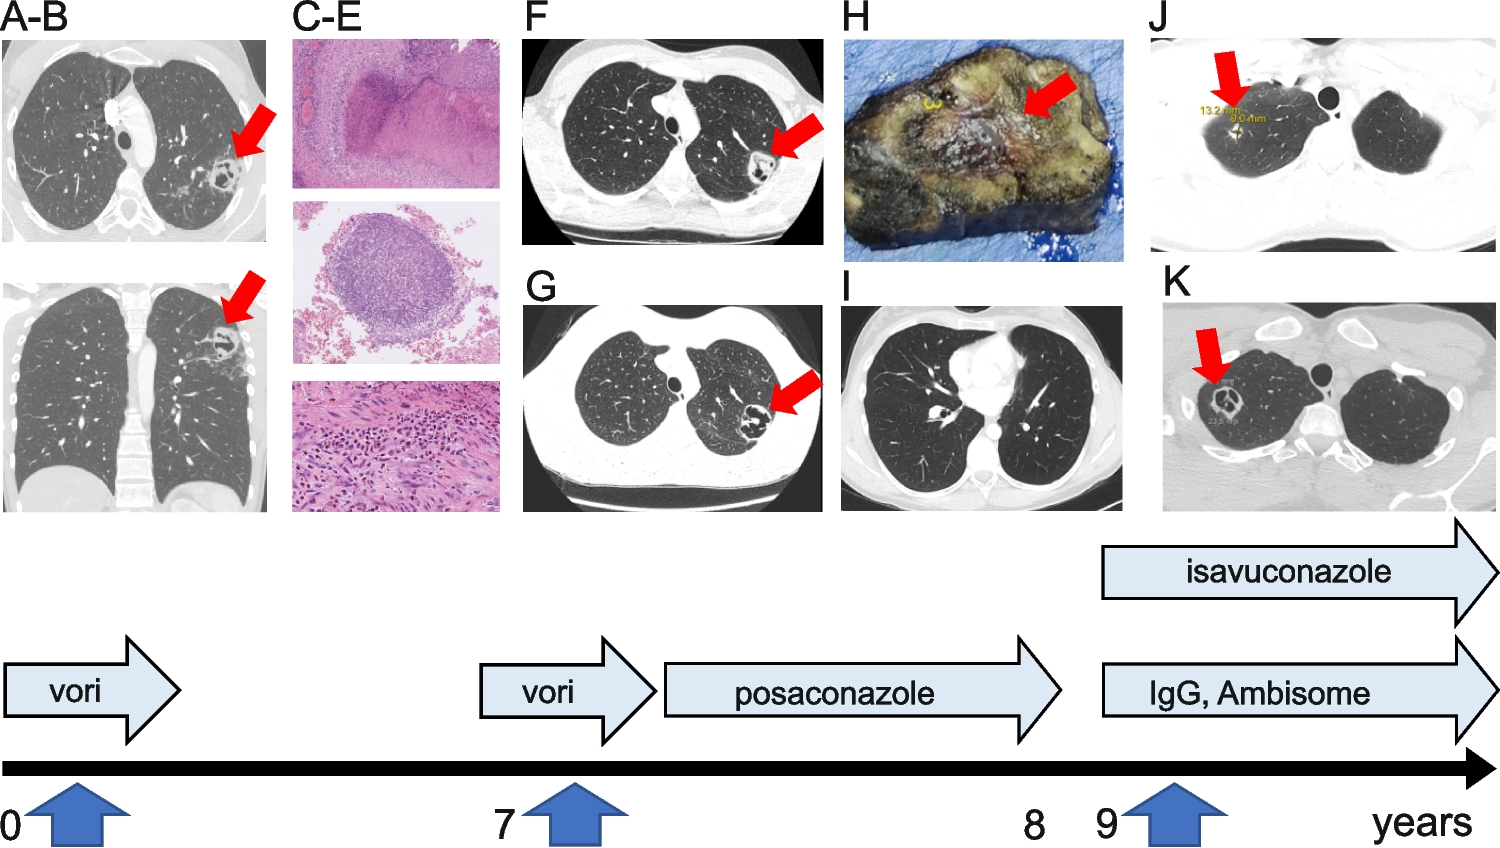
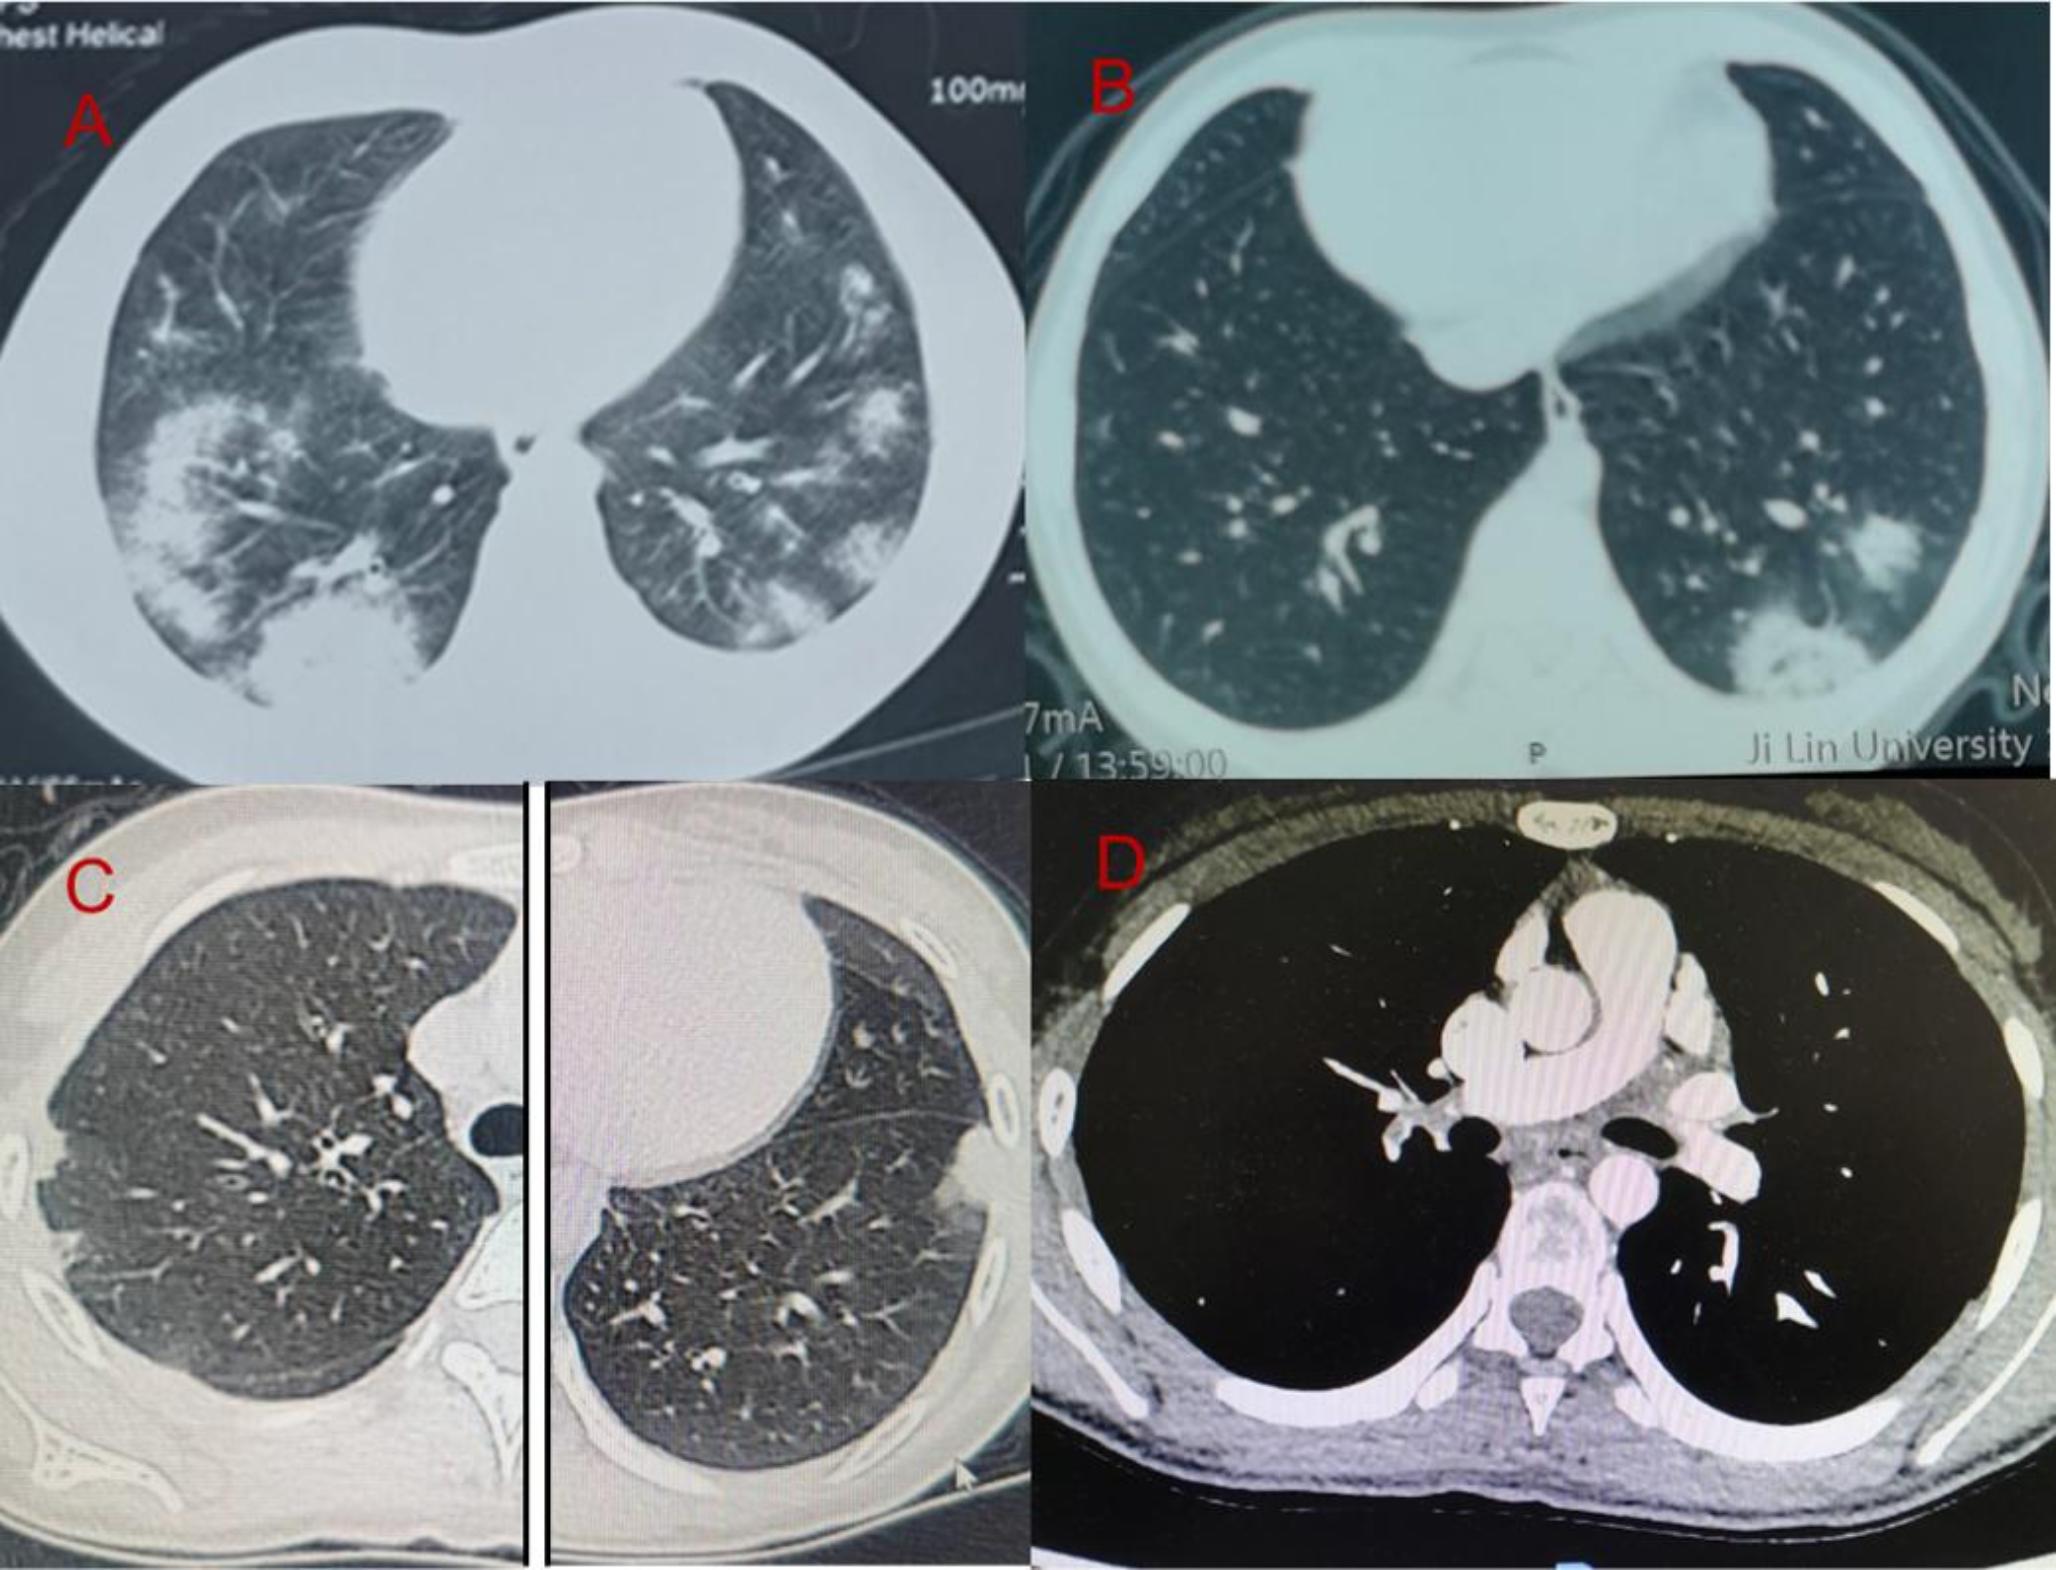
The index case with mild asthma (patient II:5) had not suffered from infections or features of HIES (NIH HIES score 16, STAT3 score 0) until she developed flu-like symptoms and hemoptysis at age 22. C-reactive protein (CRP) level and sedimentation rate were low. Computed tomography (CT) demonstrated a cavity with a rounded mass in the left lung upper lobe (Fig. 1A-B). Bronchoalveolar lavage and sputum samples were positive for Aspergillus fumigatus and negative for other pathogens. Her immunological evaluations were unremarkable although her serum IgE (380–514 IU/L, normal range < 110 IU/L) and serum Aspergillus specific IgE (2.03 IU/L; normal < 0.35 IU/L) were somewhat elevated. The cavitating lung lesion was surgically removed. The necrotic tissue samples were positive for Aspergillus fumigatus (Fig. 1C-E) and abundant eosinophils. The patient received intravenous voriconazole (200 mg twice daily) followed by oral voriconazole for one month. She had remained asymptomatic with unremarkable chest CT for six years when she developed another episode of cough and bloody sputum. Again, CT scan revealed left upper lobe lesion suggestive of aspergillosis (Fig. 1F-G). The lesion was surgically removed (Fig. 1H). Histology was consistent with aspergillosis and severe tissue necrosis suggesting necrotizing CPA. She received voriconazole followed by oral posaconazole for one year at which point her chest CT was unremarkable (Fig. 1I). Soon after, additional multiple solid lesions were observed in her lung CT (Fig. 1J-K) leading to the need of another surgical treatment. Importantly, the patient did not develop non-infectious pneumatoceles or broncho-pleural fistulae. The patient started to receive oral isavuconazole (serum concentration 3.76 mg/L) and two-week courses of liposomal amphotericin B (Ambisome, 3 mg/kg). Intravenous immunoglobulin G (IgG) substitution was administered due to a slightly low response to the Pneumovax vaccine. Despite these medications, additional pulmonary lesions developed. Asymptomatic family members were carefully investigated, and they were given instructions to avoid mold exposures and to seek for medical attention for prolonged cough. They have access to high quality immunological and clinical care.
Fig. 1
The index presented with bloody sputum at age 22 when her chest CT was consistent with chronic pulmonary aspergillosis (A, B). Histology of the lung lesion was consistent with aspergillosis and displayed high numbers of eosinophils (C-E). Seven years later, hemoptysis recurred, and chest CT showed a new aspergillosis lesion (F, G) which was surgically removed (H). One year later, the CT scan appeared unremarkable (I). Soon after, several new aspergillosis lesions were found (J, K) leading to surgical removal of the largest lesions. Medications (vori, voriconazole; posaconazole; isavuconazole; Ambisome, liposomal amphotericin B; IgG, intravenous IgG substitution) are indicated. Blue solid arrows on the timeline indicate the surgical operations
Genetics, STAT3 p.Trp37* Variant Gene Products and STAT3 PhosphorylationWhole exome sequencing (WES) revealed a private heterozygous premature termination variant in STAT3 gene (Chr17:40,500,425 C > T; NM-213662:exon2:c.G110A:p.Trp37*). The STAT3 variant was also found in heterozygosity in her mother (I:2) and her brother (II:4) (Fig. 2A, B and C) who were both asymptomatic, had low HIES score and no history suggestive of HIES, STAT3 GOF or any other immunodeficiency condition. No other genetic variants with potential significance from the patient’s WES have been identified (Supplemental Table 1). Furthermore, no other clinically significant variants were observed in an in-house curated set of known and putative IEI genes based on genome sequencing of the patient’s DNA.
Fig. 2
A Family segregation of the STAT3 p.Trp37* allele in the kindred. The index (II:5) is marked with a solid arrow. B A schematic of the filtering criteria and amounts of variants from whole exome analysis (C). Whole exome sequencing revealed a private heterozygous premature stop gained (p.Trp37*) in STAT3 gene. Possible re-initiation sites (methionine 99 and 143) are indicated with arrows. D p.Trp37* variant affects the splicing of exon 2 in STAT3. E STAT3 immunoblotting on STAT3 deficient A4 cells transfected with WT or p.Trp37* STAT3 variant. p.Trp37* STAT3 variant produced lower MW products compared to WT STAT3, indicating a re-initiation. F The STAT3 p.W37X mutation expression from RNA-Seq data. G Intracellular STAT3 immunostaining measured by flow cytometry on PBMC from heterozygous Trp37* variant carriers and controls without (left) and with stimulation with IL-6 (right) (H). Time course of phospho-STAT3 by intracellular immunostaining in PBMC from heterozygous Trp37* variant carriers, non-carrier relatives, and healthy controls upon IL-6 or IL-21 stimulation. I Time course of phospho-STAT1 by intracellular immunostaining in PBMC from Trp37* variant carriers, non-carrier relatives, and healthy controls upon interferon-alpha, IL-6 or IL-21
Analysis of the p.Trp37* variant consequence on STAT3 transcript by in vitro exon-trapping in COS-7 cells showed that the variant may lead to alternative splicing events by splicing out the exon 2 and removing the start Methionine (Fig. 2D). Immunoblotting assessment of p.Trp37* STAT3 over-expression in STAT3-negative A4 cells revealed products at a lower molecular weight, consistent with re-initiation at positions M99 and M143, as previously described [21] (Fig. 2E).
The study on PBMCs from I:2, II:4, II:5 individuals by RNA-Seq demonstrated that both alleles (WT: C nucleotide and mutated: T nucleotide) are transcribed (Fig. 2F). However, a slight reduction in the proportion of the p.W37* allele is observed from 40% in individual I:2 to 30% in the index case (II:5) and her brother (II:4). Finally, STAT3 protein expression by immunoblotting or flow cytometry in PBMCs in carrier’s family members were not reduced when compared to healthy controls (Fig. 2G, Supplemental Fig. 1).
We thus assess the activation of STAT3 by measuring the phosphorylation level in all three heterozygous p.Trp37* STAT3 carriers (II:5-index, I:2, II:4) upon IL-6 and IL-21. All displayed 50% reduced STAT3 Tyr705 phosphorylation at different time-points after IL-6 or IL-21 stimulation (Fig. 2H) when compared with healthy controls or family members who are non-carrier of p.Trp37* allele (I:1, II:3). However, STAT1 phosphorylation was at a similar level after IFN-γ, IL-6, or IL-27 stimulation in the p.Trp37* cases and healthy controls (Fig. 2I).
Peripheral Blood Lymphocytes and Their SubpopulationsLymphocyte immunophenotyping of patient II:5 was unremarkable. The response to pneumococcal polysaccharide antigens (Pneumovax®) was reduced with adequate responses to only 5 of the 10 tested serotypes [22]. While total CD3+CD4+ and CD3+CD8+ T cell counts were normal, effector memory populations were below normal range. Proportion of Th17 in the index case was reduced (9.3%, normal range 19–34%) but not absent. Th1 in turn was above normal range (45%, normal range 16–32%). IL-17 was also lower (0.47) than that observed in healthy control (0.72).
STAT3 p.Trp37* Transcriptional ActivityIn STAT3 deficient A4 cells, the re-expression of full-length wild type STAT3 (WT) or full-length cDNA of the p.Trp37*variant (Trp37*_full-length in Fig. 3A) demonstrated increased luciferase activity, which is twice as the control for the Trp37*-full length variant. Instead, expression of a cDNA encoding only the first 37 AA of STAT3 had no detectable effect on activity (Trp37*_short, Fig. 3A and Supplemental Fig. 2). To examine dominant negative effect, WT STAT3 or p.Trp37*_short (Fig. 3B,) in HEK293T which expressed endogenous STAT3 activity were transfected, and luciferase activity determined. A dose-dependent increase in luciferase activity was observed after IL-6 stimulation in HEK293T cells overexpressing WT STAT3. However, increasing amount of STAT3 Trp37*_short in HEK293T cells did not interfere with luciferase activity (Fig. 3C), suggesting that the STAT3 N-terminal 1 to 37 AA peptide does not display DN effect on transcriptional activity, in contrast to STAT3 p.Arg382Trp allele which has been reported to be amorphic and DN (Fig. 3A-C). Finally, HEK293T cells transfected with a control GFP expressing vector or with STAT3 p.Trp37*_short expressed similar levels of phosphorylated STAT3 and total STAT3 after IL-6 stimulation (Fig. 3D).
Fig. 3
Luciferase activity (fold change) in STAT3 deficient A4 cells in non-transfected (mock), empty vector (EV), wild type STAT3 (WT), whole STAT3 sequence with p.Trp37* (W37*_Full-length), STAT3 N-terminal peptide amino acids 1–37 (W37*_short), or dominant negative STAT3 (Arg382Trp) (A). Luciferase activity (fold change) in STAT3 positive HEK293T cells in non-transfected (mock), empty vector (EV), wild type STAT3 (WT), whole STAT3 sequence with p.Trp37* (W37*_Full-length), STAT3 N-terminal peptide amino acids 1–37 (W37*_short), or dominant negative STAT3 (Arg382Trp). The y-axis represents STAT3 transcriptional activity levels normalized against unstimulated activity in EV-transformed cells. Each dot represents a biological replicate obtained from technical replicates. B Luciferase activity (fold change) in HEK293T cells with endogenous STAT3 expressing an increasing amount of wild type (WT) or whole STAT3 sequence with p. Trp37X or dominant negative STAT3 (Arg382Trp). D HEK293 cells were transfected with GFP and MAC-tag-N vector containing STAT3 p.Trp37*_short using calcium phosphate. Two days after transfection, cells were stimulated with or without IL-6 for 30 min. Cells were collected for further Western blot detections of tyrosine phosphorylated STAT3 and total STAT3. Immunoblots from two independent experiments are shown
Expression Profiles in STAT3 p.Trp37* PBMCsSince seemingly conflicting results of reduced phosphorylated STAT3 in vivo and isomorphic transcriptional activity of the p.Trp37* STAT3 in vitro were observed, we compared the transcriptional expression from unstimulated PBMCs obtained from the index to a patient with confirmed STAT3 GOF (STAT3 p.Arg278His) normalised by 2 unstimulated healthy individuals [7]. In STAT3 p.Arg278His GOF PBMCs, high CXCL10, IFNG and STAT1 expression was observed. Similar changes indicative of STAT3 GOF were not seen in the expression profile of STAT3 p.Trp37* PBMCs from the index case (Fig. 4). Both these results and the clinical phenotype thus argued against STAT3 GOF phenotype.
Fig. 4
Selected immunological expression profiles of index PBMCs. mRNA fold changes compared to healthy controls in unstimulated index STAT3 p.Trp37* and Arg278His (STAT3 GOF) PBMCs of seven IFN-regulated genes (A), type II IFN (B), inflammasome (C), NF-κB pathway (D), JAK/STAT pathway (E), and interleukins (F) related genes. Mean of three measurements together with SD is presented
Stimulated PBMCs from three p.Trp37* variant carriers and their controls underwent RNA-Seq transcriptomic analyses. Principal component analysis (PCA) showed that the transcriptomes of p.Trp37* positive cases were rather similar when compared to matched controls, with minor differences between the expression profiles of the index I:2 and her control (Fig. 5A). Group comparison of the 3 family members versus the 3 controls only generated expression changes of 20 genes (Supplemental Table 4). Among them, a significant up-regulation of CXCL9 in the 3 carriers has been found, a gene previously reported as upregulated in T-cell from CD4-conditional STAT3-deficient mice [23]. Since the other two family members are healthy, and they do not suffer from infections or HIES phenotype, we focused on comparison of expression profiles between the index patient and her control. Of the 15,596 genes detected in IL-6 stimulated PBMCs from the index and her control sample, expression of 301 genes was reduced in IL-6 stimulated p.Trp37* PBMCs and expression of 315 genes was enhanced when compared with the control, suggesting the possibility of neomorphic effects (Fig. 5B, Supplemental Table 5). Importantly, as shown in Fig. 2F, the RNA-Seq results performed from primary patient cells have confirmed the presence of the reported variant. Notably, the RNA-Seq data showed no changes of total STAT3 mRNA expression level in the three heterozygous p.Trp37* variant family carriers versus controls (Fig. 5C). Interestingly, the Th17 differentiation pathway was dissimilar (Fig. 5D), with reduced expression of RORC, TBX21, IFNG and HLA-DRB5 in the patient’s sample (Fig. 5E, 5F) [24]. Expression of 10 selected genes, including FOXP3 and IKAROS Family Zinc Finger 4 (IKZF4) was significantly upregulated in the patient’s sample compared with her control (Fig. 5D-F). qPCR further confirmed the increased expression of FOXP3 and reduced RORC and TBX21 in the index patient’s IL-6 stimulated PBMCs [25]. Finally, we explored whether the variant could create a new allele by quantifying the STAT3 cDNA expression using probes targeting the 5’ (exon 2) or the middle (exon 14) of STAT3 by qPCR. As shown in Fig. 5G, no difference using both probes were observed on the PBMCs from the index or compared to her control.
Fig. 5
Transcriptomics analysis reveals distinct gene expression profiles in cases with STAT3 p.Trp37* mutation. A PCA plot of transcriptomes of IL-6 stimulated PBMCs from three STAT3 p.Trp37* variant positive cases and sex/age matched controls X-axis represents the contributor rate of the first component. Y-axis represents the contributor rate of the second component. Points represent each sample. Ellipses were drawn manually. B The number of differentially expressed genes from IL-6 stimulated PBMCs from three STAT3 p. Trp37X mutated cases and sex/age matched controls are shown. C STAT3 mRNA expression of the three family members with the STAT3 p.W37X mutation and their controls from RNA-Seq data obtained from IL-6 stimulated PBMCs. D KEGG pathway analysis was performed on up-regulated and down-regulated genes in IL-6 stimulated PBMCs from the indexed patient versus her control comparison. The pathways presented in the plot are significantly enriched; The colour indicates the q-value, the lower q-value indicates the more significant enrichment. Point size indicates DEG number. The larger the value of the rich factor, the more significant enrichment. E Heatmap showing the log fold change values of selected genes significantly changed in IL-6 stimulated PBMC from patient versus control (F). Quantitative RT-PCR detections of Foxp3, RORC and TBX21, key transcription factors for Treg, Th17 and Th1 cells respectively. G Quantitative RT-PCR mRNA expression using 5’UTR probe (upstream the W37* variant), and probe in the middle of the transcript (downstream the W37* variant) the p.W37X mutation site respectively, fragments of STAT3. EF1α was used as endogenous control in all the qPCR detections
Comments (0)