Clinical Samples
Serum or plasma samples were obtained from subjects from four phase 1 clinical trials. The study protocols were approved by independent ethics committees and were carried out in accordance with the Declaration of Helsinki and in compliance with current regulations and standards of Good Clinical Practice. All participants provided written informed consent. These samples were stored long-term at −80°C and were shipped for this study on dry ice. A total of 26 samples were selected from four different clinical trials, each corresponding to a unique biotherapeutic drug (drug modality and more information about the clinical trial samples can be found in Table I). For each trial, samples were selected to cover a wide range of ADA titers based on reported titer by prior analyses. For Trials 1–3, we selected samples from different patients that were drawn at one timepoint post-treatment. For Trial 4, we chose samples from two post-treatment timepoints for three subjects: the first timepoint exhibited a low-medium titer, and the following timepoint exhibited an increase in titer magnitude. It should be noted that plasma samples were chosen for Trial 3 due to the unavailability of serum samples.
Table I Study Trials and SamplesBiotin- and Ruthenium-Drug Conjugation
Drug was dialyzed against phosphate buffered saline (PBS: 100 mM sodium phosphate, pH 7.5, 150 mM sodium chloride). Following dialysis, the drug concentration was determined by BCA assay (Pierce, cat# 23225) and adjusted to 2 mg/mL. For biotin labeling, EZ-Link™ Sulfo-NHS-LC-Biotin at 10 mM (Thermo Fisher Scientific, cat# A39257) was combined with drug at a 20:1 molar ratio and incubated on ice for 2 h. For ruthenium labeling, 3 mM MSD SULFO-TAG NHS-Ester (MSD, cat# R91AN) was mixed with drug at a 12:1 molar ratio and incubated on ice for 2 h. Labeling reactions were stopped by the addition of a 1/10 volume of 1 M Tris–HCl, pH 7.5. Bt-drug and Ru-drug were concentrated using an Amicon filter device and then purified by SEC. The final mass concentration was determined by BCA, and an equal volume of glycerol was added to the Bt-drug and Ru-drug prior to storage at –20°C.
Generation of Controls
Affinity purified hyperimmune monkey serum (AP-HIMS) was individually generated for each drug. Briefly, monkeys were dosed several times over the course of seven weeks, and bleeds yielded hyperimmune monkey serum (HIMS) with high titers. For affinity purification of each resulting HIMS, the corresponding drug was coupled to Affi-Gel10, which was then used to deplete any endogenous target and non-specific binders from normal human serum (NHS). The HIMS was then incubated with the depleted NHS to allow the sequestration of non-specific anti-Fc antibodies that might be present. The HIMS in the depleted NHS was then affinity purified against the corresponding drug. The AP-HIMS was spiked into a pool of NHS from naïve donors to generate a set of positive and negative controls for each drug/trial. Three spike concentrations of AP-HIMS were selected to generate high, medium, and low positive control (PC) signals, and un-spiked NHS was used as a negative control (NC). To assess inter-assay precision, the mean signal, standard deviation, and %CV of each reportable result across multiple independent experimental runs were calculated. Acceptance criteria for each assay were established using these inter-assay precision results. All controls on each plate had to fall within ± 40% of the established average values for results from a plate to be reported.
Immunogenicity Assays
Individual immunogenicity assays were previously developed and validated to analyze clinical samples from each trial. Whereas all samples were analyzed using the affinity capture and elution (ACE)-Bridge assay format, additional sample pretreatment steps were performed for samples from trial 2 (upfront acid treatment, UFAT) and trial 4 (low pH upfront acid treatment, UFATLP). The requirement of pretreatment was determined during original assay development and was shown to enhance critical assay parameters such as sensitivity and drug tolerance for these two assays.
Samples from trial 1 and trial 3 were analyzed using the standard ACE-Bridge assay format (19, 20). Pierce™ Streptavidin Coated High Capacity 96-well plates (Thermo Fisher Scientific, Cat #15500) were washed with TBST (1 × Tris-buffered saline + 0.1% Tween® 20) and subsequently coated with 100 μL per well of 1 (drug 1) or 5 μg/mL (drug 3) of biotinylated-drug in TBST + 0.1% BSA (bovine serum albumin) for 1 h at room temperature. All incubations occurred at 600 rpm on a TitraMax vibrating platform shaker.
Following incubation, the plate was washed three times with TBST. All samples were diluted in 1 × TBS at a predefined MRD (minimum required dilution) and 100 μL of the diluted samples were transferred to the plate and allowed to incubate overnight at 4 °C with shaking.
The following day, plates were washed three times with TBST, and captured ADA were acid eluted using 65 μL per well of 300 mM acetic acid (prepared from glacial acetic acid, Sigma, AX0073-6) for 5 min at room temperature with shaking. A polypropylene 96-well plate was loaded with 50 μL of 1 μg/mL each of the biotinylated and the ruthenium-labeled drug in a neutralizing buffer (375 mM Tris–HCl, pH 9.0 + 2 × TBS + 2% BSA). Next, 50 μL of the acid eluted samples were transferred to the polypropylene plate containing the neutralizing mixture, and ADA were allowed to bridge the labeled biotherapeutics for 1 h at room temperature. At the same time, an MSD Gold 96-well streptavidin plate was washed and blocked with TBS + 1% BSA for 1 h at room temperature. Afterward, the blocked MSD plate was washed three times with TBST, and 80 μL of the bridged samples were transferred to the MSD plate for 1 h incubation at room temperature. Finally, the MSD plate was washed with TBST, and 150 μL of 2 × MSD Read Buffer (prepared from 4 × MSD Read Buffer, Mesoscale Discovery, Cat# R92TC-1) were added to the wells, and the signal was recorded in electrochemiluminescent units (ECLU) on an MSD SQ120 reader (MSD, Rockville, MD).
Drug 2 used the UFAT ACE-Bridge assay format. Pierce™ Streptavidin Coated High Capacity 96-well plates (Thermo Fisher Scientific, Cat #15500) was washed with TBST (1 × Tris-buffered saline + 0.1% Tween® 20) and subsequently coated with 100 μL per well of 5 μg/mL of biotinylated-drug in TBST + 0.1% BSA (bovine serum albumin) for 1 h at room temperature. All incubations occurred at 600 rpm on a TitraMax vibrating platform shaker. Following incubation, the plate was washed three times with TBST.
All samples were diluted in 1 × TBS to the predefined MRD. The diluted samples were then acidified. Briefly, 40 μL of 270 mM Acetic + 1% Triton (300 mM Acetic Acid + Triton X-100, Thermo Fisher Scientific, Cat# 28314) were added to 80 μL of the diluted sample and incubated for 5 min at room temperature with shaking. During this incubation, 50 μL of 250 mM TRIS-TBS (1 M Tris–HCL, pH 9.0, + 10 × TBS + water) were added to the washed coated plate. After the 5-min incubation, 100 μL of the acidified samples were transferred to the coated plate containing the TRIS-TBS and allowed to incubate overnight at 4°C with shaking. The remainder of this protocol directly follows the remaining steps outlined in the ACE-Bridge section.
Drug 4 used the UFATLP ACE-Bridge assay format (21). Pierce™ Streptavidin Coated High Capacity 96-well plates (Thermo Fisher Scientific, Cat #15500) was washed with TBST (1 × Tris-buffered saline + 0.1% Tween® 20) and subsequently coated with 100 μL per well of 1 μg/mL of biotinylated-drug in TBST + 0.1% BSA (bovine serum albumin) for 1 h at room temperature. All incubations occurred at 600 rpm on a TitraMax vibrating platform shaker. Following incubation, the plate was washed three times with TBST.
All samples were diluted in 1 × TBS to the predefined MRD. The diluted samples were then acidified. Briefly, 40 μL of 300 mM Acetic were added to 80 μL of the diluted sample and incubated for 5 min at room temperature with shaking. During this incubation, 50 μL of 170 mM TRIS-TBS (1 M Tris–HCL, pH 9.0 + 10 × TBS + water) were added to the washed coated plate. After the 5-min incubation, 100 μL of the acidified samples were transferred to the coated plate containing the TRIS-TBS and allowed to incubate overnight at 4°C with shaking. The remainder of this protocol directly followed the subsequent steps outlined in the ACE-Bridge section.
Tier 3 Evaluation of Clinical Samples
Briefly, each sample underwent a twofold dilution series in negative serum pool followed by ADA analysis outlined in the “Immunogenicity Assays” section. The signal to noise ratio (S/N) was calculated as described in Eq. 1, and the titer was defined as the final dilution at which the S/N was > the floating cut point (FCP). The FCP for each assay was determined during assay development and/or validation.
Test Conditions
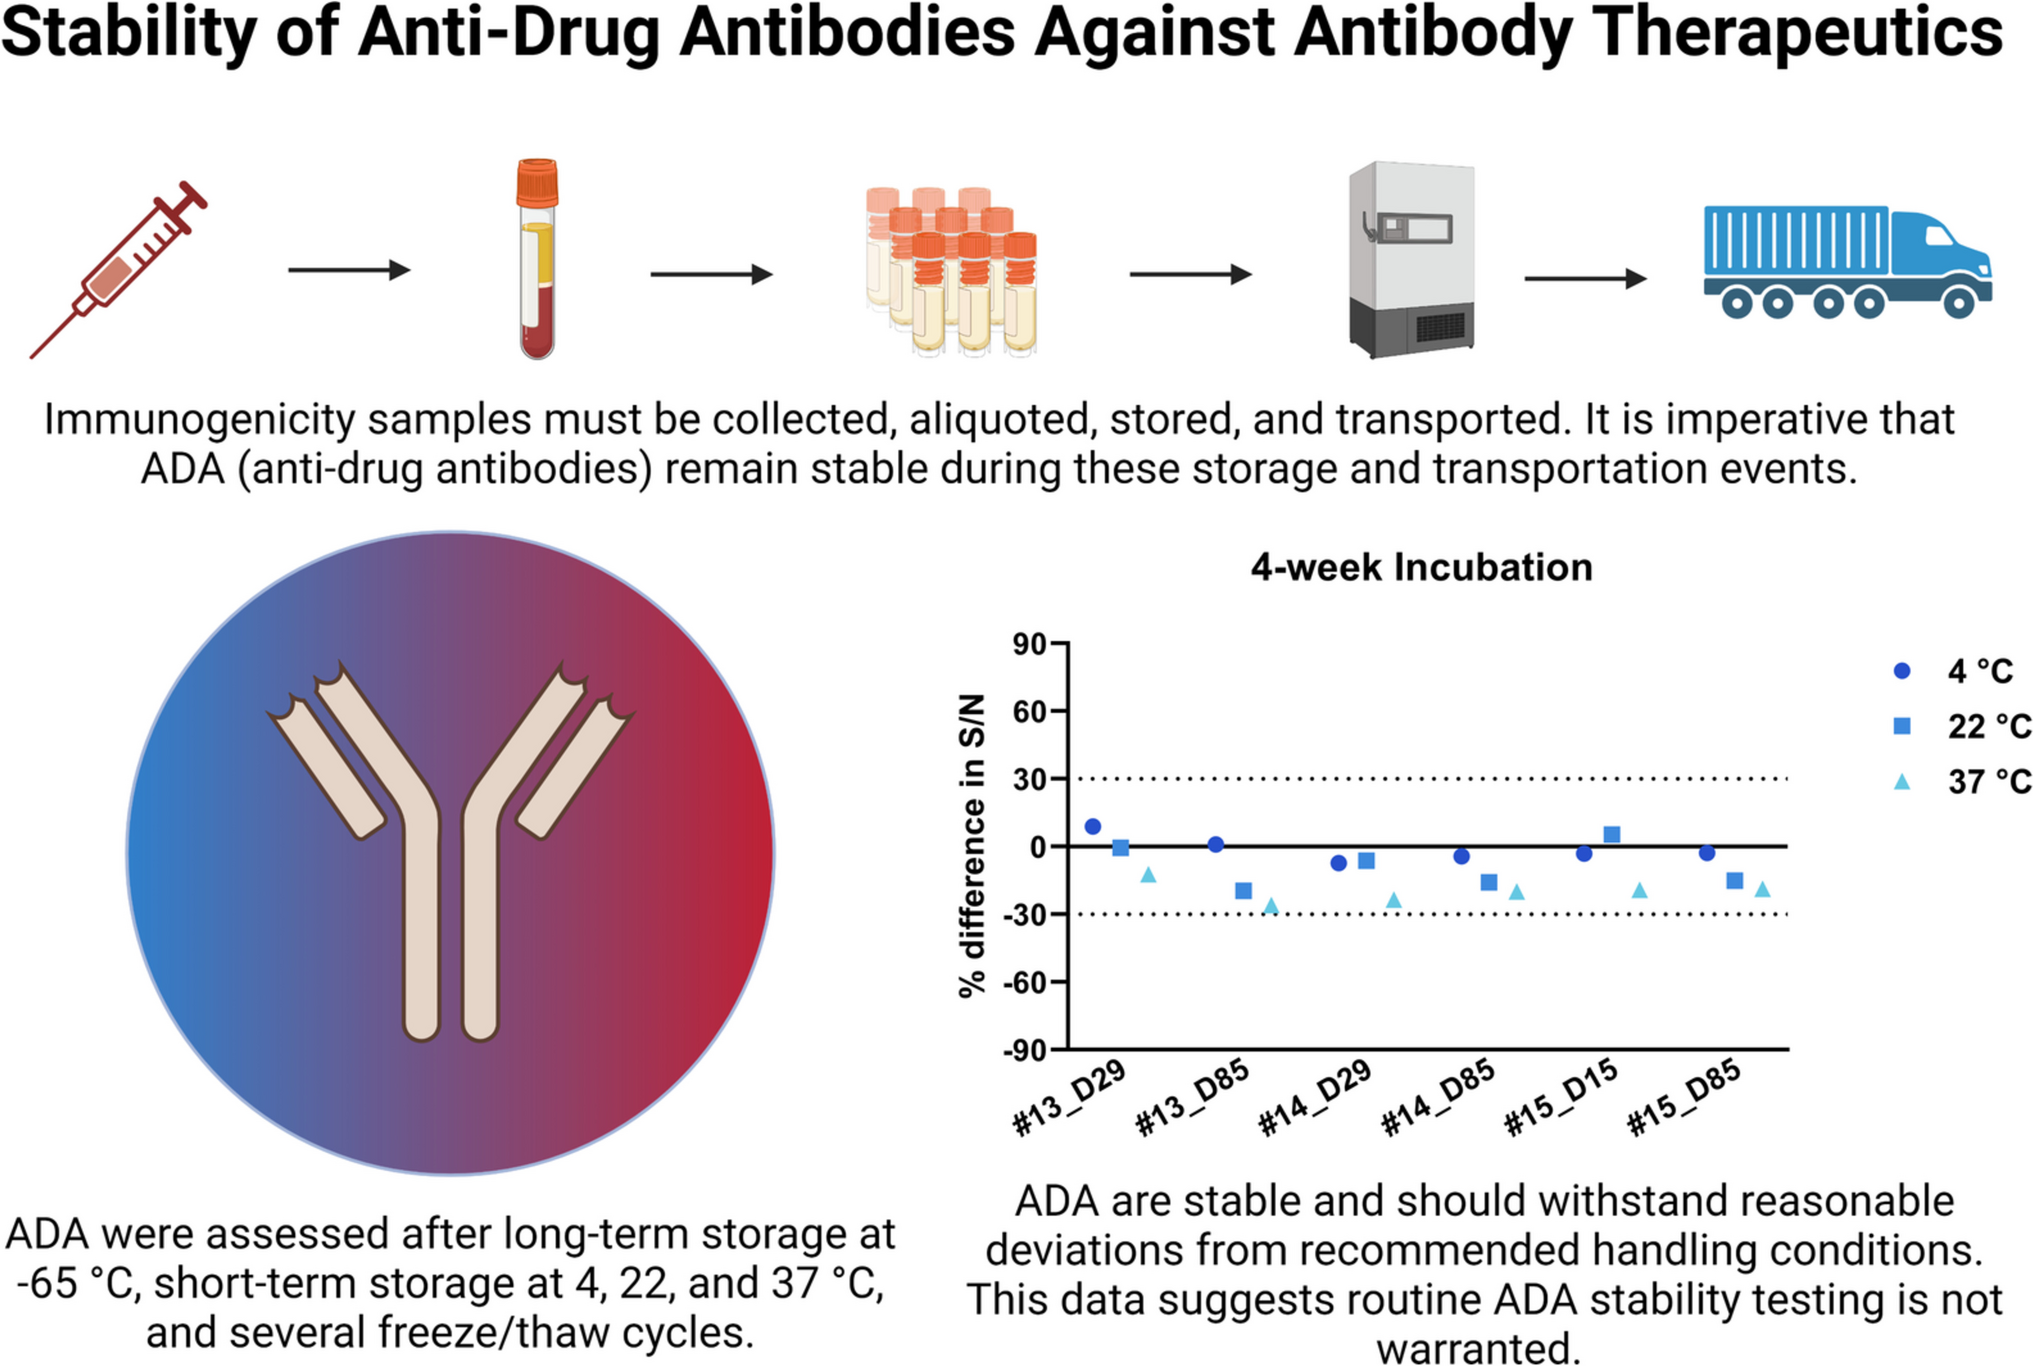
Subject samples were separated into 19 equal volume aliquots and were subject to the following test conditions: 24 h, 48 h, 72 h, 1 week, and 2 weeks at 4 ⁰C, 22 ⁰C, or 37 ⁰C. The sample defined as the original sample (OG) was stored at −80 ⁰C, post-aliquot.
18 test conditions plus the OG for each subject sample were run on a single plate to avoid plate to plate variability and allow for direct comparison. For Trial 4, additional aliquots were prepared to test ADA stability after 4-weeks of incubation at 4 ⁰C, 22 ⁰C, and 37 ⁰C.
Calculations
The following equations were employed to assess the ADA stability in clinical samples and compare any differences among test groups:
$$Signal\;to\;Noise\;Ratio\;( \frac )=\frac$$
(1)
$$\%\;difference\;in\;\frac=\frac\;of\;Test\;Sample\;-\;\frac\;of\;OG\;Sample\;\right)}\;of\;OG\;Sample}*100$$
(2)
S/N was chosen to evaluate the assay signal. In a clinical setting, Tier 1 positivity and Tier 3 titer determinations are based on S/N. Additionally, S/N is widely accepted method for determining the magnitude of ADA responses (22,23,24).
There are no official recommendations for the acceptance criteria for ADA stability analysis, but as per bioanalytical method validation guidelines, evaluation of incurred sample reanalysis (ISR) is determined by calculation of % difference between initial result and the result measured during repeat analysis (8). For ADA stability analysis, we calculated % difference in S/N of the test condition relative to the original (OG) sample measurement (Eq. 2). Testing criterion required that samples should agree within 30% of the original (25, 26). Linear regression analysis was performed using GraphPad Prism software version 10.3.1 using the OG S/N as reference.


Comments (0)