
Remember me


Pooled normal human serum (NHS, BioIVT, Westbury, NY) was aliquoted into Sarstedt Polypropylene Microcentrifuge 2 mL storage tubes (manufacture maximum capacity 2.0 mL, Sarstedt, Nümbrecht, Germany) at a volume of 0.5 mL, 1.5 mL, and 2.0 mL to represent the different fill levels. The NHS samples were then frozen at −70 °C for 5 days before being transferred to the benchtop to thaw at room temperature. The tubes were visually examined for thaw conditions at the following timepoints: 15, 30, 60, and 120 min.
Peroxidase conjugated-sheep anti-human IgG (The Binding Site, Birmingham, UK) was spiked into 2 mL of NHS at the concentration of 200 ng/mL as the high filled serum samples, followed by sample freezing at −70 °C for 5 days. The peroxidase-IgG high filled samples were thawed at room temperature for 30 min, and then either mixed thoroughly (by inversion and vortexing) or not mixed prior to sample testing. Ten microliters of samples were diluted in assay diluent (PBS, 0.5% BSA, 0.05% Polysorbate 20, and 0.05% Proclin 300, pH 7.4) to mimic the commonly used minimum required dilution (MRD) of 1:50. The diluted peroxidase-IgG overfilled sample (10 µL) was added to a 96-well NUNC Maxisorp microtiter plate, followed by 100 µL of KPL peroxidase substrate (Seracare Life Science Inc, Milford, MA) and incubated for 5 min at room temperature. The peroxidase enzyme reaction was stopped by adding 100 µL of 1 M phosphoric acid solution. Plates were then read at 450 nm, referenced at 630 nm on a plate reader (Molecular Devices SpectraMax i3x). The data was plotted and analyzed using Prism (v. 10.2.3, GraphPad Software LLC, Boston, MA).
High Filled and Proper Filled Sample PreparationThe mock samples were prepared by spiking drug A and drug B materials (Genentech, South San Francisco, CA) into pooled NHS. The samples were prepared at a mid-level of expected PK concentration of this study targeting 101.5 µg/mL of drug A and 200 µg/mL of drug B. Test samples were then prepared by aliquoting the bulk material into Sarstedt Polypropylene 2 mL Microcentrifuge storage tubes at a volume of either 1.25 mL to represent appropriately filled tubes, or 2 mL to replicate overly filled tubes. The samples were then stored at −70 °C until use.
Drug A and Drug B Human PK Serum Enzyme-linked Immunosorbent Assays (ELISA)Drug A concentration was determined using a validated semi-homogeneous ELISA with an upper limit of quantitation (ULOQ) of 1000 ng/mL and a lower limit of quantitation (LLOQ) of 15.6 ng/mL. Briefly, standards, quality controls, and unknown samples were diluted at the MRD of 1:50 in sample diluent, then incubated with the biotin-target and DIG-target conjugates (Genentech, South San Francisco, CA) overnight. After overnight incubation, samples were transferred to a StreptaWell High Bind Transparent 96-well microtiter plate (Roche Diagnostics GmbH, Mannheim, Germany). Drug A was detected using peroxidase-conjugated IgG Monoclonal Mouse Anti-Digoxin (anti-DIG-HRP) (Jackson ImmunoResearch Laboratories, Inc, West Grove, PA). Drug B concentration was determined using a validated sandwich ELISA with an ULOQ of 2400 ng/mL and a LLOQ of 60 ng/mL. Standards, quality controls, and unknown samples were diluted at the assay MRD of 1:100 in sample diluent. Drug B was captured on a plate coated with recombinant his-tagged human target. Biotinylated anti-framework antibody 10C4 (Genentech, South San Francisco, CA) was used as the detection antibody, followed by avidin-HRP (Vector Laboratories, Newark, CA). For both drug A and drug B methods, tetramethylbenzidine substrate (TMB) from KPL Inc. (Gaithersburg, MD) was then added after detection antibodies incubation and the reaction stopped by adding a 1 M phosphoric acid solution. Plates were read on a plate reader at 450 nm and 630 nm. Sample concentrations were extrapolated from a four-parameter fit standard curve using Softmax Pro (version 6.5.1, Molecular Devices, LLC, San Jose, CA).
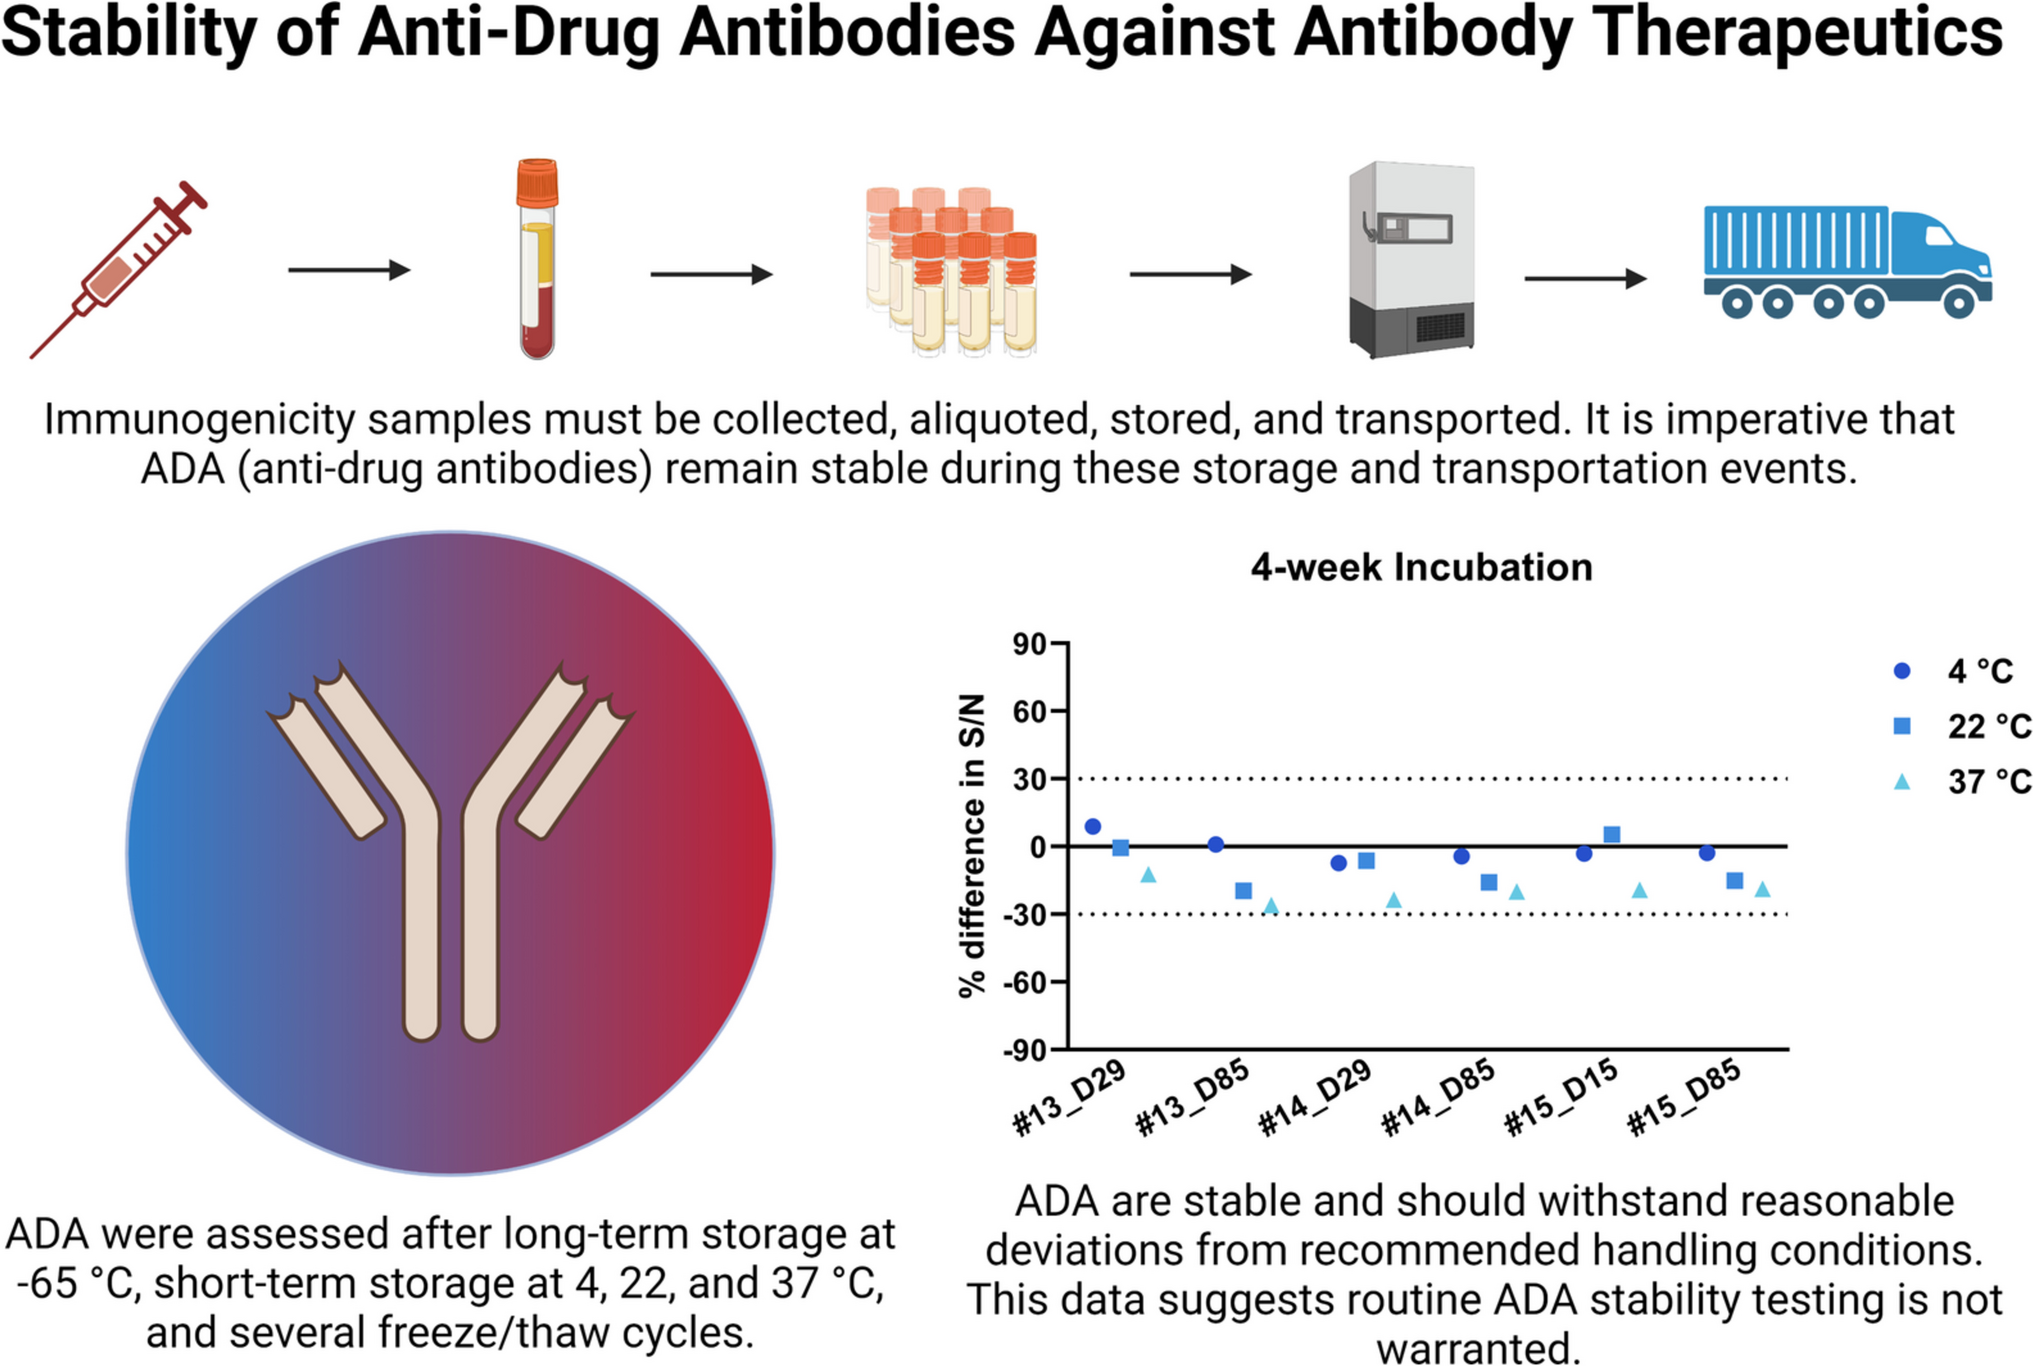
Data Analysis and Incurred Sample Reanalysis (ISR) CalculationThe data was plotted and analyzed using Prism (v. 10.2.3, GraphPad Software LLC, Boston, MA). One-way ANOVA statistical analysis and descriptive statistics analysis were performed (Figs 1, 2 Tables I and II). The percent difference between the nominal concentrations and the measured concentrations is calculated using the following equation: % difference = [(measured value − nominal value)/ (nominal value)] X 100 (Fig. 2, Tables I and II). The percent difference between the initial concentration and the measured concentrations during the repeat analysis is calculated in relation to their mean value using the following equation: % difference = [(repeat value − initial value)/ (mean value)] X 100 (Fig. 3). For large molecule ligand binding assay ISR, the percentage of difference criteria is at least 2/3 of the values of the repeat samples should be within ± 30% of the values of the original. The ISR pass rate is calculated as follows: (the number of repeat analyzed samples passing the acceptance criteria)/number of total repeat analyzed samples [4, 5, 9, 10].
Fig. 1
A Examination of thaw conditions in different levels of serum samples. Cartoon depicting 0.5 mL, 1.5 mL, and 2.0 mL sample fill levels with images of actual frozen test samples and the same samples after 30 min thaw time at room temperature. B The absorbance unit of the Peroxidase IgG high filled samples under different mixing conditions. The Peroxidase IgG overfill samples were either mix, no-mixed, or mixed then no-mixed tubes, diluted to 1:50 in assay diluent, then subjected to substrate enzyme reactions. The absorbance units showed the impact on different mixing conditions. Data are represented as mean ± standard deviation (SD) from three independent experiments. The difference between mix and no-mixed conditions was found to be statically significant (p < 0.0001) by One-way ANOVA analysis. C Best practice recommendation of bioanalytical samples handling procedure for the bioanalytical testing laboratories. The following steps are recommended to the industry for sample thaw and mix prior to bioanalytical assay execution: Step 1: The bioanalytical samples are subjected to thaw at room temperature for more than 30 min. Step 2: The completely thawed sample tube is inverted three times. Step 3: The tube is vortexed for 10 s, three times to achieve homogeneous mixing state
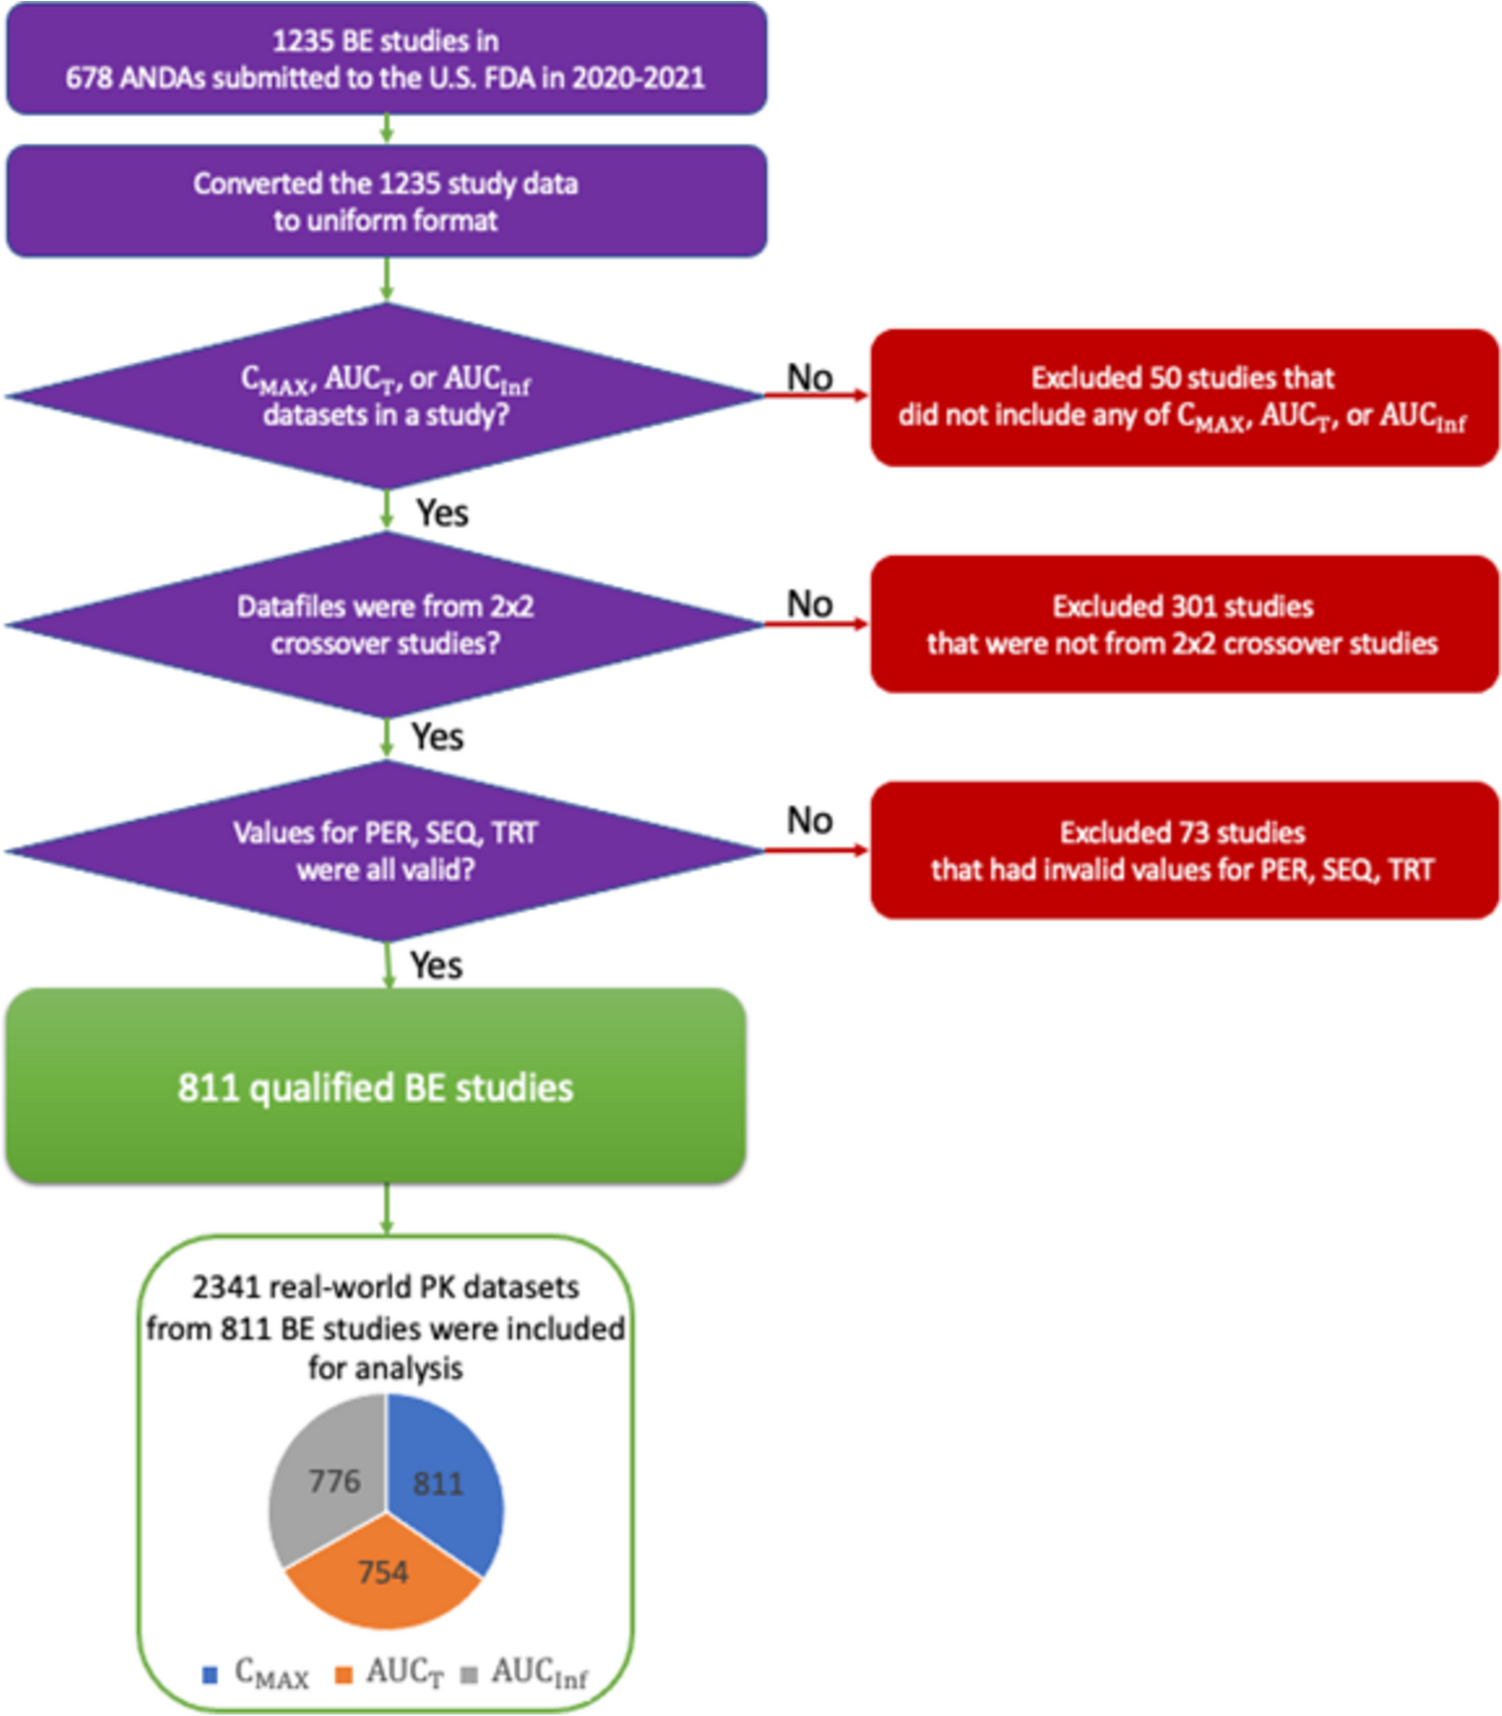
Fig. 2
A Measurement of drug A concentrations in serum samples with different fill levels, thawing and mixing conditions. Control properly filled (1.25 mL) and high filled (2.0 mL) serum samples were thawed 30 min or 15 min at room temperature. Samples were either mixed or not mixed prior to dilution and bioanalytical analysis. Respective tubes were either mixed or not mixed prior to dilution into the assay method. Control serum sample (1.25 mL) thawed for 30 min was included for comparison. The target concentration is 101.5 µg/mL, + 30% dashed line represents 131.95 µg/mL, −30% dashed line represents 71.05 µg/mL. Data are represented as mean ± standard deviation (SD) from three independent experiments. B Measurement of drug B Concentrations from serum samples with different fill levels, thawing and mixing conditions. Control properly filled (1.25 mL) and high filled (2.0 mL) serum samples were thawed 30 min or 15 min at room temperature. Samples were either mixed or not mixed prior to dilution and bioanalytical analysis. Respective tubes were either mixed or not mixed prior to dilution into the assay method. Control serum sample (1.25 mL) thawed for 30 min was included for comparison. The target concentration is 200 µg/mL, + 30% dashed line represents 260 µg/mL, −30% dashed line represents 140 µg/mL. Data are represented as mean ± standard deviation (SD) from three independent experiments
Table I The Measurement of Drug A Concentrations and the recovery from serum samples with different fill levels, thawing and mixing conditions. (n = 3)Table II The Measurement of Drug B Concentrations and the recovery from serum samples with different fill levels, thawing and mixing conditions. (n = 3)Fig. 3
ISR results for drug A (A) and drug B (B) before and after sample re-assay with sample handling corrective actions. Prior to implementing sample handling corrective actions, the percent difference of the ISR concentrations compared to the original measured concentration was more than ± 30.00%. drug A and drug B Original-ISR: 78.2% and 60.0%, respectively. After implementation of sample handling corrective actions, the percent difference of the re-assay ISR concentrations compared to the original concentrations for drug A and drug B were 98.8% and 100%, respectively
Comments (0)