Cell lines and cell culture
Human lung adenocarcinoma cell lines CL1-1 and CL1-5 were kindly provided in 2002 by Professor Pan-Chyr Yang of the National Taiwan University; these cell lines were derivatives of the lung adenocarcinoma cell line CL1-0. CL1-1 and CL1-5 were subpopulations of CL1-0 cells with increasing invasiveness obtained by rounds of Matrigel-coated transwell selection [12] All lung cancer cell lines were maintained in RPMI (Thermo Fisher Scientific Inc., ref no. 31800022) supplemented with 10% fetal bovine serum (FBS). The 293 T human embryonic kidney cell line was maintained in DMEM (Thermo Fisher Scientific Inc., ref no. 12800017) supplemented with 10% FBS. All cells were cultured at 37 °C in a humidified atmosphere with 5% CO2. All culture media were supplemented with penicillin/streptomycin (Corning Inc., product no. 30–002-CI). Cells were not cultured for more than two months. Cells were seeded at 5 × 10⁴ cells/ml and treated with JNK inhibitor SP600125 (Cell Signaling, #8177) at the indicated times.
Patient samples and tissue microarrays
Two cohorts of tissue microarrays (TMA) were used in this study. The tissue microarray was constructed as described previously [13]. Cohort 1 consisted of 398 patients diagnosed with stage I lung adenocarcinoma who underwent tumor resection at the Taipei Veterans General Hospital (VGH-Taipei) between 1995 and 2007. The analysis of Cohort 1 focused on studying the correlation between the expression levels of PrPc and miR-193b-3p. Cohort 2 comprised 199 patients with lung adenocarcinoma at various stages; these patients underwent tumor resection at VGH-Taipei between 2002 and 2006. Cohort 2 was specifically employed to conduct survival analysis. Overall survival (OS) was defined as the period between the surgical resection date and either the date of death or the last follow-up. Disease-free survival (DFS) was defined as the duration between diagnosis and the date of either recurrence or death. Patients whose cause of death was unrelated to their condition or was indeterminable were censored from the analysis. This study was approved by the Ethics Committee of VGH-Taipei, Taiwan.
Immunohistochemistry
Paraffin-embedded 5-μm TMA sections were deparaffinized using xylene and subsequently rehydrated by immersion in decreasing concentrations of ethanol (twice in 100%, once in 90%, and once in 70%). Antigen retrieval was performed by heating sections in 0.1 M citrate, followed by treatment with 3% H2O2 to inhibit endogenous peroxidase activity. The sections were then incubated overnight at 4 °C with primary antibodies: anti-PrPc (1:100, Dako Cytomation) and anti-c-Jun (1:200, Cell Signaling Technology, cat# 9165). Following washing in phosphate-buffered saline (PBS), sections underwent incubation with peroxidase-labeled secondary antibodies for 1 h at room temperature. Subsequent steps included incubation with diaminobenzidine, washing, and counterstaining with hematoxylin. Evaluation of all staining was conducted by pathologists. For PrPc staining, intensity scores were categorized as follows: 0 (no staining), 1 (weakly positive), 2 (moderately positive), and 3 (strongly positive), while the percentage scores were designated as 0 (0%), 1 (≤ 10%), 2 (11–50%), and 3 (51–100%). The overall IHC score for each sample was calculated by multiplying the intensity score with the percentage score, resulting in a scale from 0 to 9. Similarly, c-Jun expression was assessed with scores of 0 (no staining), 1 (weakly positive), 2 (moderately positive), and 3 (strongly positive), and the resulting intensity score was directly multiplied by the observed percentage in the tissue.
RNA oligonucleotides and locked nucleic acid–modified oligonucleotide probes
mirVana™ miRNA Inhibitor anti-miR-193b (Cat# 4464084) and anti-miRNA negative control (Cat# 4464076) oligonucleotides were purchased from Thermo Fisher Scientific Inc. The LNA miRNA scramble control probe (/5DigN/GTGTAACACGTCTATACGCCCA) (product no. 99004-01), positive control probe U6 snRNA (/5DigN/CACGAATTTGCGTGTCATCCTT) (product no. 99002-01) and hsa-miR-193b probe (/5DigN/AGCGGGACTTTGAGGGCCAGTT) (product no. 38611-01) were obtained from Exiqon Inc.
LNA-in situ hybridization
LNA-in situ hybridization performed according to the manufacturer's instructions. Five-micrometer-thin sections of FFPE tissues slides were deparaffinized in xylene three times for 5 min each, followed by 5 min each in serial dilutions of ethanol (100%,100%, 95%, 95%) and three changes of DEPC–treated water. Slides were fixed with 4% paraformaldehyde in DEPC-PBS at room temperature for 20 min, rinsed twice with DEPC-PBS, and then treated with 400 μg/mL proteinase K at 37 °C for 15 min. Post proteinase K digestion, slides were washed twice with DEPC-PBS, three times with fresh DEPC-PBS, and subsequently subjected to hybridization in incubation chambers overnight at 37 °C. The hybridization mixture comprised 40 nM of scramble control, miR-193b, and 1 nM of U6 snRNA LNA probes (sourced from BioChain Inc., cat# K2191050). Following hybridization, slides were washed with 0.2 × SSC buffer containing 2% BSA at 4 °C for 10 min, followed by two washes with 1 × alkaline phosphatase (AP) buffer. An AP-conjugated anti-DIG antibody (BioChain Inc., cat# K2191050) in a 1:200 dilution was applied to the slides and left to incubate overnight at 4 °C. Subsequent to this step, the slides underwent two washes with 1 × DEPC-PBS for 5 min each and two washes with 1 × AP buffer for 5 min each. Finally, the slides were stained by incubating in an NBT/BCIP solution at room temperature for 6 h, followed by counterstaining with nuclear fast red and mounting.
Plasmid construction
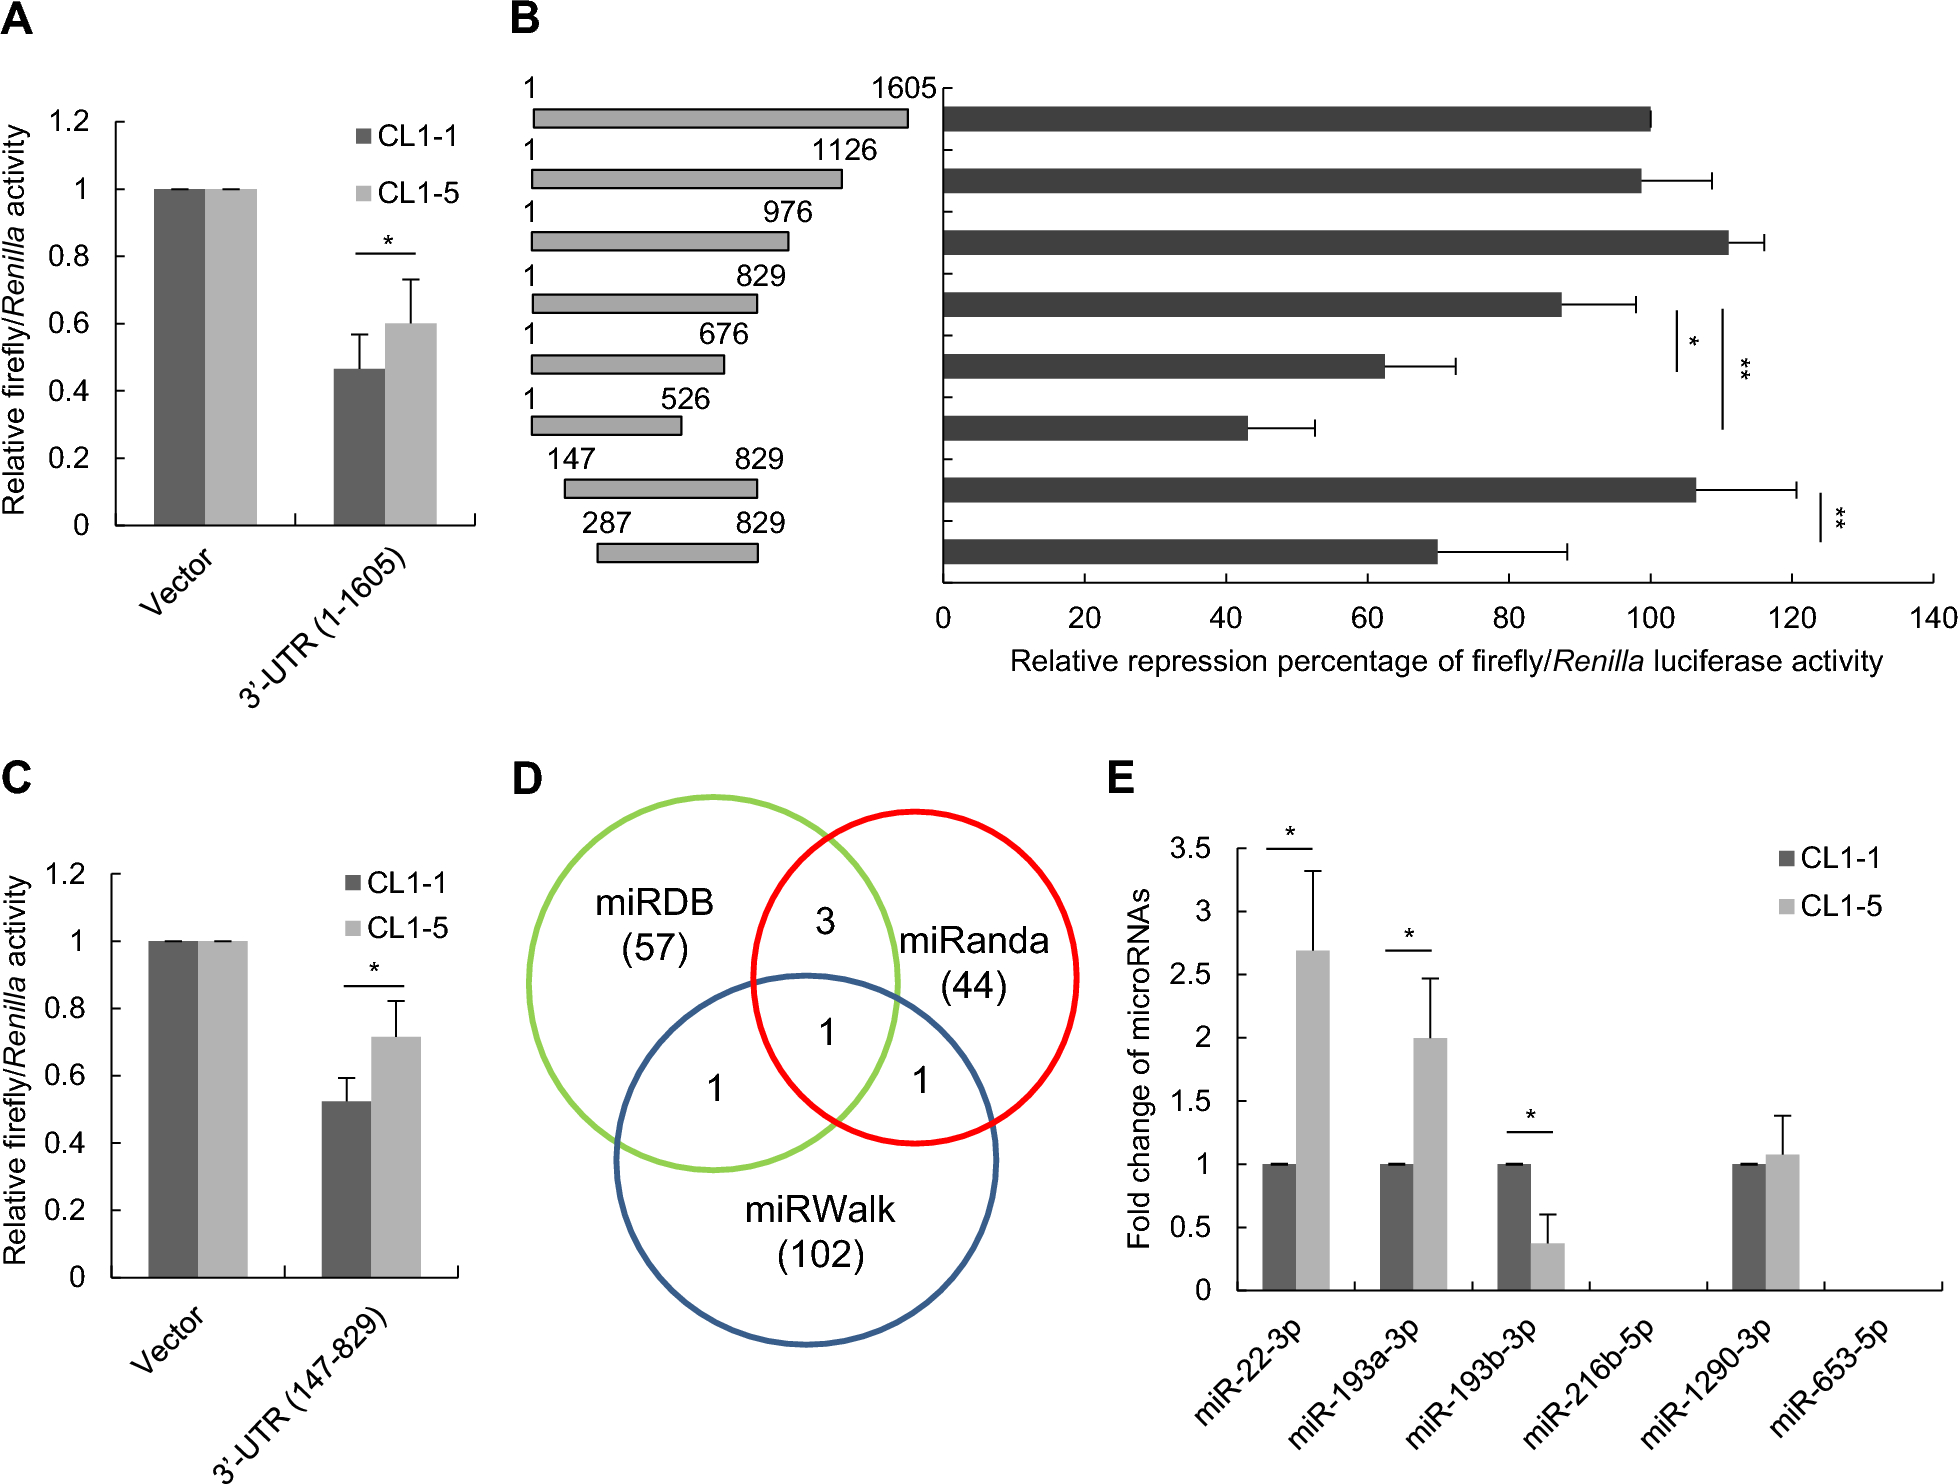
The 3’-UTR of the human PRNP gene and its deletion fragments were amplified from complementary DNA (cDNA) of CL1-5 cells using the specific primers listed in Supplementary Table S1. These PCR amplicons were then cloned into the XbaI site of the pGL3-control vector (Promega). To generate miRNA-expressing plasmids, precursor miRNAs were amplified from CL1-1 genomic DNA with a ~ 250 bp flanking sequence using the designated cloning primer sets mentioned in Supplementary Table S2. The PCR amplicon was then ligated into the pCMV-HA and pLVX-IRES-Neo vectors. To generate pGL3-control with a mutated miR-193b-3p binding site sequence on the 3’-UTR of PRNP, PCR mutagenesis was performed using two overlay primers (5’-ATCATGAGCCGTTGCTAATGCCACCGGTCAAAAAGTATAACAGC-3’ and 5’-TGGCATTAGCAACGGCTCATGATGAACTCAATCAAAGG −3’) with six nucleotide substitutions relative to the wild-type 3’-UTR of PRNP. For miR-193b-3p promoter and its subsequent deletion constructs, genomic DNA extracted from CL1-1 cells were subjected to PCR amplification using the specific primers listed in Supplementary Table S3. The PCR amplicons were then ligated into the pGL3-basic vector. Primers used for the construction of ETS1-, GR-, and c-Jun-expressing plasmids are detailed in Supplementary Table S2.
Quantitative real-time PCR
Total RNA was isolated using the REzolTM C&T reagent (Protech Technology Inc., cat# KP200CT). Complementary DNA (cDNA) was synthesized from 5 μg of total RNA utilizing the RevertAid First Strand cDNA Synthesis Kit (Thermo Fisher Scientific Inc., cat# K1622). Subsequently, equal amounts of cDNA were applied for the analysis of specific gene expression using the SensiFAST™ SYBR® Hi-ROX Kit (BIOLINE Inc., CSA-01068) in accordance with the manufacturer’s instructions. Primer sequences designed for assessing the expression of specific genes are provided in Supplementary Table S4.
Luciferase assay
The 3’-UTR of PRNP, containing the putative miR-193b-3p binding site, and the promoter sequences of miR-193b-3p were amplified and cloned into the pGL3 Firefly Luciferase reporter vector. The pRL-TK Renilla Luciferase reporter vector was used as a normalization control. All reporter vectors were obtained from Promega Corporation (Madison, WI, USA). Mutations in the c-Jun binding sites within the reporter constructs were introduced by oligonucleotide-directed mutagenesis using the QuikChange® kit (Stratagene) and confirmed by sequencing. To evaluate the effects of miRNAs on the 3’-UTR of PRNP, reporter constructs with or without the 3’-UTR of PRNP were co-transfected with plasmids expressing miRNAs. To assess the repressive effect of c-Jun on the miR-193b-3p promoter, reporter constructs with either wild-type or mutant promoter sequences were co-transfected with plasmids expressing c-Jun. Transfections were performed using Lipofectamine LTX with Plus reagent (Thermo Fisher Scientific Inc., Cat. #15338100) according to the manufacturer’s instructions. Luciferase activity was measured 24 h post-transfection using the Luciferase Reporter System (Promega, Cat. #E1501), with Renilla luciferase (Promega, Cat. #E2820) as a control. Firefly luciferase activity was normalized to Renilla luciferase activity.
Primary and mature MiRNA detection
The expression of mature miRNAs was assessed using TaqMan™ MicroRNA Assays (Assay ID: miR-22-3p = 000398; miR-193a-3p = 002250; miR-193b-3p = 002367; miR-216b-5p = 002326; miR-1290-3p = 002863; miR-653-5p = 002292) in accordance with the manufacturer’s instructions (Thermo Fisher Scientific Inc.). Briefly, reverse transcription reactions were performed using stem‒loop RT primers with the TaqMan™ MicroRNA Reverse Transcription Kit (Cat# 4,366,596) in a GeneAmp™ PCR System 9700 (Thermo Fisher Scientific Inc.). Real-time PCR was performed under the following conditions: 95 °C for 10 min, followed by 40 cycles at 95 °C for 15 s and 60 °C for 1 min by using TaqMan™ Universal Master Mix II, no UNG (Cat# 4,440,040). All samples were normalized to the internal control RNU6B. For primary miR-193b detection, equal amounts of cDNA were subjected to TaqMan™ Pri-miRNA Assay (Assay ID = Hs03303897_pri) following the manufacturer’s instructions, and all samples were normalized to the internal control, GAPDH (Assay ID = Hs99999905_m1).
Western blotting
Total proteins were isolated using modified RIPA buffer (50 mM Tris; pH = 7.5, 150 mM NaCl, 0.1% SDS, 1% NP-40, 0.5% sodium deoxycholate) supplement with protease inhibitors (Merck Inc., cat# 04693132001) and/or phosphatase inhibitors (Sigma Inc., SI-P5726 and SI-P0044). Cells were lysed on ice for 30 min and the total lysate were subsequently centrifuged at 12,500 rpm for 10 min at 4 °C. The supernatant was collected, and subjected to protein quantification using Bradford Protein Assay Dye (Bio-Rad., cat# 5,000,006). Equal amounts of protein (50 µg) were subjected to 10% SDS-PAGE and transferred to polyvinylidene difluoride membranes (Pall Corporation). The membranes were then blocked with 5% non-fat milk in TBS at room temperature for 2 h and incubated at 4˚C overnight with primary antibodies, followed by incubation with horseradish peroxidase-conjugated secondary antibodies (GE Healthcare) for 2 h at room temperature. The primary antibodies used in this study were as follows: PrPc (Cayman, cat# 189720), α-tubulin (Sigma, product no. T9026), β-actin (Novus Biologicals, cat# NB600-501), GAPDH (Cell Signaling Technology, cat# 2118), phospho-JNK (Cell Signaling Technology, cat# 4668), total JNK (Cell Signaling Technology, cat# 9252), phospho-c-Jun (Cell Signaling Technology, cat# 9164) and c-Jun (Cell Signaling Technology, cat# 9165). Protein bands were detected by Western Chemiluminescent kit (HyCell biotechnology Inc.).
Lentivirus transduction
Plasmids expressing shRNAs targeting JUN (TRCN0000039589, designated #1, and TRCN0000338165, designated #2) and PRNP (TRCN0000083492) were procured from the National RNAi Core Facility Platform of Academia Sinica, Taiwan. Virus packaging was carried out following previously established procedures [14]. Cells were cultured until reaching 60% confluence, and virus-containing media, supplemented with polybrene (8 μg/mL), were subsequently introduced into the culture medium. After 24 h of transduction, the virus-containing media were aspirated, and cells were subjected to selection with puromycin or hygromycin before being harvested for subsequent experiments.
Chromatin immunoprecipitation (ChIP) assay
ChIP assays were conducted using the Magna ChIP™ A-Chromatin Immunoprecipitation Kit (Millipore, Cat. #17–610), following the manufacturer’s instructions. In brief, CL1-5 cells (5 × 10⁶) were crosslinked with 1% formaldehyde to preserve DNA–protein interactions, then quenched and washed with ice-cold PBS. The chromatin was sheared by sonication at 60 kHz for 30 cycles (30 s on, 30 s off) at 4 °C to generate fragments. Chromatin extracts were diluted tenfold with ChIP IP buffer and immunoprecipitated using an anti-c-Jun [E254] ChIP-grade antibody (Abcam, ab32137) or control IgG antibody (Cell Signaling Technology, #2729). Following immunoprecipitation, DNA fragments bound to the antibody were eluted, treated with proteinase K, and purified via phenol/chloroform extraction. Purified DNA was analyzed by quantitative PCR (qPCR) using primers targeting the predicted c-Jun binding site in the miR-193 promoter region, as listed in Supplementary Table S5.
RNA immunoprecipitation (RIP) assay
RNA immunoprecipitation (RIP) assays were performed using the RIP Assay Kit (Cat. #17–700, Millipore) according to the manufacturer’s protocol. Briefly, CL1-1 cells (5 × 10⁶) were washed with ice-cold PBS and lysed in RIP lysis buffer containing a protease inhibitor cocktail and RNase inhibitor. The lysates were incubated overnight at 4 °C with magnetic beads conjugated to an AGO2-specific antibody (RN003M, MBL International) or control mouse IgG (Cat. #17–700, Millipore) with constant rotation. Following incubation and washing, the immunoprecipitated RNA was isolated by proteinase K treatment and phenol/chloroform extraction. The purified RNA was reverse transcribed, and the target RNAs (miR-193b-3p and PRNP) were assessed by qPCR analysis.
In vitro migration and invasion assay
For the migration assay, Boyden chambers with filter inserts (8 μm pore size, Merck Millipore Ltd.) were positioned in 24-well plates. The lower well of each chamber was filled with medium containing 10% FBS, while approximately 2 × 10⁴ cells in culture medium with 1% FBS were seeded on top of the filter insert. Migration assays were conducted at 37 °C for 6 h. Subsequently, the chambers were fixed with 100% methanol for 20 min, air-dried, and stained with Giemsa (Sigma–Aldrich) for a minimum of 2 h. The invasion assay was performed as the migration assay, with the exception that the polycarbonate membranes were pre-coated with Matrigel (40 μg/100 μL serum-free medium; BD Bioscience, Bedford, MA) at 37 °C for 2 h to form the basement membrane. The invasion assay was conducted at 37 °C for 24 h. Following the assays, the membranes were imaged, and the migrated or invaded cells were quantified.
Cell proliferation assay
Cells were seeded at a density of 1 × 10⁴ cells in 100 µL of culture medium per well into 96-well plates and then incubated for 72 h at 37 °C in a humidified atmosphere containing 5% CO2. Cell viability was assessed using the 3-(4,5-dimethylthiazol-2-yl)−2,5-diphenyltetrazolium bromide (MTT) assay, and the absorbance was measured at 570 nm using a Bio-Rad spectrophotometer (USA). Each experiment was conducted in quadruplicate and repeated at least three times.
In vivo lung tumor model for miR-193b-3p treatment
The experimental procedure was performed as described previously with modifications [15]. Briefly, CL1-5 cells were mixed with Matrigel at a ratio of 1:1 and subcutaneously injected into 6- to 8-week-old NOD-SCID mice. When the tumor grew to 100–200 mm3, 20 μg of miRIDIAN microRNA Mimic Negative Control #1 (CN-001000–01–50) or miRIDIAN microRNA Human has-miR-193b-3p Mimic (C-300764–05–0050) (GE Healthcare Dharmacon, Inc.) were formulated with MaxSuppressor™ in vivo RNALancer II (BIOO Scientific, cat# 3410–01) following the manufacturer’s instructions, and formulated miRNA was intratumorally injected on days 1, 4 and 7. Tumor volume was evaluated every day by a caliper and was determined by the formula: V = 0.5 × a x b2, where a and b are the longest and the shortest diameter of the tumor, respectively.
Statistical analysis
The data were analyzed using SPSS 22.0 (IBM Corp., Armonk, NY, USA) and Prism 7.0 (GraphPad, San Diego, CA, USA). Quantitative data are expressed as median (range) and were compared between groups using Student's t-test. Spearman rank correlation coefficient was used to evaluate the correlation between PrPc and miR-193b-3p, as well as between PrPc and c-Jun expression. Survival was analyzed using the Kaplan–Meier method and log-rank test. All statistical tests were two-sided, and p < 0.05 was considered statistically significant.


Comments (0)