
Remember me
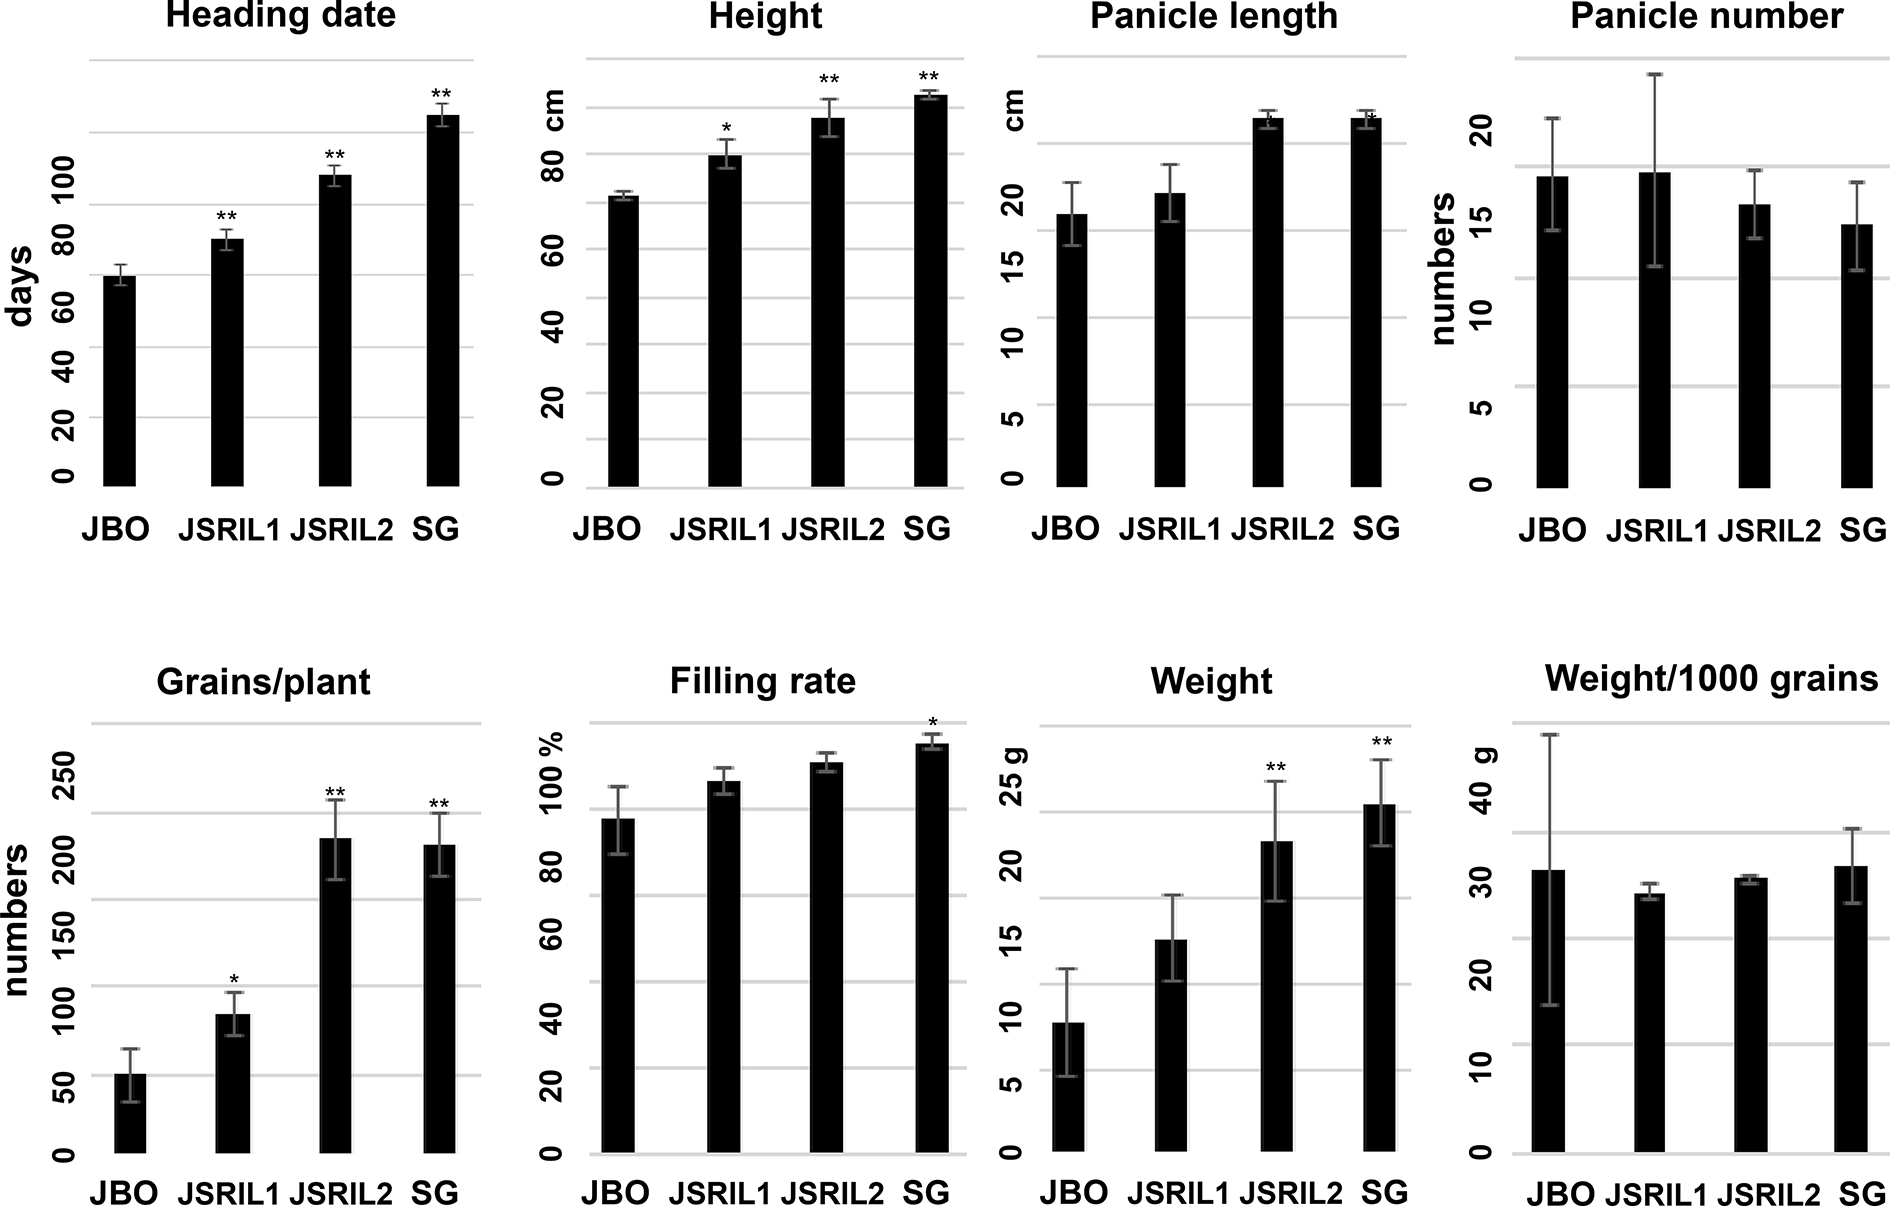
To determine how genetic variation affects heading time in cultivated rice, JBO and SG were selected as the female and male parental lines, respectively. JBO has a heading date of Jul. 4 or 57 days after sowing (DAS) in Jeonju, Korea, whereas SG has a heading date of Aug. 17 or 101 DAS under natural field conditions (Fig. S1). Approximately 400 RILs were generated from these parents. The RILs have currently produced more than 8 generations, and traits related to panicle development and other yield factors have been documented (Fig. 1). The RILs have various heading times, ranging from Jul. 1 to Aug. 25. We selected 2 representative RILs: the characteristics of JSRIL1 are more similar to those of JBO, including the heading date, and it flowers around Jul. 14 or 67 DAS, whereas the characteristics of JSRIL2 are more similar to those of SG, and it flowers around Aug. 1 or 85 DAS. A one-tailed t test revealed that all the p values were less than 0.01, suggesting that the differences in heading days were significant. JBO, JSRIL1, and JSRIL2 flowered 44, 34 and 16 days earlier, respectively, than did the SG line under natural paddy field conditions (Fig. S1).
Fig. 1
Heading date and yield factors, such as height, panicle length, panicle number, number of grains per plant, filling rate, weight and weight/1000 grains per panicle. Heading dates are given for 15–20 plants, and other factors are given for 3–5 plants of JBO, JSRIL1, JSRIL2, and SG. A one-tailed t test was performed. **p values < 0.01 and *p values < 0.05 indicate significant differences.
Other yield factors, such as the height, panicle length, panicle number, grain number/plant, filling rate, total weight, and weight/1000 grains, were also measured (Fig. 1). Except for the panicle number and weight/1000 grains, the other yield factors are proportional to the heading date, suggesting that heading date could be a key factor among parental types and JSRILs. This finding confirms that heading days are important for guaranteeing sufficient vegetative growth and a proper filling period (40–45 days) after heading in paddy fields as winter approaches (Izawa 2007; Cho et al. 2017).
SNPs are unequally distributed among chromosomes in the parental lines and RILsGenomic DNA was prepared as described in the Methods section and sequenced on the Illumina HiSeq 4000 platform (Illumina.com) via a proprietary reversible terminator-based method. Approximately 14 Gb (40× genome size) of sequencing data were obtained from the wild-type parents and 2 JSRILs (Table S1). The reference genome assembly (IRGSP-1.0_genome, RefN) of rice, O. sativa spp. japonica cv. Nipponbare, was downloaded from the Rice Annotation Project (RAP) database (http://rapdb.lab.nig.ac.jp). To add to the SNP analysis, the sequences of two representative cultivars with short life cycles, O. sativa spp. japonica cv. Kitaake, Aus cv. Kasalath, and Indica cv. HR-12, were downloaded from the NCBI SRA (https://www.ncbi.nlm.nih.gov/sra/). In addition, another Nipponbare sequence (Nipponbare1, SRR1043564) was downloaded to determine the number of spontaneous SNPs.
Sequencing reads were mapped to RefN, and variant calling was performed and deposited at a shared database (https://figshare.com/). The local realignment of reads around insertions/deletions (indels) was analyzed as described in the Methods. Sequence variations and their effects were analyzed with SnpEff 4.3i (https://pcingola.github.io/SnpEff/). In total, 19,930 insertions (Ins) and 21,874 deletions (Dels) were detected. The number of 0/1 SNPs in the studied lines ranged from 10,000–26,000, with JSRIL2 having the highest number of SNPs at 25,954. The numbers of 1/1 SNPs in parental types JBO and SG were 29,994 and 27,314, respectively, whereas those in JSRIL1 and 2 were 23,605 and 21,255, respectively, suggesting that the parental types have unique SNPs that differed during breeding processes. In total, 667,607 SNPs were detected (Table S2).
Overall, the SNPs covered the entire chromosome, with an average of one SNP per 560 bp (Fig. 2 and Table S3). However, the number of SNPs varied among the chromosomes. Chr1 had the most SNPs, with 79,522, whereas Chr9 contained the fewest SNPs, with 38,367. In terms of the SNP rate, Chr4 presented 1 SNP per 649 bp, whereas Chr10 presented 1 SNP per 492 bp (Table S3). SNPs were classified according to whether they occurred in genic or intergenic regions, and the number of SNPs was analyzed via sequence ontology (SO) to assess sequence changes and impacts. Most variations were found in intergenic (47.8%) and upstream (14.9%) regions, whereas fewer (1.9%) were found in downstream regions. In genic regions, SNPs and indels were found in exons (6.8%) and introns, including splice sites (8.3%). However, the number of SNPs per 10 kb was highest in exons, at 79.0 SNPs/10 kb, followed by the downstream 300-bp region, at 47.3 SNPs/10 kb (data not shown). Introns and the upstream 2-kb regions presented similar rates, ranging from approximately 31.1 to 36.5 SNPs/10 kb. The rate in genic regions was much higher than that in intergenic regions, at 11.5 SNPs/10 kb. These data suggest that the SNPs in genic regions are exploited more often during crossing based on phenotypic observations.
Fig. 2
Number of SNPs per 10 kb on chromosomes. SNPs are unequally distributed along chromosomes among the parental lines and RILs. In total, 667,607 SNPs were detected differently among the chromosomes. Chr1 had the most SNPs, with 79,522, whereas Chr9 contained 38,367 SNPs. In addition, Chr4 presented 1 SNP per 649 bp, whereas Chr10 presented 1 SNP per 492 bp
Parental genotypes contributed unevenly to JSRILs across chromosomesTo determine the evolutionary relationships, a phylogenetic tree was generated with SNPhylo (Fig. 3). The phylogenetic tree revealed that SG was located closer to Nipponbare than to the JSRILs. JBO was more distant from the other lines and was part of the same clade as Kitaake was, suggesting that its genetic background is unique. Kasalath and Indica were outgrouped as expected.
Fig. 3
A phylogenetic tree of JBO, SG, their RILs, Nipponbare, Kasalath, Kitaake, and IndicaHR12 was generated with SNPhylo (Lee et al. 2014). A vcf file containing 667,607 SNPs was used. These findings indicate that the SG is closer to Nipponbare1 than the RILs are. Compared with the others, JBO is phylogenetically farther, suggesting that its genetic background is quite unique. Correlation information was generated in Newick format from SNPhylo and transformed into a network, and circular tree diagrams were generated via the Molecular Evolutionary Genetics Analysis program with the toggle scale option (MEGA XI; Tamura et al. 2021)
To delineate how the genetic components of the parental types, JBO and SG, contributed to those of the JSRILs, the SNP genotypes were converted to ABH genotypes for JBO (Parent A, A), SG (Parent B, B), and the heterozygous genotype (H). The parental contribution for each chromosome varied between the JSRILs. The JSRIL1 genomic makeup was 46.4% from JBO and 43.1% from SG, making maternal JBO the main contributor, whereas the JSRIL2 genomic makeup was 42.4% from JBO and 46.6% from SG (Table 1). These results reflect the physical and heading date characteristics of the JSRILs compared with those of the parental types (Fig. 1). Interestingly, the contribution rates of the parents to the individual chromosomes (Chrs) in the JSRILs widely varied (Table 1 and Fig. 4). In JSRIL1, largely equal parental contributions were found in Chrs 2, 4, 10, and 11; in contrast, Chrs 1, 3, 5, 6, 7, 8, 9, 11, and 12 had preferential contributions from one of the parental types. Specifically, Chrs 3, 7, 8 and 12 are primarily from the maternal JBO line, whereas Chrs 1, 5, 7, 9, and 11 are primarily from the paternal SG line. Interestingly, very similar preferential chromosome contributions were found in JSRIL2, although Chr7 contained a much greater contribution from SG (92.8%) than that in JSRIL1 (60.5%). In terms of the heterozygous genotypes, Chr8 and Chr11 had higher rates of heterozygosity in JSRIL2 than in JSRIL1. These results suggest that chromosome recombination occurs such that parental genotypes contribute unevenly across chromosomes, resulting in phenotypic differences between the RILs. In addition, chromosomal mixing occurs, but shuffling occurs on a larger scale of up to several dozen megabases, as observed in many genetic studies. These chromosomal biases may also occur because RILs are selected based on heading date.
Table 1 Parental contributions to JSRIL1 and JSRIL2Fig. 4
Graphical representations of ABH genotypes of RILs. Genotypes are shown in blue (JBO), orange (SG), and green (heterozygous) depending on the parental genotype. The parental contribution for each chromosome ranged from 42–46% among the JSRILs. However, the contribution rates of the parents to the chromosomes (Chrs) among the JSRILs widely varied. Almost equal contributions were found for Chrs 2, 4, 10, and 11 of JSRIL1. In contrast, the maternal JB contributions were greater for Chrs 3, 7, 8 and 12, whereas the paternal SG contributions were greater for Chrs 1, 5, 7, 9, and 11. Among the heterozygous genotypes, Chr8 and Chr11 presented higher rates of heterozygosity in JSRIL2 than in JSRIL1
The chromosomal contributions suggest that Nipponbare, Kitaake, Kasalath and Indica share contributions with JBO and SG, suggesting that these lines share an origin and were selected during breeding processes (Fig. 4). The phylogenetic analysis was expanded to include KRICE_CORE (Kim et al. 2016) generated from whole-genome resequencing of the 137 rice lines in the mini core collection (Fig. S2). These lines include domestically adapted weedy and landrace rice and bred lines, as well as lines from Africa, Europe, and America. JBO and SG belong to clades with Jejubukjeju-2002–340 and Gou 405 in the KRICE_CORE collection, respectively. SG is closely positioned to Nipponbare1 and RefN (IRGSP-1.0_genome), suggesting that it is not very different from varieties such as Gou 405, Iri336 and Suwon 301. Kasalath and Kitaake belong to the clades of BELLARDONE and PUKHI, respectively, and are more closely related to the clade that includes Indica HR12. The distances in clade positions of JBO, JSRIL1 and JSRIL2 from SG suggest that multiple recombination and introgression events in the chromosomal regions occurred among the rice cultivar groups and that parental JBO and SG genes were generated from those of their original ancestors.
Genic regions of heading-related genes in RILs are delineated by SNPsHeading is one of the main agronomic traits associated with many yield factors, as shown in Fig. 1. We examined how parental alleles contribute to RIL heading. Seventy genes have been reported to be involved in determining heading day in rice (Cho et al. 2017; Zhou et al. 2021). The SNPs in the parental lines and JSRILs were searched along with those of the Kasalath, Kitaake and Indica cultivars (Table S4 and Fig. S3). The variation in SNPs around many known flower-inducing genes was minimal. Among the 71 genes reported by Zhou et al. (2021), 63 genes, such as OsGI, Ghd7, Ehd1, Days to heading on chromosome 2 (DTH2), DTH3, Ehd2, Ehd3, and RFT1, presented no SNPs in JBO, SG, or the JSRILs.
In JSRIL1 and JSRIL2, 5 genes, Hd1, Hd3a, SDG711, OsVIL2, and OsCRY1b, were inherited from the female parent JBO. Compared with other representative early-flowering cultivars (Table S4), Hd1 and SDG711 presented the highest similarity to Kasalath, whereas OsVIL2, OsRR1, and OsCRY1b presented the highest similarity to Kitaake; Hd3a originated from an unidentified source that is likely to be Nipponbare. In contrast, OsFKF1 and OsSET33 were derived from the male parent SG, and these genes were similar to those of Nipponbare, Kasalath, or Kitaake. Interestingly, JSRIL1 carried the paternal OsHESO1 gene, whereas JSRIL2 carried a maternal copy of this gene.
As shown below, allele combinations appeared to be associated with the heading date of JSRILs. Thus, the early heading of JSRIL1 and JSRIL2 might be due to the effects of the photoperiodic genes Hd1, Hd3a, SDG711, OsVIL2, and OsCRY1b from the maternal JBO line and heading may be delayed by OsFKF1 and OsSET33 from the paternal SG line (Fig. S3 and Table S4).
Gene expression profiling by RNA-seqTo evaluate genome-wide gene expression in floral transition stages, total RNA was extracted from the JBO, JSRIL1, JSRIL2 and SG lines at approximately 10 a.m. on June 23 (46 DAS), July 6 (59 DAS), July 13 (66 DAS), and July 20 (73 DAS), respectively, approximately 20–40 days before heading. Given that many photoperiodic genes are diurnal, samples were also collected at midnight on June 22 (45 DASN). In a previous report, the expression of florigens such as Hd3a and RFT1 in LD flowering lines such as Norin 8 and Dongjin reportedly increased 30–35 days (70 DAS) before heading, whereas the expression of MADS-box transcription factor 14 (OsMADS14) and OsMADS15, which are downstream of Hd3a and RFT1, increased in the inflorescence meristem starting in the primary panicle branch generation stage (Komiya et al. 2008, 2009). RNA from the SG line collected on May 22 (20 DAS) was extracted as a reference for RNA-seq. RNA-seq was performed as described in the Methods section. All the transcript values were increased by 1 to avoid NA error in the program (Table S5). According to the RAP database (http://rapdb.lab.nig.ac.jp), 53,075 transcripts, including 8056 predicted transcripts, were annotated in the genome. More than 31,347 to 34,855 ts were counted at least once, and their median counts ranged from 59.7 to 77.3. Interestingly, the number of counts from midnight (45 DASN) ranged from 109.8 to 114.2 and was higher than the number of daytime counts by approximately 40, suggesting that the expression of many genes was modulated at night. Compared with SG at 20 DAS, 24,688 ts were modulated according to the criteria of twofold up- or downregulation, with adjusted p values less than 0.05 and counts greater than 30 (Fig. S4). Approximately 18,000 to 22,000 ts were not counted at all during the time window.
The enrichment of gene ontology (GO) terms associated with up- or downregulated transcripts was examined as described in the Methods section. At midnight at 45 DAS (45 DASN), the downregulated and upregulated genes were enriched in photosynthesis, light harvesting in photosystem I (GO:0009768) and response to very low light intensity stimulus (GO:0055122), respectively, as expected (Fig. 5 and Table S6). At 46 DAS, the upregulated genes were enriched in red, far-red light phototransduction (GO:0009585), the cellular response to UV-A (GO:0071492) and photomorphogenesis (GO:0009640), whereas the downregulated genes were enriched in floral organ structural organization (GO:0048450). At 59 DAS, the upregulated genes were enriched in recognition of pollen (GO:0048544), detection of visible light (GO:0009584), secondary growth (GO:0080117), and multicellular organism growth (GO:0035264), whereas the downregulated genes were enriched in photoperiodism (GO:0009648) and cold acclimation (GO:0009631). At 66 DAS, the upregulated genes were enriched in the terms “cellular response to high light intensity” (GO:0071486), “cellular response to UV-A” (GO:0071492), “anther dehiscence” (GO:0009901), and “auxin biosynthetic process” (GO:0009851), whereas the downregulated genes were enriched in “pyridine nucleotide catabolic process” (GO:0019364), “ADP catabolic process” (GO:0046032), “photoperiodism” (GO:0009648), “internode patterning” (GO:0080006), and “regulation of root meristem growth” (GO:0010082). At 73 DAS, the upregulated genes were enriched in recognition of pollen (GO:0048544), protein maturation by protein folding (GO:0022417) and regulation of floral meristem growth (GO:0010080), whereas the downregulated genes were enriched in circadian rhythm (GO:0007623), negative regulation of red or far-red light signaling pathway (GO:0090229) and regulation of root meristem growth (GO:0010082). Overall, GO terms such as photoperiodism, cold acclimation, floral organ structural organization, and anther dehiscence were enriched, suggesting that many genes related to floral development are modulated by up- or downregulation compared with vegetative growth in the late-flowering SG at 20 DAS.
Fig. 5
Enriched GO terms. Gene Ontology (GO) enrichment analysis of the genes was performed as described in the Methods section. D: The enriched terms for downregulated genes are underlined, and the genes are color coded in green. U: The enriched terms for upregulated genes are shown, and the genes are color coded in red. The adjusted P values for the GO enrichment analysis are scaled from 0 to − 5 or − 5 for the up- and downregulated genes, respectively (scaled enrichment)
The expression of florigens such as Hd3and RFT1, and MADS14 is roughly proportional to the heading days of parental lines and RILsThe expression patterns of Hd3a in JBO, JSRIL1, and JSRIL2 on each day were compared with those in SG at 20 DAS, as described in the Methods section (Fig. 6). SG is a middle- to late-maturation rice cultivar that experiences heading at approximately 101 DAS. At 46 DAS, the expression of Hd3a increased 3.4-, 2.1-, and 1.4-fold in JBO, JSRIL1, and JSRIL2, respectively, compared with that in SG, suggesting that florigen expression was triggered in JBO and JSRIL1 at that time. This difference was significant according to Dunnett’s test, as described in the Methods section. JBO showed the greatest increase of 24-fold at 66 DAS, followed by a 15.6-fold increase at 73 DAS. In JSRIL1, Hd3a expression was maintained at approximately 2.1-fold higher levels than that in SG up to 66 DAS, reached 3.1-fold higher levels at 73 DAS, and then stabilized. In JSRIL2, heading occurred 18 days later than that in JSRIL1, and Hd3a levels were maintained until 59 DAS; however, Hd3a increased 7.8- and 11.1-fold at 66 and 73 DAS, respectively. These values are much greater than those of JSRIL1, suggesting that other factors might be involved in flower induction. However, Hd3a expression in SG was undetectable until 73 DAS and remained weak. These data suggest that Hd3a is a major floral activator that plays a central role in regulating heading time under NLC and is the main florigen under SD conditions (Komiya et al. 2008).
Fig. 6
qRT‒PCR analysis of florigens and OsMADS14 at 46, 59, 66 and 73 DAS. JBO is a japonica rice cultivar with a heading date of Jul. 4 or 57 days after sowing (DAS) in Jeonju, Korea (35.83 N 127.05 E). JSRIL1 has more characteristics similar to those of JBO in terms of the heading date and flowers around Jul. 14, or 66 DAS, and JSRIL2 flowers around Aug. 1 or 85 DAS. SG is a japonica rice cultivar whose heading date is Aug. 17 or 101 DAS under natural field conditions (Fig. S1). These days are also referenced at 101 days of the SG as days to heading (DTH) and dates. Fifteen to twenty plants were observed for heading in the paddy fields. Dunnett’s test was performed to determine the significance of the differences, with the result for SG at the same DAS used as a control. The Dunnett’s test p values are as follows: 0; ‘***’, 0.001; ‘**’, 0.01; and ‘*’, 0.05
RFT1, the closest homolog to Hd3a, increased 21.66-, 13.21-, 18.04-, and 0.20-fold in JBO, JSRIL1, JSRIL2, and SG, respectively, at 46 DAS, suggesting that floral meristems are initiated in JBO and RILs (Fig. 6); these expression levels increased 298.9-, 34.9-, and 97.0-fold at 59 DAS and 126.2-, 111.2- and 72.0-fold at 66 DAS, respectively. The expression was maximal at 66 DAS and 59 DAS for JSRIL1 and JSRIL2, respectively. In SG, RFT1 expression increased 34.4-fold at 66 DAS, suggesting that floral transition had begun. During this period, the induction of RFT1 was tenfold greater than that of Hd3a, suggesting that RFT1 might be a main florigen under NLC, as previously reported for LD conditions (Komiya et al. 2009).
Hd3a interacts with a 14-3-3 protein in the cytoplasm of the apical cells of shoots, translocates to the nucleus and binds the bZIP transcription factor FD to form the florigen activation complex (FAC) (Tsuji et al. 2013). This complex regulates the expression of the APETALA1 (AP1)/FRUITFULL (FUL)-like genes MADS14, MADS15, and MADS18. MADS14 appears to coordinate to specify the identity of an inflorescence meristem downstream of the florigen signal. MADS14 expression increased 13.94-, 0.41-, 1.61-, and 0.1-fold at 46 DAS in JBO, JSRIL1, JSRIL2, and SG, respectively, suggesting that the floral meristem in JBO was already initiated (Fig. 6). The expression levels were 122.58-, 29.17-, 23.05-, and 0.18-fold greater at 59 DAS in JBO, JSRIL1, JSRIL2, and SG, respectively, suggesting that floral meristems were initiated in JSRILs. MADS14 expression in JBO reached the greatest increase of 301-fold and 289-fold at 66 DAS and 73 DAS, respectively. The expression of MADS14 in JSRIL2, JSRIL1, and SG increased continuously until 73 DAS (July 20), increasing by 261-fold, 188-fold, and 32-fold, respectively. Because Hd3a and RFT1 expression was increased in JBO, JSRIL1 and JSRIL2 but RFT1 expression was increased in SG, these plants were under LD conditions. This induction time frame and expression level explain the parental types and JSRILs.
Gene expression of photoperiodic genes with no SNPs among JSRILsAs described above, SNP analysis of photoperiodic genes in the RILs (Fig. S3 and Table S4) revealed that the genes containing no SNPs (63 genes), such as OsGI, Ghd7 and Ehd1, were not different among the lines, but the expression levels were consistent with heading days in the neutral, suppression and activation modes. The genes in the maternal JBO group (5 genes), namely, Hd1, Hd3a, OsVIL2, SDG711, and OsCRY1b, might be involved in accelerating heading, whereas the genes in the paternal SG group (2 genes), namely, SDG723 and OsFKF1, might be involved in delayed heading among RILs. The biased gene, OsHESO1, is reversed, with JSRIL1 and JSRIL2 containing the paternal and maternal genes for the heading day, respectively.
These data suggest that the induction of Hd3a, RFT1 and MADS14 in JBO and RILs has already been initiated at approximately 46 DAS (Fig. 6). We tested the expression of photoperiodic genes at midnight at 45 DAS (MN) and 10 am at 46 DAS (late morning [LM]) in these lines. Among the 63 genes without SNPs, OsGI, Ghd7, Ehd1, and DTH2 were chosen for qRT‒PCR (Fig. 7A). In Arabidopsis, GI is a flowering time-related gene that is strongly involved in its circadian clock system (Fowler et al. 1999). In contrast, the rice osgi-1 mutation extended the time to heading only under SD conditions, whereas under LD conditions, osgi-1 mutant plants presented no severe phenotypic changes, but the gene seemed to orchestrate the circadian clock and diurnal rhythms of the global transcriptome, including the genes involved in primary metabolism under natural day–night cycles in rice (Itoh et al. 2010; Izawa et al. 2011). The expression of the gene was marginal at MN in all the lines, as expected. In contrast, under LM, gene expression increased by 3.71-, 2.68-, 4.32-, and 4.06-fold in JBO, JSRIL1, JSRIL2, and SG, respectively, suggesting that the expression of OsGI is circadian rhythm-dependent and diurnal.
Fig. 7
qRT‒PCR analysis of JSRIL and parental genotypes at midnight at 45 DAS (MN) and late morning at 46 DAS (LM). Given that the gene expression of many photoperiodicity genes is diurnal, total RNA was prepared at the indicated times. Among the 71 genes reported by Zhou et al. 63 genes had no SNPs among the parental types and JSRILs. Only 4 genes were tested: OsGI, Ghd7, Ehd1, and DTH2 (A); JSRIL1 and JSRIL2 have maternal JBO genes, such as Hd1, OsVIL2, SDG711, and OsCRY1b (B); and OsFKF1 and OsSET33 are from the paternal SG line (C). The parent-dependent OsHESO1 gene was from the paternal line in JSRIL1 and the maternal line in JSRIL2 (D). These groups were classified on the basis of SNP analysis (Table S4 and Fig. S3). Dunnett’s test was performed to determine the significance of the differences, with the results for SG at the same DAS at MN and LM used as controls. Night and day are scaled according to June 23rd in Jeonju, Korea (35.83 N, 127.05 E). The Dunnett’s test p values are as follows: 0; ‘***’, 0.001; ‘**’, 0.01; and ‘*’, 0.05
The increased expression of Ghd7 under LD conditions delays heading (Xue et al. 2008). Ghd7, combined with Ehd1, also sets a critical day length for Hd3a florigen expression in rice (Itoh et al. 2010). Its expression was marginal in these lines at MN, whereas its expression in LM was 1.5-fold greater in JBO and JSRIL1 (Fig. 7A). In contrast, the expression of Ghd7 was increased by 3.51- and 4.16-fold in JSRIL2 and SG, respectively. This difference between those of JB and JSRIL1 and those of JSRIL2 and SG in LM was significant according to Dunnett’s test, as described in the Methods section. These data suggest that the inhibitory effects of Ghd7 on photoperiod signaling are strong and might explain the delayed heading of JSRIL1 and JSRIL2 by 10 and 28 days, respectively, compared with that of JBO.
The Ehd1 gene promotes heading under LD conditions and may act independently of a functional allele of Hd1 (Doi et al. 2004). At MN, its expression was increased approximately 98.0-fold in JBO and JSRIL1, whereas it was increased 15.0-fold in JSRIL2 and SG, suggesting that Ehd1 is involved in early heading (Fig. 7A). Interestingly, in LM, the expression of Ehd1 in JBO and JSRIL2 was maintained at 10.85 and 13.4, respectively, whereas it was almost completely absent in JSRIL1 and SG. The induction of Ehd1 in JBO and JSRIL1 and that of Ghd7 in JSRIL2 and SG clearly indicated that inducer and suppressor expression correlated with the heading date in these lines. However, it is unclear whether these differences are due to genetic differences or temporal differences during these periods.
Recent studies have suggested that DTH2 might be necessary for the expression of Hd3a and RFT1, but the Hd1 and Ehd1 pathways are independent of florigen genes in rice under LD conditions, suggesting the existence of a more finely tuned photoperiod-sensing mechanism (Wu et al. 2013). DTH2 was expressed at high levels in the lines: 50.5–74.2-fold higher at MN (Fig. 7A) and 25.5–35.1-fold higher in LM. DTH3 was increased 2.8–3.3-fold at MN and 0.9–1.9-fold in LM, but its expression was mixed (data not shown). These data suggest that the expression of these genes is diurnal and remains to be elucidated.
Genes originating from the maternal line in JSRILs are the main contributors to early headingHd1, Hd3a, OsVIL2, SDG711, and OsCRY1b in JSRILs originated from the maternal JBO line (Fig. S3 and Table S4). Hd1 in JSRIL1 and JSRIL2 originated from JBO and was more similar to that of Kasalath (recessive hd1), and its expression was marginal over time. Under LD conditions, functional Hd1 acts as an inhibitor (Lin et al. 2000; Yano et al. 2000). At MN, Hd1 expression was increased 12.3-fold, whereas hd1 expression in JBO and JSRILs was decreased 3–fourfold (Fig. 7B). This finding was significant according to Dunnett’s test. In addition, the expression of this gene in LM throughout the study period was greater (data not shown) than that of other genes, which appeared to cause the late heading of SGs, whereas hd1 expression in JBO, JSRIL1 and JSRIL2 may explain the early heading in these lines.
The expression of OsVIL2, a chromatin remodeling factor, was greater in JBO and the RILs at MN (Fig. 7B). OsVIL2 expression in JBO and JSRIL was 3.1–4.2-fold greater than that in SG, and this difference was significant according to Dunnett’s test. This increased expression of OsVIL2 apparently induced heading via the repression of downstream genes. Among the JSRILs, OsVIL2 was from the maternal JBO line and was the same as that of Nipponbare (Table S4). The paternal SG OsVIL2 is the same as that of Kasalath. In this study, OsVIL2 of JSRIL1 and JSRIL2 originated from the maternal JBO line. In an extended comparison, OsVIL2 was closest to the sequences of Nipponbare and Kitaake, suggesting that these key genes originated from different sources of hd1.
In JSRILs, SDG711, a key PRC2 subunit that is required for H3K27me3, is derived from the maternal JBO line and is the same as that of Kasalath. Its expression in JBO in LM was twofold greater than that in the control. However, the expression in JSRILs was marginal and could not be induced at 46 DAS. These observations suggest that SDG711 functions as an activator under NLCs.
The OsCRY1b gene is involved in the response to blue light and inhibits coleoptile growth (Hirose et al. 2006). At MN, the expression of OsCRY1b ranged from 2.8 to 4.9, with the highest expression in SG, whereas in LM, its expression was similar among the lines, which suggests that OsCRY1b functions as a suppressor under NLC.
Genes originating from the paternal line may be involved in delaying the early heading of JSRILsAt MN, the expression of OsFKF1 was marginal in all lines, whereas in LM, its expression in JBO and JSRIL1 increased 23.0–24.1-fold, whereas that in JSRIL2 and SG increased 28.7–31.9-fold (Fig. 7C), suggesting that its expression is strongly diurnal and roughly similar to that of OsGI, which is consistent with previous observations of the OsFKF1-OsGI interaction (Han et al. 2015). This interaction might regulate the blue-light-mediated activation of Ehd1 through physical interaction with OsCDF1/OsDOF12.
OsSET33 and OsFKF1 in JSRIL2 originated from the paternal SG line (Fig. S3 and Table S4). At MN, the expression of OsSET33 in JBO was 1.2, whereas that in the other lines ranged from 0.5 to − 0.8; in LM, its expression was at the basal level in all lines (Fig. 7C), suggesting that OsSET33 functions as an activator.
OsHESO1 is reversed in terms of heading days in JSRILsOsHESO1 has been implicated in photoperiod regulation through posttranscriptional processing of miRNAs and siRNAs (Yano et al. 2016). In our study, JSRIL1 had the paternal SG B type, whereas JSRIL2 had the maternal A type (Fig. S3). At MN and LM, the expression of OsHESO1 increased approximately 1.5–2.0-fold and was similar in expression among the lines (Fig. 7D). Interestingly, the expression of JSRILs at MN was significantly lower than that in the parental types, and this difference was significant according to Dunnett’s test. However, how this gene is involved in controlling photoperiod-related genes remains unclear, and the gene may work with other factor(s) to induce a consistent delay in heading.
Comments (0)