
Remember me
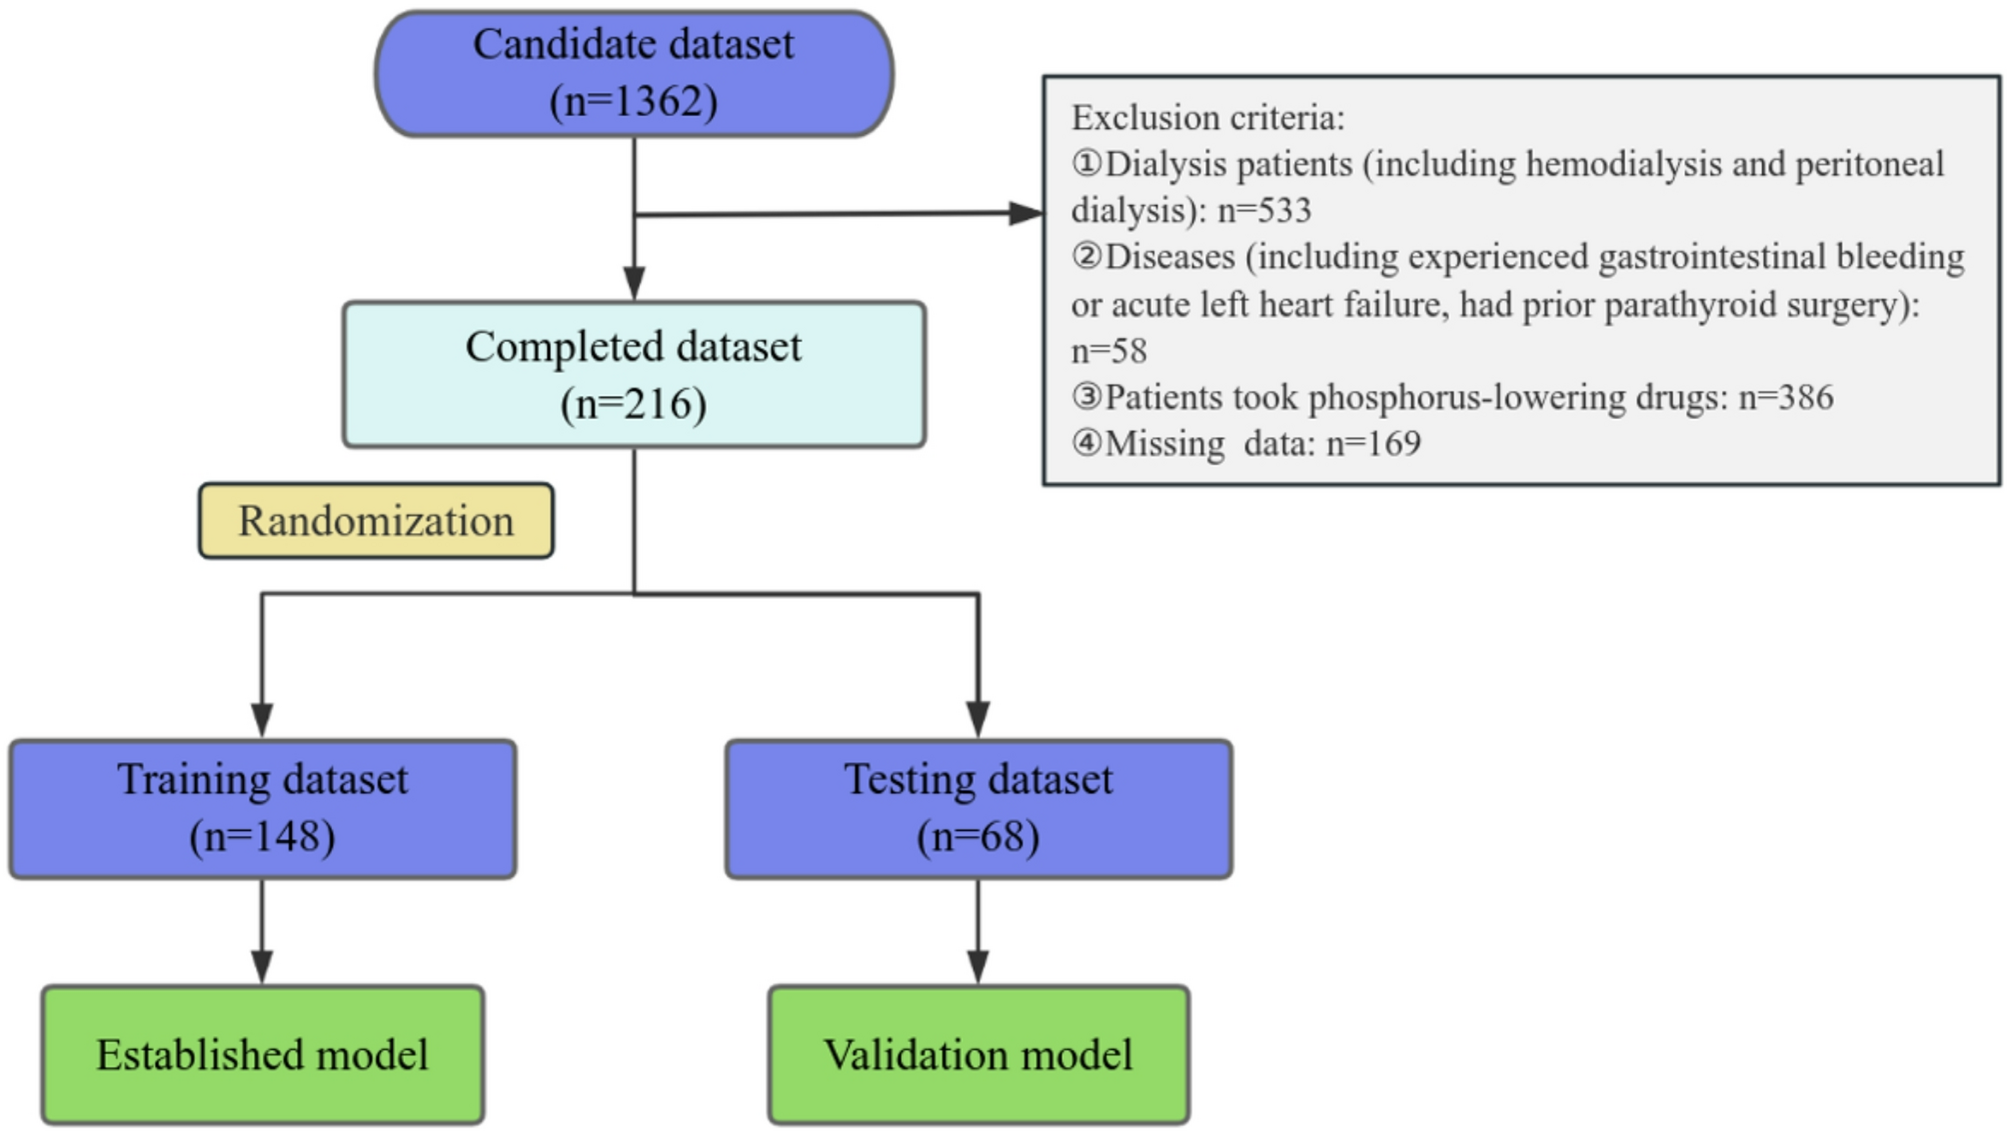


Of the 586 participants recruited to the SHAREHD trial, 552 in-centre HD patients from the twelve participating renal centres provided data during the baseline phase, excluding 34 participants with no data on the studied questionnaires. 1725 YHS questionnaires were provided at four times points (552 at baseline, 429 at six months, 412 at twelve and 332 at 18 months) (Fig. 1).
Fig. 1
Flow diagram of participants and questionnaires at four time points
Baseline demographic data of the participants at baseline was described in Table 1. The majority of the participants were male and white, with a mean age of 63 and 5 years on haemodialysis on average at baseline. About one third of the participants had diabetes and quarter had vascular disease. A comprehensive symptom severity sum score ranging from 0 to 68 was calculated for all 17 symptoms at baseline. This score was then divided into three groups based on its distribution. Patient baseline characteristics were subsequently stratified according to their overall symptom severity sum scores, with the groups being: < 13, 13–24, and > 24 (Additional file 2). Participants with highest total symptom severity score were slightly younger and more comorbid (Additional file 2). However, clinical characteristics did not differ significantly between participants who completed instruments at four timepoints and those who completed only one instrument (Additional file 3). Missing items of each symptom at 4 time points were reported as detailed in Additional file 4.
Table 1 Participants’ demographic data at baselineSymptom prevalence at four timepointsOverall symptom prevalence at baseline, six, 12 and 18 months is reported in Fig. 2. Each symptom prevalence ranged from the highest prevalence of 80.4% to the lowest of 21.6% at baseline (Fig. 2). On average, participants reported the presence of approximately nine different symptoms (mean 8.9 ± 4.1) at baseline. The most prevalent symptoms at baseline were weakness (80.4%), poor mobility (67.6%), drowsiness (65.4%), difficulty in sleeping (64.6%) and itching (63.1%) (Additional file 5). Among the symptoms reported ‘moderate or worse severity’ at baseline, weakness is the most prevalent, impacting 58.1%, followed by poor mobility at 48.6%, difficult sleeping at 45.0%, and pain at 39.7%. In contrast, less common symptoms at a moderate or worse level include nausea (17.5%), constipation (17.6%), diarrhoea (12.0%), and vomiting (11.4%) as detailed in Additional file 6. The mean number of symptoms reported were similar across time points (mean 8.9 ± 4.1 at baseline, 8.8 ± 4 at six months, 8.7 ± 4 at 12 months and 8.9 ± 4.2 at 18 months).
Fig. 2
Symptom Prevalence at four timepoints (all severity group from none to overwhelming at baseline). The observations from four time points (baseline, six,12 and 18 months) were used to inform this figure
Symptoms trajectory in respondents reporting moderate or worse at baselineAcross all 17 symptoms with moderate or worse symptom severity at baseline, the adjusted multi-level mixed effects ordered probit regression estimated that the majority of the change in population of symptom prevalence occurred in the ‘severe’ category: The prevalence of each symptom generally improved, with reduction in prevalence of the severe category over 18 months while the moderate category remained stable and mild/none prevalence increased (Fig. 3) (Additional files 7 and 8).
Fig. 3
Change in symptoms prevalence over 18 months in people with moderately affected or worse at baseline. This figure was stratified by (A) symptoms with ≦20% change and (B) > 20% change in the prevalence in those reporting severe degree. Additional files 7 and 8 support this figure
Eleven symptoms were observed to have a ≤ 20% reduction in the prevalence of the severe category over 18 months indicating more stable symptoms: difficulty sleeping (8.4%), weakness (9.8%), poor mobility (10.0%), depression (11.2%), feeling anxious (12.2%), shortness of breath (15%), drowsiness (15.5%), restless legs (16.6%), poor mobility (16.9%), skin changes (17.3%) and pain (17.3%) (Fig. 3 Panel A) (Additional file 7). The lowest reduction in prevalence (8.4%) was observed in difficulty sleeping (42.1% at baseline, 33.70% at 18 months) whereas the highest change was observed in skin changes and pain (29.5% at baseline, 12.2% at 18 months and 40.7% at baseline, 23.3% at 18 months) (Additional file 7). In order to detect within individual changes, the proportion of people changing their symptom score every six months period in this group was estimated (Fig. 4) (Additional file 9) (Additional file 10 as an example of one symptom). Despite a ≦20% change in the prevalence of severe category for these symptoms, only 20–45% of those reporting severe remained at this level at the next six-monthly questionnaires. This large degree of within-person movement was relatively balanced at a population level by movement in and out of the severe category (Fig. 4) (Additional file 9). For example: only 38.2% of those who reported ‘severe’ degree in feeling anxious at baseline (timepoint zero) remained in the same ‘severe’ degree at six months (timepoint one) with 61.8% moving out of ‘severe’ degree into other categories and while 62.0% of those reporting other categories at baseline had moved into this ‘severe’ category at six months (timepoint one), resulting in 0.2% change in symptom proportions over six months (Additional file 9). Therefore, although there was a large degree of patient movement in and out of ‘severe’ category over six months period, change in proportion of symptom prevalence was minimal. Other examples include depression, skin changes and drowsiness, which had frequent but balanced movement (75%-80%) in and out of severe category over 6 months, leading to a relatively static the prevalence of those with severe symptoms (Additional file 9).
Fig. 4
Proportions of people with moderate or worse severity at baseline moving in and out of severe group over 6 months
Meanwhile, symptoms with absolute improvements in prevalence of more than 20% were observed in sore mouth (20.3%), pruritus (21.5%), diarrhoea (23.6%), constipation (24.1%), vomiting (30.1%) and nausea (39.5%) (Fig. 3 Panel B) (Additional file 7). Fewer respondents (22–28%) remained in the severe category at any one time over six months period and larger prevalence change was driven by a 9 to 18% difference between the proportion of people moving out of severe compared to those moving into this category (Fig. 4) (Additional file 9). For example: only 25% of those who reported ‘severe’ degree of diarrhoea at baseline (timepoint zero) remained in the same ‘severe’ degree at six months (timepoint one) and 75% moved out into other degrees at six months, while 57% of those who reported ‘severe’ at the six months had moved into this category from other severities at baseline resulting in 18% difference in symptom proportion at six months period (Additional file 9). All symptoms had more than 50% of people in the severe group change their severity over 6 months (Additional file 9).
Sensitivity analysisEstimating prevalence on all 17 symptoms with all degrees of severity (from none to overwhelming) at baseline showed little change in symptoms over 18 months period (Additional file 11 showed feeling anxious as an example). In order to test the hypothesis that participants with none or mild symptoms at baseline may not change their symptoms over time, blunting the longitudinal changes in this model, probit regression estimating the trajectory of participants with none or mild symptoms at baseline showed small reduction in none and mild prevalence but moderate or worse remained static over 18 months (Additional file 12).
Comments (0)