
Remember me
To investigate the cell type-specific molecular mechanisms of ADHD drugs in the brain at single-cell resolution, we conducted behavioral experiments and scRNASEQ in wild-type (WT) adult male Drosophila melanogaster following exposure to MPH, ATX, and control treatment. Here, we chose WT flies to identify comprehensive drug responsive genes rather than using the existing models of ADHD-like behavior in fruit flies [25,26,27,28] or rodents [17], which usually knockout or knockdown certain ADHD-related genes. Only WT male flies that displayed hyperactivity-like behavior (significantly higher locomotor activity) after drug treatment in comparison with the control were selected for sequencing. Subsequently, we dissected and dissociated whole brains under three different conditions, captured the phenotypes after drug administration, and subjected single cells to 10X Genomics scRNASEQ. An overview of the workflow of the drug-exposed scRNASEQ study in adult Drosophila brain is shown in Fig. 1. MPH and ATX are commonly used drugs to treat ADHD symptoms in humans [3]. In the modified capillary feeder (CAFE) assay [45], WT male flies were exposed to MPH, ATX, and control treatment for 24 h (Fig. 1A). After selecting a dose according to the literature [10], the drugs were tested at four or five different doses (for ATX: 0.25 mg mL-1, 0.5 mg mL-1, 1 mg mL-1, and 2 mg mL-1; for MPH: 0.25 mg mL-1, 0.5 mg mL-1, 1 mg mL-1, 1.5 mg mL-1, and 2 mg mL-1) to find the inflection point of the dose-response curves. The results show that 0.25 mg mL-1 ATX (Supplementary Fig. 1A) and 1.5 mg mL-1 MPH (Supplementary Fig. 1B) had the strongest effect; therefore, these concentrations were chosen for subsequent experiments. A single adult fruit fly was placed in each arena after drug exposure (a total of 24 flies per treatment, and 72 flies overall) and its behavior was recorded (Fig. 1B). Two distinct replications were carried out on July 12th (replicate 1) and August 10th (replicate 2) 2021. The locomotor activities of fruit flies were simultaneously tracked using EasyFlyTracker and the short-term distances were quantitated. Only 60 out of the 72 flies (20 flies per treatment) were used for subsequent behavioral calculations and experiments. We found that WT male flies produced hyperactivity-like behavior (higher locomotor activity) following exposure to MPH or ATX in comparison with the controls, as shown in Fig. 1C. Additionally, we observed a significant increase (Fig. 1C ①) in the average distance traveled per fly in a 10-min time period in MPH-exposed (Kruskal–Wallis test with Bonferroni correction: P = 1.463E-03) or ATX-exposed (Kruskal–Wallis test with Bonferroni correction: P = 3.766E-03) flies, which is consistent with previously published results [10, 26]. Moreover, the line plot of the average distance traveled by each fly at each time point during the 2.5-h recording period also shows markedly higher-level activities in drug-exposed groups as compared with control flies (Fig. 1C ②). Furthermore, EasyFlyTracker created angle-change plots (Supplementary Fig. 1C) and heatmaps (Supplementary Fig. 1D) of the different treatments to display more details of the behavioral activities of the fruit flies. We found a positive correlation (Pearson r of distances and angles in all groups: 0.6979, P = 6.71E-263) between the pattern of angle-change activities and locomotor activities in both the drug-exposed and control groups, as shown by the scatter plot in Supplementary Fig. 1C.
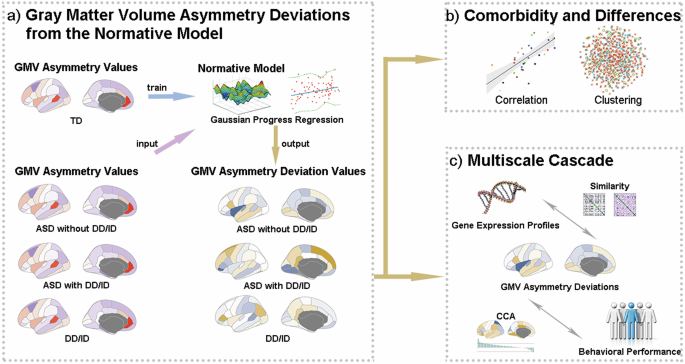
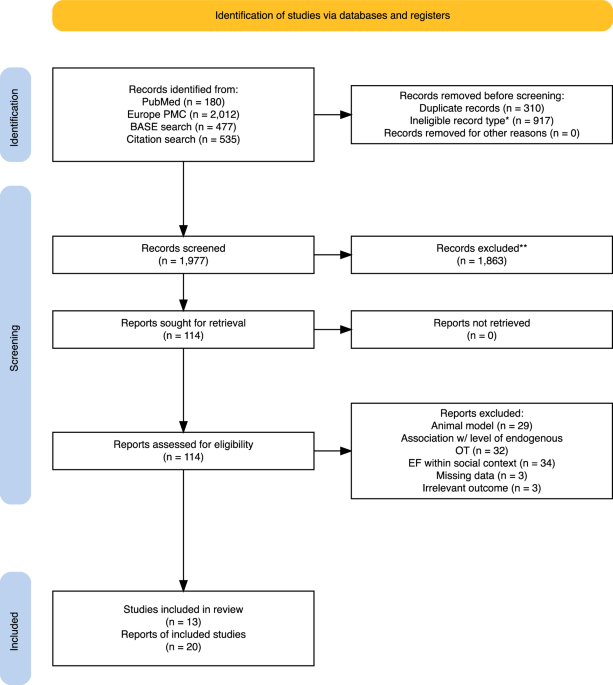
Fig. 1: Workflow of the psychotropic drug-exposed scRNASEQ study in adult Drosophila brain.
The workflow of our drug-exposed scRNASEQ study contains two parts. The first part (shown in subfigure A–C) is to conduct a behavioral activity assay in wild-type flies using methylphenidate (MPH) and atomoxetine (ATX) to generate hyperactivity-like behavior, which is video recorded and subsequently used to analyze locomotor activity. The second part (shown in subfigure D–F) is to conduct single-cell RNA sequencing and data analysis, which aims to reveal the effects of the aforementioned drugs at single-cell resolution. A Wild-type flies were fed with different drugs (ATX, MPH, or control) using a modified capillary feeder assay (CAFE). B The locomotor activity of each fly was recorded by camera under different conditions, and each batch was recorded for 2.5 h. Two experiments were performed separately on July 12th (replicate 1) and August 10th 2021 (replicate 2). C Analysis of the video recordings. EasyFlyTracker tracked and calculated the locomotor activity of different treatments. There are two main metrics used to calculate the locomotor activity: ① the average distance traveled per fly in a 10-min time period (2 replications); and ② the average distance traveled by each fly in a 10-min time period at each time point during the entire video. Both were significantly (** 0.001\( < \) P \(\le\)0.01) increased in the MPH-treated or ATX-treated groups as compared with the control group throughout the 2.5-h video. D A total of 20 male fly brains were collected and dissociated to generate single-cell suspensions for each sample. Each replicate contained three samples exposed to MPH, ATX, or control treatment. E After cell dissociation, counts larger than 500 live cells/μL were used to prepare 10X Genomic sequencing libraries. F Analysis of scRNASEQ data for all samples contains three different parts: ① clustering and cell type identification; ② differential gene expression analysis and drug-exposed cell type identification; and potential gene analysis for drug repurposing.
scRNASEQ identified 28 distinct primary clusters in adult male Drosophila brainWe dissected the brains from WT male fruit flies in the MPH-treated, ATX-treated, and control groups following the observation of significant hyperactivity-like behavior in comparison with the controls (Fig. 1D). A total of 60 male flies were dissected for one behavioral test (20 brains per treatment). Subsequently, three independent samples from each batch were processed for single-cell isolation and the mRNAs were barcoded and sequenced (Fig. 1E). We analyzed the sequencing data at different levels, as shown in Fig. 1F. Since the number of recovered cells was greater than expected, DoubletFinder [46] was used to predict and remove doublets. Details of the number of cells and other statistics are summarized in Supplementary Table 1. A total of 82,917 cells were retained for subsequent analysis. We primarily identified 28 distinct clusters at low resolution (0.1; 15 PCA), annotated the clusters based on previous understanding of canonical markers and the top 10 marker genes in each cluster, and were able to clearly distinguish between neurons and glial cells. These marker genes are summarized in Supplementary Table 2, and the preliminary visualization of the cell type annotation is shown in Fig. 2A. At first, neurons and glial cells were roughly regarded as two main types according to the classical marker genes elav and repo, and then detailed cell types were annotated according to Supplementary Table 2, including monoaminergic neurons (Monoamines), mushroom body Kenyon cells (MBKCs), ellipsoid body cells (EB), optic lobe cells (OL), projection neurons (PNs), unannotated clusters that cannot be identified according to the primary classification (Clusters A–H), and glial cells (Glia). It is well known that mushroom bodies, which contain three subclasses of neurons, \(\alpha \beta ,^ }^ },}}}}}\,\gamma\), are essential for olfactory learning and memory. Using the well-known markers ey and Dop1R2, in addition to the other top 10 marker genes listed in Supplementary Table 2, we were able to directly distinguish between two different MBKC types. As shown in Fig. 2A, only a small fraction of cells expressed the known marker gene Vesicular Monoamine Transporter (Vmat), which were independently marked as monoaminergic neuronal cells. No obvious sub-clusters of Monoamines (C20) were found according to known marker genes corresponding to each of these neurons releasing 5-HT, tyramine (TA), octopamine (OA), and DA in Drosophila (details can be found in the Methods); thus, we regarded Monoamines (C20) as our research target representing dopaminergic neurons. Certain clusters related to the hypothesis or mechanism of drugs were fully considered and analyzed. The number of differentially expressed (drug-responsive) genes between the treatment and control groups was calculated for each primary cell type.
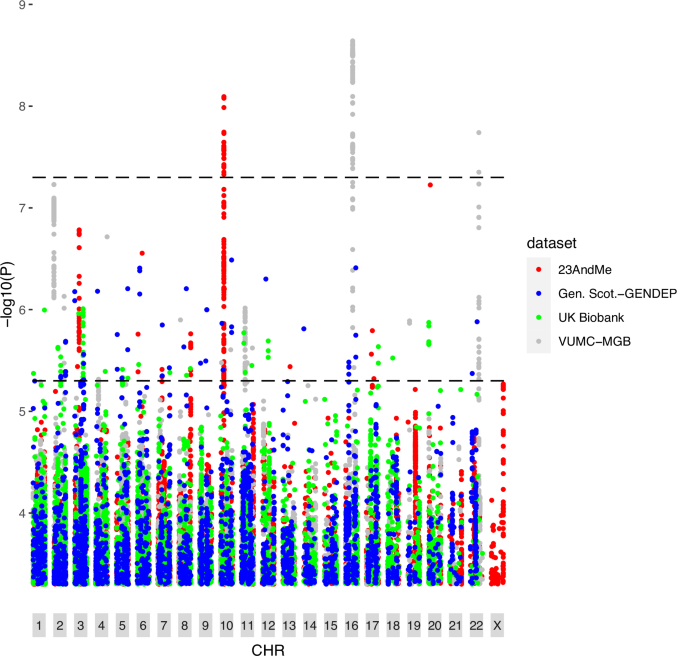
Fig. 2: Cell atlas of adult Drosophila brain and the biological pathways responsive to MPH and ATX.
A UMAP clustering and visualization of scRNASEQ data. Cells were clustered based on their expression pattern using the unsupervised shared nearest neighbor (SNN) clustering algorithm. Individual dots represent a single cell, and the color of the dot represents the cluster to which the cell belongs. Identification of cell types from clusters (shown in the right panel) was performed by canonical marker and top gene annotation from the literature. Clusters were classified based on function. B Venn diagram showing the numbers of total, unique, and shared DEGs (logfc.threshold = 0.25 & Bonferroni-adjusted P \(\le\) 0.05) following MPH and ATX treatment. C Shared pathways of the common DEGs between MPH and ATX treatment. D Statistics for the number of DEGs in each cluster following MPH and ATX treatment. E Pathway analysis of selected neuronal clusters (C14, C18, and C20) by Metascape. Color bar represents the -log(q-value) of the pathway calculated using Metascape.
The general effects of MPH and ATX in neurons and glial cellsAfter careful annotation of the cell types, we used Seurat’s default parameters (logfc.threshold = 0.25 and Bonferroni-adjusted P \(\le\) 0.05) to identify DEGs. We identified many drug-responsive DEGs across all clusters: 694 for MPH and 248 for ATX, with 230 genes shared between the two groups as shown by the Venn diagram (Fig. 2B). Previous studies have shown that both drugs greatly enhance the cognitive function and symptoms of ADHD, which raises the possibility that they share overlapping mechanisms of action [4, 47,48,49]. Thus, the biological pathways of the 230 genes shared between MPH and ATX were analyzed, and the top 20 pathways are displayed in Fig. 2C. These top common pathways include those that modify chemical synaptic transmission, the Ca2+ pathway, the negative regulation of synaptic transmission, ion transport, the neuronal system, adult behavior, and the regulation of cell–cell communication. The full set of results can be found in Supplementary Table 3. These pathways are mainly associated with the regulation of neurotransmitters, which is in agreement with the general hypothesis of ADHD as a neurotransmitter disorder.
More specifically, a wider range of cell type responses was identified for the stimulant MPH in comparison with the non-stimulant ATX after analysis of DEGs in individual cell types (Fig. 2D). Exposure to MPH and ATX induced widespread changes in gene expression throughout the brain, with a stronger effect associated with MPH. The widespread “neurotransmitter imbalance” hypothesis was evaluated by focusing on the Monoamine (C20) cluster that explicitly expresses Vmat. Additionally, the top three clusters containing the greatest number of DEGs were Cluster E (C14), Glia (C7), and MBKC_b (C18), respectively. We performed pathway analysis of the neuronal cell types C20, C14, and C18 to identify cell type-specific signals, as shown in Fig. 2E (C7 was introduced later in “Subdivision of glial cells and their essential role in MPH and ATX effects”). The full plot of the biological pathways is shown in Supplementary Fig. 2. We found that the cell type-specific enrichment pathways are mostly implicated in MPH effects. For instance, C20 shows a limited number of enrichment pathways concentrated in MPH, with none in ATX. Moreover, these cell types perform different functions in the MPH-treated and ATX-treated groups, sharing only a limited number of pathways in Drosophila brain. For example, these cells only share two pathways (negative regulation of cell communication and courtship behavior) in C18, and the rest are related to MPH. C18 is the second-highest cluster, which is a subtype of MBKC and essential for olfactory learning and memory. MBKC forms numerous synapses with DA neurons, and recent results have highlighted the importance of DA-driven plasticity and activity in feedback and feedforward connections between various elements of the mushroom body neural networks [50]. Although we do not yet have the exact cell type mapping between Drosophila and humans, the different responses to MPH and ATX in Drosophila brain cell types further support the diversity of drug responses and the importance of precise treatment.
Neurotransmitter-related gene expression pattern in adult Drosophila brain at single-cell resolutionPrior knowledge demonstrates that the different neurotransmitter hypotheses are essential to the pharmacological treatment of psychiatric diseases [51,52,53,54]. Here, neurotransmitters can be analyzed at both the cell type and DEG level at single-cell resolution. We firstly assessed the proportion and distribution of cells expressing genes responsible for the release or synthesis of different neurotransmitters in Drosophila brain, which provides valuable information to fully understand the mechanisms induced by the two drugs. We classified cells as glutamatergic, cholinergic, GABAergic, and monoaminergic neurons based on the expression of key genes, vesicular glutamate transporter (VGlut) of Glu, vesicular acetylcholine transporter (VAChT) of ACh, Glutamic acid decarboxylase 1 (Gad1) of GABA, or vesicular monoamine transporter (Vmat) of monoamines, and repo of glial cells were classified as other type. These cells are plotted in different colors in Fig. 3A, and the aforementioned names of the primary cell types are also labeled to elaborate. Fortunately, we did not observe any detectable expression of neurotransmitter markers in glia, as shown in the heatmap in Fig. 3B. Cholinergic neurons were found to be the most abundant in the control samples, being expressed in 55.45% of all cells; however, glutamatergic, GABAergic, and monoaminergic neurons were expressed in only 17.44%, 7.09%, and 0.42% of cells, respectively (Fig. 3C). Since recent research in Drosophila revealed a list of co-expressed neuroactive substances [32, 33], we also looked at the possibility of co-existing neurotransmitters in the adult male brain. As shown in Fig. 3C, cells expressing these neurotransmitter-specific marker genes were mainly exclusive, despite the presence of 5.70% VAChT and VGlut indicators and 3.19% VAChT and Gad1 markers. Some cells simultaneously release both excitatory and inhibitory neurotransmitters. This phenomenon shows that co-expression of excitatory and inhibitory neurotransmitters also occurs in the adult male Drosophila brain, which is consistent with scRNASEQ data for larval brain [32] and midbrain [33]. The percentage of cells expressing the markers for Glu, GABA, or all three or four neurotransmitters was very low (<1%) (Fig. 3C), despite the possibility that these markers represent multiple cells. Analyzing the distribution and proportion of these neurotransmitters can aid our understanding of the cellular and molecular processes related to ADHD drugs.
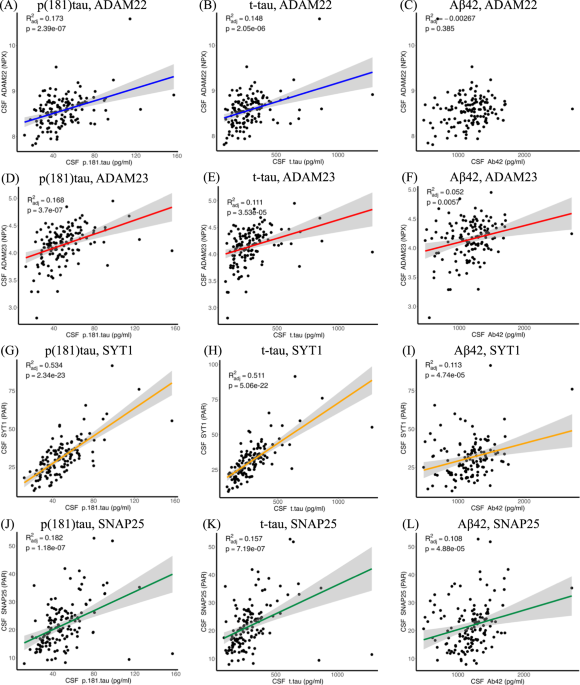
Fig. 3: Proportion and distribution analysis of neurotransmitters in adult Drosophila brain.
Control samples from two replicates were combined with drug-treated samples to analyze the proportion and distribution of neurotransmitters. A DimPlot of Seurat based on UMAP displaying the distribution of cell types from the primary classification. Cells were classified based on the expression of the marker genes of neurotransmitters and are shown in different colors. B Simplified heatmap showing one glial and four neurotransmitter populations. Displayed genes are the main markers analyzed to identify neuronal and glial cell identities. The horizontal axis represents individual cells; each line corresponds to one cell. Gene expression levels are coded by color intensity. C UpSet plot [152] illustrating the co-expression of neurotransmitters in neuronal cells. Light and bold numbers represent the number and percentage of cells, respectively. The effects of MPH and ATX treatment were considered based on the integrated samples. D Proportion of different neurotransmitters in neuronal cells following treatment with MPH (yellow), control (gray), and ATX (blue). The Fisher Exact probability test was used to detect significant differences between the drug groups and the control group by R v4.1.0 (prop.test()), the parameters of which were as follows: alternative = “two.sided”, conf.level = 0.95, correct = TRUE. Significant changes are marked with an asterisk (*). E Radar plot showing the average number of DEGs (DEGs/cluster numbers) in the different groups following MPH (yellow) and ATX (blue) treatment.
Even though the pathophysiology of ADHD remains largely unknown, the neurotransmitter imbalance hypothesis has been continuously described; thus, cell type proportions of the “neurotransmitter levels” induced by MPH and ATX treatment were quantitated according to the expression levels of key genes. As shown in Fig. 3D, the proportions of cell types induced by drug treatment changed only slightly, indicating that the significant effects (marked with *) on GABAergic and monoaminergic neurons only affected the gene expression level of a small number of cells. Specifically, we found that monoaminergic neurons only changed significantly following MPH treatment (Fisher Exact probability test: P = 2.89E-02), GABAergic neurons changed significantly following both MPH (Fisher Exact probability test: P = 2.13E-03) and ATX (Fisher Exact probability test: P = 5.30E-06) treatment, while changes in other neurons (cholinergic and glutamatergic) were non-significant. These may be drug-induced changes in the expression of certain genes or a result of the “neurotransmitter switch”. Neurotransmitter switching, the gain of one transmitter and the loss of another in the same neuron, can be driven by natural stimuli, drugs, and other programs used to manage neurological and psychiatric disorders that also affect neurotransmitter states and thus alter behavior, which has been observed in previous studies [55]. Our results provide the possibility for further research to reveal the manner by which psychotropic drugs alter key gene expression and neurotransmitter switching in certain cells in the brain. Moreover, trends (although non-significant) in excitatory glutamatergic neurons increased following both MPH and ATX treatment in comparison with the control; however, excitatory cholinergic neurons decreased and inhibitory GABAergic neurons changed in different directions following MPH and ATX treatment. The imbalance between excitation and inhibition is associated with ADHD-like symptoms and drug-induced mechanisms. A previous study has shown that these imbalances may contribute to the development of ADHD-like phenotypes in a mouse model [56]. Moreover, the distinct direction of change following MPH and ATX treatment indicates that the underlying molecular mechanisms are different. Indeed, gene set association analysis in humans has revealed that Glu, and possibly also GABA, are associated with ADHD and ASD, although the direction of the effects remains undetermined [57]. Next, we evaluated the difference in expression levels of neurotransmitter marker genes (VAChT, VGlut, Gad1, Vmat, and repo) between the drug treatment and control groups and found that Gad1 was significantly expressed following treatment with both drugs (Wilcox test of MPH: p_val_adj = 5.47E-41, Wilcox test of ATX: p_val_adj = 3.28E-51), which is the common candidate gene for both drugs. Additionally, we visualized the patterns following treatment with MPH and ATX by counting the normalized DEGs in the five groups of cells using a radar plot, as shown in Fig. 3E. We discovered similar neurotransmitter expression levels but different expression intensity of the normalized DEGs between the MPH-treated and ATX-treated groups for most cell classes, with the exception of monoaminergic neurons in which ATX treatment induced a lower number of DEGs in comparison with MPH. However, cell type groups such as cholinergic, glutamatergic, and GABAergic neurons, and even glial cells, showed similar expression preferences. These results support the notion that MPH is a much broader neurotransmitter inhibitor. Taken together, monoaminergic neurons react to both MPH and ATX treatment in distinct ways; for example, in the same direction but with different intensity.
In summary, both MPH and ATX treatment affects different neurotransmitter neurons, producing a slight change in cell type proportions. Since the chance of changes in cell type proportions is small, it is more likely that drug treatments have a significant effect on gene expression in a small proportion of cells, resulting in gene expression changes or neurotransmitter switching. Moreover, common effects of drug treatment were observed. At the cellular level, the proportion of different neurotransmitters in cholinergic and glutamatergic cells following treatment with MPH and ATX were not significantly different, while both displayed significant changes in GABAergic cells. At the gene level, responsive genes such as Gad1 deserve further investigation.
Dopamine metabolism and signaling respond to MPH and ATXAs mentioned previously, neurotransmitters are thought to be critical in the field of ADHD research, especially monoaminergic neurons. Catecholamines (DA, NE), 5-HT, and GABA display dysfunction or deficit in ADHD [58,59,60,61]. Most drug treatments for ADHD, such as MPH [5] and ATX [6], aim to regulate inter-synaptic neurotransmitter levels. The enhanced efflux of DA and NE associated with MPH or ATX exposure leads to increased availability for binding to their respective transporters (such as the DAT and NET) and receptors, as evidenced by existing studies [12, 62,63,64,65]. Here, we aim to summarize the drug responses of DA and NE, by using OA in Drosophila to replace NE, which is the invertebrate homolog of mammalian NE and plays important roles in modulating behavior and synaptic functions [22, 23]. DA metabolism and signaling is discussed in this section, and the results for OA are shown in the subsequent section.
DA signaling is regulated by enzyme degradation and transporter reuptake, and the recycled metabolites can be reused to synthesize DA (Fig. 4A). These steps can occur in different cell types, such as DA-releasing cells, postsynaptic neurons, and glial cells [66]; therefore, we used our scRNASEQ data to determine which cell types expressed components of the DA recycling and metabolic pathways. The first step of DA synthesis, conversion of tyrosine into the DA precursor L-DOPA catalyzed by the ple-encoded Tyrosine hydroxylase, appears to primarily occur in Monoamines (C20) as compared with other cell clusters (Fig. 4B). In comparison, Ddc, which converts L-DOPA to DA, is present in several other neuronal populations, including OLs, PNs, and other non-specific clusters (Fig. 4B). It is unclear whether Ddc present in these neurons is involved in the metabolism of DA and other aromatic L-amino acids; however, these two genes were not significantly differentially expressed among the MPH, ATX, and control treatments. Three enzymes play a role in DA degradation and recycling (Fig. 4A). Firstly, the ebony (e) gene product converts DA into N-beta-alanyl-dopamine (NBAD) [67, 68] and was almost exclusively expressed in glial cells, but only occupied 25% in our data (Fig. 4B). Secondly, Dopamine-N-acetyltransferase, encoded by speck, converts DA into N-acetyl-dopamine (NADA). speck was expressed in glial cells, PNs, and non-specific cell types (such as C0, C4, and C5) (Fig. 4B). Although these results highlight the important role of glia in DA reuptake, metabolism, and recycling, other cells appear to convert DA into NADA rather than into NBAD (Fig. 4A, B). The fate and consequence of these two metabolites in each cell type remain largely unknown. Thirdly, tan (t), a gene coding a hydrolase that can convert NBAD back to DA, was nearly not found in any cell population from the brain itself (Fig. 4B), suggesting that this recycling pathway is not utilized there. Nevertheless, these three genes were also not significantly differentially expressed among MPH, ATX, and control treatments.
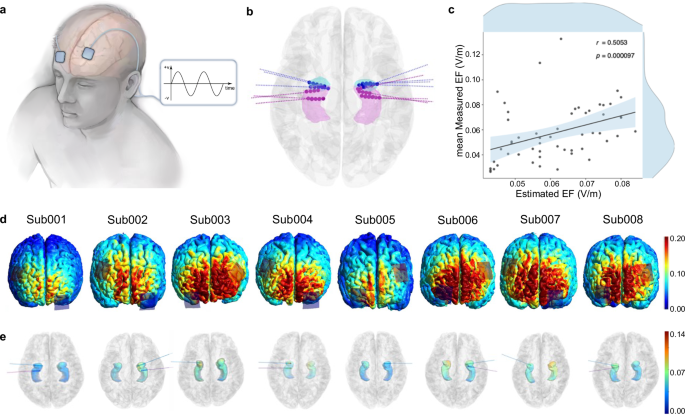
Fig. 4: Identification of genes and cell types involved in the psychotropic drug hypothesis.
Dopamine metabolism and signaling was analyzed first, and receptor genes for other neurotransmitters related to the hypothesis are shown later. A Major proteins involved in the metabolism and signaling of dopamine (DA) are shown in the schematic of a dopaminergic synapse. The “Chemical Synapse: Steps of Synaptic Transmission” template was used to create the figure, which was then modified using drawings from Yamamoto (2014) and Croset (2018) and concatenated using BioRender.com (2022). B DotPlot showing the average expression and percentage of expression of specific genes involved in DA metabolism and signaling in all clusters. C Heatmap showing the fold change in specific DEGs following MPH (left panel) and ATX (right panel) treatment in some specific cell types. Functional groups of genes are indicated with the same color. DEGs ( | log2FC | \(\ge\) 0.25, Bonferroni-adjusted P \(\le\) 0.05) are represented by the rows and cell clusters are listed at the bottom (columns). Color bar shows the direction of gene expression regulation following exposure to drugs, and the values inside the box indicate the log2FC.
The vesicular monoamine transporters (encoded by Vmat) transport DA, 5-HT, OA, and TA into synaptic vesicles [69]. As already mentioned, Vmat was mainly detected in Monoamines (C20). The DAT-encoded DA transporter mediates DA reuptake by dopaminergic neurons. Unlike Vmat, DAT was not only specifically expressed in dopaminergic cells, but also found in MBKCs (C9-MBKC_a” cluster in Fig. 4B), suggesting that other neurons may tightly regulate the duration and magnitude of DA signals that they receive. However, these two transporters were also not significantly differentially expressed among MPH, ATX, and control treatments. These results are not consistent with the previously discussed hypothesis that MPH acts primarily by inhibiting DAT [70]. Here, we propose several reasons for this discrepancy. Firstly, the high dose may be one reason for the non-significant differential expression of DAT following MPH treatment, since previous research has shown that different doses of MPH can lead to different results [11]. For example, one study found that a high dose of MPH appears to suppress intracranial self-stimulation through mechanisms other than DAT inhibition [71]. Although we used the inflection point of locomotor activities (as shown in Supplementary Fig. 1A, B), which followed previous experiments with MPH [10, 26], no such experiments have been performed in Drosophila with ATX; thus, it is difficult to describe the dose effects of MPH and ATX in our experiments. Secondly, structural biology research has demonstrated that Drosophila DAT possesses differences in subsite B of the central binding site as compared with human DAT, which leads to much weaker inhibition of the stimulant amphetamine in humans [72]. Thirdly, it has been shown that the extracellular concentration of DA is significantly decreased in neuronal cell lines devoid of DAT following treatment with MPH [7]. Therefore, we suggest that these factors prevent us from viewing the pattern of DAT inhibition.
In addition to DAT, our data also explore the distribution and drug response of DA receptors, which are another important factor in the DA signaling pathway that influences DA levels in the synaptic cleft. As shown in Fig. 4B, DA receptors (Dop1R1, Dop1R2, Dop2R, and DopEcR) are not only distributed in MBKCs that form numerous synapses with DA neurons in the lobes of mushroom bodies, but also in Monoaminergic (C20) and projection neurons. Although we are unable to directly map the cell types between Drosophila and humans, various cell types in Drosophila brain expressed DA receptors and responded to the drugs, emphasizing the various cellular responses of DA. Our data demonstrate that DopEcR is expressed in almost all cell types, even glia, which is consistent with a previous study reporting this as an important receptor broadly expressed in Drosophila brain [73]. DopEcR is activated by DA as well as ecdysteroids (ecdysone and 20E) to increase cAMP levels and modulate multiple signaling cascades such as the phosphoinositide 3-kinase pathway [74,
Comments (0)