
Remember me
The effect of Aβ1-42 oligomers on synaptic plasticity function is largely investigated in both ex vivo and in vivo models [12,13,14,15,16,17], however poor literature describes the functional impact of Aβ fibrils on synaptic activities [8, 19], particularly in the context of their coexistence with other aggregated forms. To address this gap, we generated Aβ1-42 fibrils by incubating the peptide under aggregating conditions and collected samples at defined time points during fibrillization. Importantly, no purification steps were performed to isolate specific fibril species. As a result, each preparation was enriched in the dominant fibril population of each time point but retained a minor fraction of other assemblies [29]. This approach preserved the natural heterogeneity of Aβ aggregates and better mimicked the complex environment observed in pathological conditions [18, 30,31,32,33,34]. These fibril preparations were then applied, at the same final dilution of Aβ1-42 oligomers, to ex vivo brain slices to assess their effects on hippocampal synaptic plasticity [13, 14].
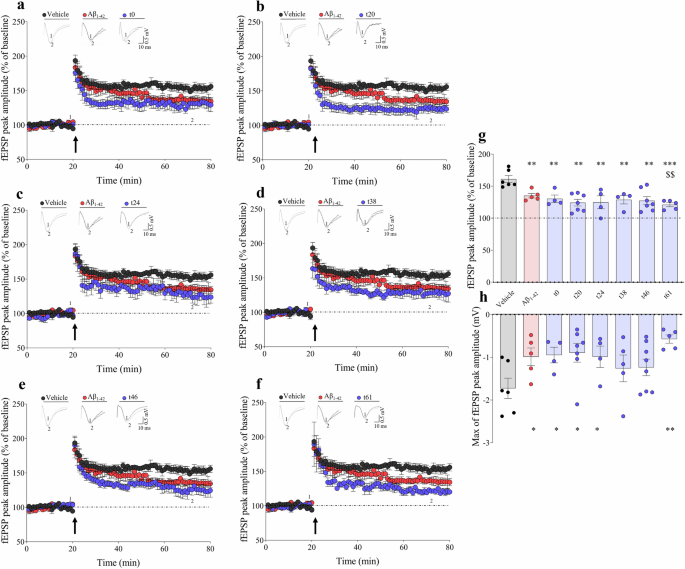
In our experimental conditions, Aβ1-42 oligomers affect synaptic plasticity and significantly reduce the magnitude of long-term potentiation (LTP) compared to the vehicle control (vehicle 161.10 ± 5.49, n = 6 vs Aβ1-42 135.13 ± 3.52, n = 5, P < 0.01 Fig. 1a–g) [13, 14, 35]. Similarly, in the slices treated with fibrils obtained at intermediate aggregation time points (t20–t46), we observed a reduction of the LTP against the vehicle, similarly to the Aβ1-42 oligomers effect (t20 124.26 ± 5.25, n = 7, t24 124.87 ± 10.19, n = 4, t38 128.78 ± 6.52, n = 4, t46 127.35 ± 5.88, n = 7 vs vehicle 161.10 ± 5.49, n = 6, P < 0.01; t0–t46 vs Aβ1-42 135.13 ± 3.52, n = 5, P > 0.05; Fig. 1b–e, g), suggesting equivalent synaptic-toxicity between these fibrils and Aβ1-42 oligomers. Conversely, in the slices treated with Aβ fibrils collected at a later aggregation stage (t61) the amplitude of potentiation was significantly reduced compared to Aβ1-42 oligomers treatment (t61 121.02 ± 3.17, n = 5 vs Aβ1-42 135.13 ± 3.52, n = 5, P < 0.001, Fig. 1f, g), suggesting increased synaptic damage compared to oligomers of the same Aβ1-42 protein, which can be mediated by high concentrations as well as increased average fibril length and branching complexity of fibrils, as observed by SEM analysis.
Fig. 1: Impact of Aβ fibrils on the synaptic plasticity using an ex vivo model. The alternative text for this image may have been generated using AI.
Data are presented as mean value ± SEM. *P < 0.05, **P < 0.01 and ***P < 0.001 vs vehicle; $$P < 0.01 vs Aβ1-42 oligomers. a–f Above, representative traces before (1) and after (2) the theta brust stimulation, for brain slices in the respective experimental groups: Vehicle, Aβ1-42 oligomers (500 nM), and the corresponding time of fibrillization (t0, t20, t24, t38, t46, t61). Below, a summary graph of the average time course of LTP. Vehicle: n = 6, t0 and t24: n = 4, t20 and t46: n = 7; Aβ1-42, t38, t61: n = 5. g Histograms illustrate the magnitude of LTP (% of baseline) in each experimental condition. Dots represent the mean of last 10 min of LTP recorded for each brain slice. h Histograms representing the maximal fEPSP measured after the incubation time of ex vivo hippocampal slices and before the start of baseline and LTP recording. Each dot represents the maximal fEPSP measured in a brain slice.
To further examine synaptic integrity, we analysed baseline field excitatory postsynaptic potential (fEPSP) amplitudes before LTP induction. For the Aβ1-42 oligomers, we observed a significant reduction of the max amplitude recorded (Aβ1-42 -0.99 ± 0.21, n = 6 vs vehicle -1.73 ± 0.24, n = 5, P < 0.05; Fig. 1h) that was similarly observed in slices treated with Aβ fibrils t0–t46 (Fig. 1h). Consistent with the LTP findings, slices exposed to t61 fibrils exhibited a further reduction in baseline fEPSP amplitude, reinforcing the evidence of advanced synaptic damage (t61 -0.57 ± 0.10, n = 5 vs vehicle -1.73 ± 0.24, n = 5, P < 0.01; Fig. 1h).
Basal neurotransmitter release was assessed using paired-pulse ratio (PPR) analysis, and no significant changes in PPR were detected across any treatment groups compared to vehicle, indicating that presynaptic neurotransmitter release is not significantly altered (Fig. 2a–f).
Fig. 2: Hippocampal paired pulse ratio (PPR). The alternative text for this image may have been generated using AI.
PPR is induced by pairs of stimulation delivered at several interstimulus intervals (20, 50, 100, 200, 300, 500 ms) at different experimental groups: Vehicle, Aβ1-42 (500 nM), and the corresponding time of fibrillization (a-f t0, t20, t24, t38, t46, t61). Any significative change has been evaluated. Vehicle: n = 6, t0 and t24: n = 4, t20 and t46: n = 7; Aβ1-42, t38, t61: n = 5.
Morphological assessmentTo provide a more complete view of the aggregation process, earlier time-points were also analysed. At the initial stage (t0), only small, spherical oligomeric species were detected. These oligomers were relatively homogeneous, with radii measured in nanometers (25.50 ± 15.60, Fig. 3a, h), reflecting the earliest species formed during Aβ1-42 aggregation. At the intermediate stage (t20), aggregates had become progressively more heterogenous, including both spherical oligomers and elongated species, which indicates that fibril formation was beginning to occur (140.40 ± 48.50, Fig. 3b, i). Therefore, the transitional aggregates were larger than the t0 aggregates but smaller than the fibrils seen at t61; thus, the transitional aggregates represent an intermediate state between the t0 and t61 stages in the aggregate formation process, according also to the functional results of synaptic plasticity.
Fig. 3: Morphological assessment of Aβ fibrils. The alternative text for this image may have been generated using AI.
SEM images of Aβ1-42 after a 0 h, b 20 h and 61 h of incubation, which reveal the presence of four distinct morphological species: c fibers, d fibrils (right), flat aggregates with extended surfaces (left), and e small aggregates. f Detailed view of a large fiber. g SEM images of Aβ1-42 after 61 h of incubation, presence of aggregates with surfaces characterized by beta-sheet formations. h-k Histograms show the percentage of fibrils within each length interval after h 0 h and i 20 h of incubation, where elongated oligomeric structures are highlighted in yellow; j the four distinct morphological species formed after 61 h of Aβ1-42 incubation, and k of fibril length distribution, showing the percentage of fibrils within each length interval (measured in μm) after 61 h of incubation.
Consequently, based on the amplified synaptic impairment observed in ex vivo experiments at the 61 h (t61) aggregation stage, this time point was selected for detailed morphological investigation by SEM analysis, to better characterize the fibrillar structures associated with the synaptic defect described.
This analysis provided in-depth insights into the fibrillation outcomes, enabling, through statistical evaluation, to quantify different species present. Specifically, SEM images acquired after 61 h of Aβ1-42 incubation revealed four distinct morphological species: fibers, fibrils, small aggregates, and larger aggregates with extended surfaces (Fig. 3l).
The fibers observed at t61 are well-defined structures, with lengths ranging from 2 to 320 μm (Fig. 3c, l, m). The average fiber length is 34.4 μm, with a standard deviation of 67.3 μm, and their thickness averages 0.5 ± 1.55 μm. The fibrils appear as elongated, highly ordered structures, but with much shorter lengths compared to fibers (Fig. 3d), often appear intertwined, with smaller branching structures. As a result, the lengths of the fibrils are highly variable, ranging from 0.08 to 2 μm, with an average length of 0.7 μm ± 0.5 μm and a thickness ranging from a few nanometers to 20 nm (Fig. 3l, m).
Furthermore, the left side reveals the presence of extensive non-fibrillar aggregates (Fig. 3d). These aggregates generally have flat surfaces, though some exhibit more distinctive structures with surfaces characterized by beta-sheet formations (Fig. 3g).
Other species present are the small aggregates, which exhibit a wide range of morphologies. Some of these aggregates appear more spherical and well-defined, while others are irregularly shaped. Their size varies considerably, with diameters ranging from 0.04 to 2.23 µm. On average, these aggregates measure 0.41 µm in diameter, with a standard deviation of 0.38 µm (Fig. 3e, m).
Finally, we provide a detailed view of a large fiber, revealing its complex internal structure composed of multiple smaller fibers and fibrils. Additionally, numerous small aggregates are present both on the fiber’s outer surface, giving it a rough texture, and within its structure (Fig. 3f).
The frequency of each of the four observed species was calculated from a representative sample. Fibers represent 34%, and fibrils account for 24%, both being organized structures formed as a result of the fibrillation process. Small aggregates remain prevalent, comprising 39%, despite their reduced size. In contrast, the more extensive aggregates constitute only 3% (Fig. 3m).
Impact of Aβ fibrils binding on liposome membrane fluidityTo mimic the cell membrane, it has been carried out a membrane model made of liposome, structurally similar to biological membranes [36], and to assess the impact of Aβ fibrils binding on liposome membrane fluidity it has been evaluated the Generalized Polarization (GP) of laurdan, a widely used parameter to assess the physical state and fluidity of lipid membranes, particularly in liposomes and biological membranes [37].
GP values reflect changes in membrane fluidity and polarity affected by the presence of proteins or peptides that alter the lipid environment and dynamics due to their binding, which can alter the lipid organization. Typically, higher GP value is usually associated with reduced membrane fluidity, low polarity, or increased cholesterol content, whereas lower GP values reflect enhanced fluidity and membrane disorder, making laurdan particularly useful for detecting transitions between liquid-ordered and disordered membrane phases [37, 38]. We used liposomes enriched with GM1, a lipid commonly found in neuronal membranes, in the presence and absence of cholesterol and phosphatidylcholine. After preparation, liposomes have been characterized by DLS and in buffer the vesicle hydrodynamic diameter was approximately 110 nm (data not shown).
To assess membrane binding, we first incubated the Aβ1-42 peptide at 37 °C and monitored fibril formation over time by measuring changes in ThT fluorescence intensity (see “Materials and methods”). A substantial increase in the probe’s fluorescence intensity, indicative of fibril formation, was observed only after 48 h of incubation (Fig. 4a). As illustrated in Fig. 4b, the membrane interaction properties of Aβ1-42 differ according to its quaternary structure.
Fig. 4: Aβ fibrils affect membrane fluidity of liposome. The alternative text for this image may have been generated using AI.
a Fluorescence of ThT in the presence of Aβ1-42 incubated at 37 °C for different time. The inset shows the ThT spectra in the presence of Aβ1-42 that was freshly prepared (red) or incubated for 24 h (black) and 61 h (blue) at 37 °C. b Filled and open symbols indicate the effect of Aβ1-42 fibrils (F-Aβ1-42) on liposome membrane fluidity compared to non-fibrillated Aβ1-42 (NF-Aβ1-42). The experiments were carried out on LUVs with two different compositions: POPC and GM1 (black) (PG), and POPC–GM1–cholesterol–phosphatidylcholine (red) (PGCP). Data are shown as a function of the ratio between liposomes and Aβ1-42 fibrils (5 μM) concentrations. The solid lines correspond to the best fit obtained described in “Materials and methods” section.
In our conditions, incubation with Aβ₁₋₄₂ oligomers didn’t significantly affect laurdan GP value, suggesting minimal or no interaction with the membrane under these conditions (Fig. 4b) for both types of liposome compositions tested. In contrast, treatment with Aβ1-42 fibrils (i.e., Aβ incubated for 61 h at 37 °C) resulted in a clear increase GP value in a dose-dependent manner, indicating a reduction in membrane fluidity (Fig. 4b), confirming the evidence that fibrils interact with GM1 rich domain within membranes, potentially contributing to membrane rigidity and neuronal dysfunction [39]. Obviously, the reduction in fluidity varies depending on the two types of membranes, since the liposomes containing cholesterol and phosphatidylcholine have a higher GP value, indicating lower initial fluidity. These data allowed us to calculate, by nonlinear regression analysis, the values of the affinity constant, [L1/2] obtained for the two different liposomes compositions. The parameters obtained by fitting the curves results to be [L1/2] =(50 ± 12) μM and [L1/2] =(32 ± 10) μM in the case of liposomes with or without cholesterol respectively. These two values do not differ significantly (P ≈ 0.25) indicating that the propensity of Aβ1-42 fibrils to bind membranes is not affected by liposome composition, at least for these two conditions.
Comments (0)