
Remember me
Blood was obtained from anonymous healthy adult volunteers with informed consent according to approved protocols of the ethics board of the Francis Crick Institute and the Human Tissue Act (study reference CREC_2024_006). Sex, gender, race and ethnicity were not considered in the study design. All samples were destroyed following analysis.
MiceWT, Batf3−/−3, Clec9aCreRosaLSLtdTomato44, Xcr1Venus (gift from T. Kaisho, Wakayama Medical University, Japan)45 and OT-I/Rag1−/− mice on a C57BL/6 background and WT BALB/c mice were bred and maintained at The Francis Crick Institute under specific-pathogen-free conditions, a 12 h light/dark cycle (7 a.m. to 7 p.m.), and controlled room temperature (RT; 20–24 °C) and humidity (55% ± 10%). Sex-matched female and male mice were used at 6–10 weeks of age for in vivo tumor experiments. No statistical methods were used to predetermine sample sizes, but these sizes were similar to those reported in previous publications8,43. All animal experiments were performed in accordance with national and institutional guidelines for animal care and were approved by the Francis Crick Institute Biological Resources Facility Strategic Oversight Committee (incorporating the Animal Welfare and Ethical Review Body) and by the Home Office, United Kingdom (PP8593771).
Primary cells and linesRPMI 1640 supplemented with 2 mM glutamine, 100 units ml−1 penicillin, 100 μg ml−1 streptomycin, nonessential amino acids, 10 mM HEPES, 50 μM 2-mercaptoethanol (all from Gibco) and 10% heat-inactivated fetal calf serum (FCS) (R10+ medium) was used for all cell culture unless otherwise stated. The MutuDC1940 cDC1 line58 was a gift from H. Acha-Orbea (University of Lausanne, Switzerland) and cultured in IMDM containing 10% heat-inactivated FCS, 100 units ml−1 penicillin, 100 μg ml−1 streptomycin and 50 μM 2-mercaptoethanol. BRAFV600E 5555 melanoma was a gift from G. Kassiotis (The Francis Crick Institute, UK). MCA205 fibrosarcoma, CT26 colorectal cancer, HeLa, and RAW264.7 parental and sublines were obtained from The Francis Crick Institute Cell Services Science Technology Platform. MCA205-LA-OVA was generated previously43.
For murine FLT3L cDCs, bone marrow was extracted from hind legs of mice and subjected to red blood cell lysis (Thermo Fisher Scientific). Cells were cultured for 9 days in R10+ medium containing 150 ng ml−1 recombinant mouse FLT3L (R&D systems). On day 8, FTL3L cDC cultures were additionally primed with 200 ng ml−1 IFNα (R&D Systems). cDC1s and non-cDC1s were separated using biotinylated anti-mouse XCR1 IgG (BioLegend, clone ZET) and Anti-Biotin MicroBeads and LS Columns (both Miltenyi) according to the manufacturer’s instructions. Alternatively, cDC2s were enriched on day 9 using PE-conjugated anti-mouse CLEC10A IgG (clone LOM-14, BioLegend) and Anti-PE MicroBeads (Miltenyi), followed by overnight priming with 200 ng ml−1 IFNα. In some experiments, FLT3L cDC1s and cDC2s were surface-stained and flow-sorted using a FACSAria (BD Biosciences). GM-CSF- and M-CSF-derived cells were generated by bone marrow cell culture with 20 ng ml−1 GM-CSF for 7 days59 or M-CSF-containing L929 conditioned medium, respectively.
For preactivated effector OT-I CD8+ T cells, spleen and lymph node single-cell suspensions from OT-I/Rag1−/− mice were subjected to red blood cell lysis before culture in R10+ medium supplemented with 100 U ml−1 IL-2 (Peprotech) and 0.1 nM SIINFEKL (generated at The Francis Crick Institute, UK) for 3 days. On days 3 and 4, cells were split 1:2, and the culture medium was completely replaced with R10+ medium containing 100 U ml−1 IL-2. OT-I cultures were used on day 5.
For human MCs, peripheral blood mononuclear cells were isolated using Histopaque-1077 (Thermo Fisher Scientific) per the manufacturer’s instructions, and CD14+ monocytes were enriched using biotinylated anti-human CD14 IgG (clone HCD14, BioLegend) as outlined for FLT3L-DCs. For MCGM-CSF/IL-4 and MCM-CSF, monocytes were cultured with either 100 ng ml−1 recombinant human GM-CSF and 40 ng ml−1 IL-4 or 50 ng ml−1 M-CSF (all Peprotech) in R10+ medium for 6 days, respectively, with half the medium refreshed on day 3.
Hoxb8 CDP generation and cultureCDPs were immortalized using the ER-Hoxb8 system31. Bone marrow CDPs (Lin−CD117−CD115+FLT3+DNGR-1+) were isolated by fluorescence-activated cell sorting (FACS) and cocultured with congenic bone marrow cells in R10+ medium with 20 ng ml−1 IL-3, IL-6 and SCF (Peprotech). Cells were transduced the following day with retrovirus containing MSCV-Neo-HA-ER-Hoxb8 (obtained from D. Sykes, Harvard, Cambridge, USA) and selectively expanded with 1 mg ml−1 G418 in R10+ medium supplemented with 75 ng ml−1 FLT3L (from CHO-FLT3L-producing cells) and 0.5 µM E2 (β-estradiol, Sigma-Aldrich). Immortalized CDPs were recovered by FACS. Passaged Hoxb8 CDPs were washed twice with Dulbecco’s PBS (DPBS) and cultured in R10+ medium with 75 ng ml−1 recombinant mouse FLT3L (R&D systems) alone (for cDC2s) or with OP9-DL1 cells (for cDC1s and cDC2s)60 over 5–7 days.
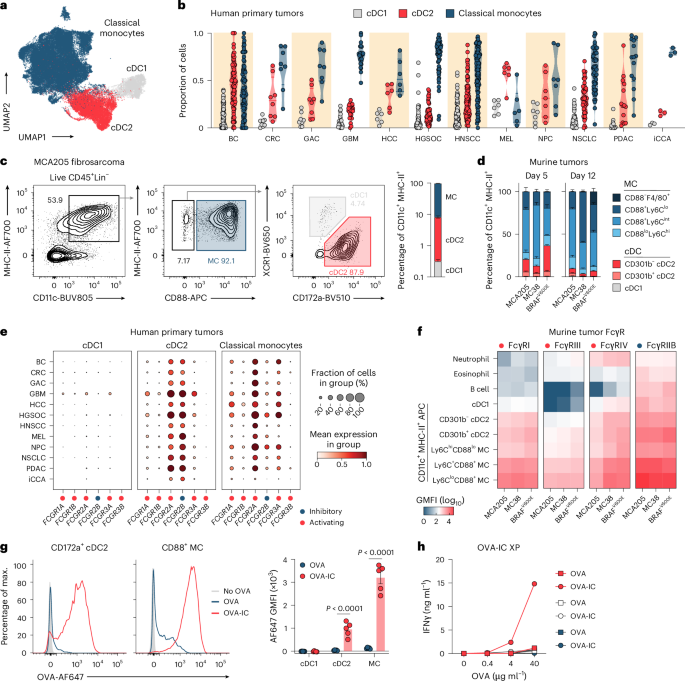
Myeloid APC transcriptomic analysesFor human tumor APC analysis, we used a recently generated myeloid APC atlas based exclusively on public datasets (listed in Supplementary Table 3) as outlined previously26. Code and data availability are outlined below. cDC1s, cDC2s and classical monocytes were extracted from the scvi batch-corrected object. Standard Scanpy (v.1.10.2) pipelines were used to generate a neighborhood graph (scanpy.pp.neighbors() function, n_neighbors=10, n_pcs=30) and UMAP visualization (scanpy.tl.umap() function, min_dist=0.3) in Python (v.3.12.3). To generate dot plots of FcγRs and costimulatory molecules across tissues, we used the scanpy.pl.dotplot() function, with dot_min=0.0, dot_max=1.0, vmin=0, vmax=1. Cell counts and associated metadata were extracted from the atlas and used to calculate frequencies for the cell types of interest. Fcgr expression was assessed on distinct steady state and inflammatory APCs using the Immgen database.
Murine tissue analysis and flow cytometryExcised murine tumors and spleens were diced and digested with collagenase IV (200 U ml−1, Worthington) and DNase I (100 μg ml−1, Sigma-Aldrich) for 30 min at 37 °C. Tissue was filtered through 70-μm strainers (Falcon), washed with FACS buffer (DPBS with 1% FCS and 2 mM EDTA) and pelleted by centrifugation at 400g for 4 min. For tumors, single-cell suspensions were resuspended in 40% Percoll and centrifuged at 600g for 20 min with minimal acceleration and deceleration.
Single-cell suspensions were stained with LIVE/DEAD Fixable Blue Dead Cell Dye (Thermo Fisher Scientific) per the manufacturer’s instructions and stained for 30 min on ice with a combination of fluorescently conjugated anti-mouse antibodies (listed in Supplementary Table 4). For human FcγR analysis, MCs were harvested on ice or with 1× TrypLE (Thermo Fisher Scientific), washed twice in DPBS, and surface-stained with the antibodies listed in Supplementary Table 4. Cells were acquired live or fixed (Nordic-MUbio). Within each experiment, identical acquisition parameters were used across tissues, allowing comparison of GMFI values. For live cells, DAPI (2 ng ml−1) was used for dead cell discrimination in certain instances. Cell quantification was performed using 123count eBeads (Fisher Scientific). Samples were acquired on an LSRFortessa or FACSymphony (BD Biosciences), and data were analyzed using FlowJo v.10.
Fc fusion proteinsFc–DNGR-1 fusion proteins were generated at The Francis Crick Institute or contracted commercially (ImmunoPrecise, The Netherlands). Briefly, WT and 2WA mouse DNGR-1 ECD DNA sequences were amplified from existing pFB neo plasmids using Infusion-designed primers (Sigma-Aldrich). An amplified pFUSEN-mG2aFc plasmid (InvivoGen) was linearized using NheI and EcoRV restriction enzymes, gel purified, and subjected to Infusion reaction (Takara) with amplified 2WA or WT mouse DNGR-1 ECD DNA sequences according to the manufacturer’s instructions. Plasmids were transformed into Stellar competent cells and selected overnight on zeocin agar plates. Single colonies were cloned, sequenced and used for downstream expression. Mouse IgG2a N297A Fc mutagenesis was performed with sequence-verified Fc–DNGR-1 and a QuikChange Lightning Site-directed Mutagenesis Kit (Agilent Technologies) according to the manufacturer’s instructions, using primers designed to span the mutation site (Sigma). Plasmids were transformed into XL10 Gold bacteria (Agilent Technologies) and grown overnight on LB agar plates. Single colonies were grown in zeocin-containing LB broth, and plasmid DNA was extracted using a QIAprep Spin Miniprep Kit (QIAGEN) and sequenced.
Amplified sequence-verified plasmids were transiently transfected into Expi293F cells, and supernatants were harvested over several days. Fc–DNGR-1 fusion proteins were purified using protein A beads (Generon; M1300-5) following the protocol for the Pierce Gentle Ag/Ab Binding and Elution Buffer Kit (Thermo Fisher Scientific, 21030). Proteins were then dialyzed in endotoxin-free 25 mM Tris pH 7.2, 150 mM NaCl (BupH Tris Buffered Saline Packs, Thermo Fisher Scientific). Samples were tested for endotoxin (Pierce Chromogenic Endotoxin Quant Kit-60 reactions, Thermo Fisher Scientific) and confirmed to be <0.05 EU ml−1. Nonreducing SDS–PAGE was performed on purified proteins by heating to 95 °C for 5 min in Laemmli buffer and running on 7.5% mini-PROTEAN TGX precast gels (Bio-Rad) with Precision Plus Dual Color Standards. Gels were developed with Coomassie Brilliant Blue R-250 Staining Solution (Bio-Rad) and analyzed on an ImageQuant 800 (Amersham) imaging system. Large-scale production of fusion proteins was contracted commercially (ImmunoPrecise, The Netherlands; and FairJourney Biologics, Portugal).
Anti-F-actin human phage displayAnti-F-actin IgG monoclonal antibody selection was performed using phage display with a naive human Fab library and was contracted commercially (FairJourney Biologics, Portugal). After three rounds of positive selection for F-actin binding and negative selection for G-actin binding, a total of 736 clones were identified. For each round of screening, F-actin-bound phages were eluted either using standard elution buffer containing trypsin (1 mg ml−1) or via competition with Fc–DNGR-1 (at 1000 nM). ELISAs were performed to determine binding to F-actin and G-actin. Following Fab sequencing and analysis, including VH and VL gene diversity and sequence liabilities, 78 unique clones were taken forward for further evaluation. Necrotic cell binding analysis led to identification of 68 clones with ≥3-fold dead cell selectivity; these were reformatted to murine IgG2a and filtered for: ≥5-fold F-actin over G-actin binding, ≥5-fold F-actin over neutravidin binding, ≥10% necrotic cell binding, and ≥3-fold necrotic cell GMFI over background GMFI. Forty-five clones met these thresholds. Production of endotoxin-free anti-F-actin mouse IgG2a and hIgG1 monoclonal antibodies was contracted commercially (ImmunoPrecise, The Netherlands; and Biointron, China).
OVA-IC generationSoluble albumin from chicken egg white (OVA, 1 mg ml−1 in DPBS, Thermo Fisher Scientific) was incubated 1:1, 10:1, or 100:1 (v/v) with rabbit anti-chicken egg albumin whole antiserum (Sigma-Aldrich) at 37 °C for 30 min. In some experiments, OVA was labeled with an Alexa Fluor 647 (AF647) labeling kit (Thermo Fisher Scientific), per the manufacturer’s instructions.
FcγR cross-linkingNinety-six-well high-affinity Nunc MaxiSorp plates (Thermo Fisher Scientific) were coated with Fc–DNGR-1 or mouse IgG1/IgG2a (BioLegend) in DPBS overnight at RT. Plates were blocked with DPBS containing 10% FCS for 1 h. RAW264.7 cells were plated at 1 × 10⁵ cells per well in R10+ medium for 24 h. Mouse TNF and CXCL2 were measured using R&D Systems DuoSet kits per the manufacturer’s instructions.
Preparation of FM beadsAs previously described16,61, lyophilized nonbiotinylated G-actin (Cytoskeleton) was reconstituted in sterile water (10 mg ml−1), diluted in G-buffer (1 mg ml−1) and mixed at a 1:1 molar ratio with freshly reconstituted biotinylated G-actin (Cytoskeleton) in F-actin buffer. After 1 h at RT, myosin-II (Cytoskeleton) was added to F-actin at a 1:1 molar ratio and incubated for a further 1 h at RT. For coating of microbeads, 2 μg ml−1 biotin–OVA (generated with a DSB-X biotinylation kit and protocol; Thermo Fisher Scientific) was added to streptavidin-coated 2-μm microbeads (Polysciences) for 1 h at 4 °C. Beads were washed with 1% bovine serum albumin (BSA) in DPBS for 3 min at 10,000g then incubated with biotinylated FM for 1 h at 4 °C.
IgG-OVA bead preparationFifty milligrams of 3-μm carboxylated silica beads (Kisker) were washed three times with DPBS, resuspended, and rotated in 40 mg ml−1 cyanamide in DPBS for 15 min at RT. The beads were washed three times with 1 ml of 0.1 M sodium borate buffer pH 8.0, resuspended, and rotated in 1 ml of 4 mg ml−1 OVA in 0.1 M sodium borate buffer pH 8.0 for 2 h at RT. The beads were then washed another three times with 0.1 M sodium borate buffer pH 8.0 and resuspended and rotated in 1 μg ml−1 AF555 succinimidyl ester for 15 min in 0.1 M sodium borate buffer pH 8.0 in the dark. Then, they were serially washed with 1 ml of DPBS, three times with 1 ml of 0.2 M glycine in DPBS, and three times in DPBS before storage at 4 °C. To make IgG-OVA beads, 1:500 polyclonal rabbit anti-OVA IgG (Sigma-Aldrich SAB4301164) was added to 1 ml of OVA beads in DPBS, followed by rotation at RT for 30 min. IgG-OVA beads were then washed three times with 1 ml of PBS and used on the same day. In some instances, streptavidin-coated silica beads (Kisker) were coated with biotin–OVA (as above) before incubation with polyclonal rabbit anti-OVA IgG.
Necrotic cell preparationTumor cell lines (BRAFV600E, MCA205 or HeLa) were irradiated with 240 mJ cm−2 ultraviolet C (UVC) in DPBS and cultured overnight in serum-free RPMI 1640 medium.
Binding of Fc fusion proteins to dead cells and FM beadsNecrotic tumor cells or FM beads were incubated with Fc fusion proteins at RT for 1 h in DPBS. Samples were washed twice and incubated with anti-mouse IgG or DNGR-1 antibodies (Supplementary Table 4) at 4 °C for 30 min. Samples were washed and resuspended in DPBS before acquisition and analysis as above. Some samples were washed and incubated with Annexin binding buffer and Annexin V AF647 conjugate (Invitrogen) for 10 min at RT, followed by incubation with DAPI before acquisition.
Flow cytometric phagocytosis assayTumor cells were labeled with Cell Tracker-Deep Red (CT-DR) dye (Thermo Fisher Scientific; 1:1,000 dilution) in DPBS containing Ca/Mg for 30 min at 37 °C before UV irradiation, incubation with phagocytes at the indicated ratios and time points, and surface-staining for flow cytometry with a combination of antibodies (listed in Supplementary Table 4). DAPI or LIVE/DEAD Fixable Blue Dead Cell Dye (Thermo Fisher Scientific) was used to exclude noninternalized necrotic cell material. Samples were acquired and analyzed as above. Necrophagic index was calculated as: (%CT-DR+ × CT-DR GMFI of CT-DR+)/10,000.
FcγR-mediated myeloid cell activationIn certain experiments, cytokine production in necrotic cell–phagocyte cocultures was assessed after 24 h using ELISA DuoSet kits (R&D Systems) or LegendPlex (BioLegend) according to the manufacturer’s instructions. Human MCs were further washed three times in DPBS and surface-stained for flow cytometry for 30 min on ice with the anti-human antibodies listed in Supplementary Table 4. LIVE/DEAD Fixable Blue Dead Cell Dye (Thermo Fisher Scientific) was used to exclude dead cells, and samples were analyzed by flow cytometry as above.
XP assayAPCs (5 × 10⁴ per well) were plated in U-bottomed 96-well plates. Necrotic cells were soaked for 1 h at 37 °C in 10 mg ml−1 OVA (Sigma-Aldrich) in RPMI 1640 medium before being washed three times in DPBS. OVA-necrotic cells, FM-OVA beads or SIINFEKL peptides were incubated with APCs for 4 h in the presence of Fc–DNGR-1, Affimer-Fc or AFA variants (10 nM unless specified). Then, 2:1 preactivated OT-Is were added to APC cultures for 24 h, and T cell-derived IFNγ release was measured by in-house ELISA. Briefly, 96-well high-affinity Nunc MaxiSorp plates (Thermo Fisher Scientific) were coated overnight with rat anti-mouse IFNγ IgG (clone R4-6A2, BD Biosciences, 8 μg ml−1 in 0.1 M sodium bicarbonate buffer) before being washed in 0.05% Tween-20 in DPBS. Plates were blocked for 1 h with 3% FCS (blocking buffer), washed, and incubated with T cell culture supernatants and recombinant IFNγ (Peprotech) standard curve samples for 2 h. After washing, plates were incubated with biotin rat anti-mouse IFNγ IgG (clone XMG1.2, BD Biosciences, 1 μg ml−1 in blocking buffer) for 2 h, then with ExtrAvidin-Alkaline Phosphatase (Sigma-Aldrich, 1:5,000 in blocking buffer) for 30 min, before being developed with SIGMAFAST p-nitrophenyl substrate solution (Sigma-Aldrich) per the manufacturer’s instructions. Absorbances at 405 nm (IFNγ signal) and 540 nm (background) were measured after 20–30 min on a Spark plate reader (Tecan). For inhibitor studies, APC-T cell cocultures were also treated with lactacystin (10 μM, Sigma-Aldrich) or leupeptin (250 μM, Sigma-Aldrich) for the duration of the experiment.
CD69 and CD25 upregulation on naive OT-I T cells was assessed by flow cytometry. Naive CD8+ T cells from spleen and lymph nodes of OT-I/Rag1−/− mice were negatively selected using an EasySep mouse CD8+ T cell kit (STEMCELL Technologies) according to the manufacturer’s instructions. After 16 h of incubation with APCs, T cells were then stained with anti-mouse antibodies (listed in Supplementary Table 4) and acquired and analyzed as detailed above.
DNGR-1 cross-blocking assayNecrotic cells were incubated with Fc fusion proteins at RT for 1 h before addition of 0.5 μg ml−1 DNGR-1–FLAG for 30 min and staining with anti-FLAG and IgG antibodies (Supplementary Table 4) at 4 °C for 30 min for flow cytometric analysis as above.
CRISPR–Cas9-mediated gene editingAs outlined in ref. 62, 25 μg recombinant Cas9 nuclease V3 and 40 μM target single-guide RNA (sgRNA) (IDT) were complexed in the presence of 1.6 μM IDT Alt-R Cas9 Electroporation Enhancer per reaction for 25 min at RT. Two sgRNA guides were used per gene. Then, 2 × 10⁷ bone marrow cells were mixed with each ribonucleoprotein complex in primary nucleofection solution (P3) in a 1.5-ml Eppendorf and transferred to a Nucleocuvette. The cell–ribonucleoprotein mixture was electroporated with the CM-137 program in a 4D Nucleofector (Lonza) before transfer to prewarmed medium (R10+ without antibiotics). Cells were cultured for 9 days in the presence of 150 ng ml−1 FLT3L, and gene deletion was assessed by flow cytometry. The sgRNA sequences are detailed in Supplementary Table 5.
APC microscopyFor murine cDC imaging, glass coverslips (18 mm) were coated with 0.1% poly-L-lysine (Sigma-Aldrich) for 30 min at RT, washed three times with DPBS, and incubated with 2.5% glutaraldehyde (Sigma-Aldrich) for 15 min at RT. After being washed a further three times with DPBS, coverslips were incubated with 1 μg ml−1 anti-MHC-II (Supplementary Table 4) in DPBS for 30 min at RT. Coverslips were washed in DPBS and incubated overnight in 0.2 M glycine in DPBS at 4 °C, before being washed another three times with fresh DPBS; then, 2.5–5.0 × 10⁵ APCs were allowed to attach for 1 h at 37 °C before challenge with CT-DR-labeled necrotic cells with or without Fc–DNGR-1 for 3–4 h. Cells were fixed in 4% paraformaldehyde (PFA), washed three times with DPBS, and stained with rhodamine-conjugated wheat germ agglutinin (1:10,000) in blocking buffer for 30 min at RT. Washed coverslips were mounted onto glass slides using Prolong Diamond Antifade Mountant (Fisher Scientific). Samples were imaged on a Zeiss LSM880 inverted confocal microscope. Image processing and analysis was performed using Fiji/ImageJ or Imaris v.9.1.2.
For human MC imaging, coverslips were prepared as above using anti-human HLA-DR IgG (Supplementary Table 4). CT-DR or CT-green CMFDA-labeled necrotic cells with or without AFAs or isotype control (anti-HEL) were added to plated MCs for 2–3 h at 37 °C. Cells were incubated with LIVE/DEAD Fixable Violet Dye (Thermo Fisher Scientific) in DPBS for 20 min, washed three times in DPBS, fixed in 4% PFA, washed another three times in DPBS and stained with rhodamine-conjugated wheat germ agglutinin (1:10,000) in blocking buffer for 30 min at RT. Washed coverslips were mounted onto glass slides using Prolong Diamond Antifade Mountant (Fisher Scientific) and analyzed as above.
Tumor microscopyFor tumoroids, 5 × 10³ BRAFV600E 5555 melanoma cells were seeded into Corning Matrigel Basement Membrane Matrix (VWR) in R10+ medium and cultured for 5 days with constant agitation. Tumoroids were dissociated from Matrigel using Corning Cell Recovery Solution (Fisher Scientific) and incubated with 10 μg ml−1 Fc–DNGR-1, AF555 phalloidin (1:400, Fisher Scientific) or 2 μg ml−1 DAPI for 24 h in R10+ medium. Tumoroids were washed in DPBS for 1 h, fixed in 4% PFA for 1 h, then incubated in 30% sucrose overnight. For tumors, 2.5 × 10⁶ MCA205-LA-OVA-mCherry tumor cells were injected into the shaved flanks of C57BL/6, Clec9aCreRosaLSLtdTomato or Xcr1Venus mice. After 7 days, Fc–DNGR-1 was injected i.t. (50 μg) or subcutaneously (s.c.; 200 μg) in DPBS, and tumors were harvested after 6–24 h. Tumors were fixed and processed as per tumoroid samples.
Tumoroids and tumors were embedded in O.C.T. (Tissue-Tek) for freezing, sectioned (10–30 μm) using a cryostat (Leica), mounted onto SuperFrost Plus glass slides (Thermo Fisher Scientific) and stored at −80 °C. Sections were thawed to RT, rehydrated in DPBS for 10 min, and blocked for 1 h in DPBS containing 0.3% Triton X and 2–5% normal goat serum or 3% BSA (blocking buffer). Sections were stained (all at 1:400 in blocking buffer, unless otherwise stated) with a combination of antibodies (listed in Supplementary Table 4), AF555-conjugated phalloidin (Fisher Scientific), DAPI and Hoechst (Thermo Fisher Scientific) for 1 h at RT. For certain tumor samples, sections were also incubated with anti-mouse CD103, rabbit polyclonal anti-RFP and/or rabbit anti-mouse CD64/FcγRI overnight at 4 °C before secondary staining with anti-goat and anti-rabbit IgG antibodies for 1 h at RT (as detailed in Supplementary Table 4). Slides were washed and mounted using Prolong Diamond Antifade Mountant (Fisher Scientific) and analyzed as above or using a Phenoimager Fusion (Akoya Biosciences).
Fiji (Image J) was used to generate figures. For some tumors, Imaris software was used to segment cells and quantify their location in tumors. Briefly, cDC1, non-cDC1 APC and necrotic cell surfaces were generated based on MHC-II and CD103 or IgG2a staining and by smoothing and thresholding the data after background subtraction. Distances of cDC1s and cDC2s to necrotic areas were generated using the CytoMAP platform63 with the ‘Calculate distance’ function on the MATLAB GUI. For quantification of necrotic surfaces using Fc–DNGR-1 staining in tumors, images were blurred using a Gaussian blur filter, and a threshold was applied for image binarization in Fiji. Resulting surfaces were analyzed in Fiji, and the total necrotic area was generated by summing the areas of individual surfaces.
For high-dimensional confocal microscopy using the MACSima Imaging System (Miltenyi), 10-μm sections were prepared as above and prestained with DAPI before iterative staining with FITC- or AF488-, PE-, and APC- or AF647-conjugated anti-mouse antibodies as listed in Supplementary Table 4. Image acquisition and processing was performed on the MACSima instrument. Visualization and figure generation was performed using the MACS iQ View software.
For analysis of actin cytoskeleton binding, HeLa cells were fixed, permeabilized and blocked as above. Cells were stained with Hoechst (2.5 μg ml−1), phalloidin-AF647 (1:400) and anti-F-actin IgG2a (32 nM) for 1 h in 500 μl 2% BSA in DPBS. Samples were washed three times, stained with anti-mouse IgG2a-AF488 for 1 h in 2% BSA in DPBS, washed, mounted and imaged as above.
Live cell imagingPrimary cDC1s or non-cDC1s (1 × 10⁵) from Clec9aCreRosaLSLtdTomato mice were cultured in μ-Slide 8 Wellhigh Glass Bottom coverslips (Ibidi) in R10+ medium supplemented with 30% conditioned medium from differentiation cultures. Then, 2:1 CT-DR-labeled necrotic cells and 1 μg ml−1 Fc–DNGR-1 were added to cDC cultures, and coverslips were placed into the imaging chamber of an Olympus CSU-W1 Spinning Disk confocal microscope. Cells were maintained at 37 °C and 5% CO2 for the duration of the acquisition. Images were acquired every 2 min for 3 h. Videos were analyzed in ImageJ or Imaris v.9.1.2.
Phagosomal ruptureRAW264.7 lines were plated onto an eight-well Ibidi μ-dish and left to adhere overnight. Cells were then washed with serum-free RPMI 1640 medium and left untreated or treated with titrations of DPI (D2926, Sigma-Aldrich) or R406 (S2194, Selleckchem) for 30 min in serum-free RPMI 1640 medium. Cells were then challenged with OVA beads or IgG-OVA beads for 3 h. Cells were then fixed with 4% PFA in DPBS for 20 min and quenched with three washes with 50 mM ammonium chloride in DPBS at RT. Outside beads were labeled with α-rabbit-AF405 in DPBS for 30 min and subsequently washed three times with DPBS. Cells were then permeabilized with 0.4% Triton X-100 in DPBS for 15 min and washed three times with DPBS. Afterward, the cells were blocked with 2% low fat milk in DPBS and incubated with 1:500 anti-mouse galectin-3-AF647 (clone M3/38, BioLegend) in 2% low fat milk in DPBS for 1 h at RT. Cells were then washed three times with DPBS and left in DPBS for imaging. Images were acquired on a Leica SP8 confocal microscope.
In vivo tumor experimentsTumor cell lines were dissociated with 0.25% trypsin, washed three times in DPBS and counted. Cells were resuspended and diluted in endotoxin-free DPBS (0.2–0.5 × 10⁶ cells per 100 μl) and injected s.c. in the shaved right flank of recipient mice. Tumor growth was monitored every 2–3 days, and the longest tumor diameter and perpendicular width were measured using digital Vernier calipers (tumor volume = length × width2/2). On day 4–6, mice were assigned to treatment groups to equalize tumor volume before treatment initiation. Mice in which tumors failed to implant by this time were excluded from downstream analysis and immediately terminated. Data collection and analysis were not performed blind to the conditions of the experiments.
Fc–DNGR-1 was administered via intratumoral injection (50–200 μg in 50 μl DPBS) every 3 days starting on day 6 or 7 for 2–3 total injections, unless stated otherwise in figure legends. Some mice were also injected with 2.5 mg kg−1 doxorubicin (MCA205, Merck Life Science), 2.5 mg kg−1 oxaliplatin (CT26, Merck Life Science UK) or control buffer (DPBS (doxorubicin) or 5% glucose (oxaliplatin)) i.t. Some mice were subjected to laser or CT-guided 10-Gy single-dose X-ray irradiation delivered in an irradiator cabinet on day 6 or 7 after tumor cell injection (Xstrahl RS320 Research System or SARRP). Mice received reversible general anesthesia throughout the duration of the procedure using a either ‘sleep mix’ of 0.05 mg kg−1 fentanyl, 5 mg kg−1 midazolam and 0.5 mg kg−1 medetomidine, reversed with a ‘wake mix’ of 1.2 mg kg−1 naloxone, 0.5 mg kg−1 flumazenil and 2.5 mg kg−1 atipam (RS320 Research System) administered intraperitoneally (i.p.) and dosed according to weight per mouse; or isoflurane (SARRP). Some experiments were performed in Batf3−/− mice, or in WT C57BL/6 mice treated i.p. with 300 μg isotype or anti-CD8α IgG (BioXCell). The maximal permitted tumor size of 15 mm average diameter was not exceeded in any mouse.
Fc–DNGR-1 pharmacokinetics analysisC57BL/6 mice were injected i.p. with 100 μg of Fc–DNGR-1, and blood was harvested between days 0 and 6 postinjection, and serum isolated using serum Z-Gel tubes (Sarstedt). Fc–DNGR-1 titer was calculated using a serum-compatible anti-DNGR-1 ELISA. Briefly, 96-well high-affinity Nunc MaxiSorp plates (Thermo Fisher Scientific) were coated overnight with rat anti-mouse DNGR-1 IgG (clone 42D2, 5 μg ml−1 in 0.1 M sodium bicarbonate buffer) before extensive washing with 0.05% Tween-20 in DPBS. Plates were blocked for 1 h with 3% FCS (blocking buffer), washed once more, and incubated with DPBS-diluted serum (1:100 and 1:1000) or Fc–DNGR-1 standard curve for 2 h. After washing, plates were incubated with biotin rat anti-mouse DNGR-1 IgG (clone 7H11, 1 μg ml−1) for 2 h before being developed with alkaline phosphatase, as above.
Quantification and statistical analysisAll statistical analyses were performed using GraphPad Prism software version 8. Statistical significance between two groups was determined using paired or unpaired two-tailed Student’s t-test. Statistical analyses for two or more groups were done by one- or two-way analysis of variance (ANOVA) followed by Bonferroni (in vivo) or Tukey (in vitro) multiple-comparison post hoc correction. Data distribution was assumed to be normal, but this was not formally tested. Data are plotted as the mean (for n < 3), mean ± s.e.m. (for n ≥ 3) or median as indicated in the figure legends. In vitro experiments represent technical replicates unless otherwise stated in the figure legends. In vivo experiments represent biological replicates.
Further information on research design is available in the Nature Research Reporting Summary linked to this article.
Reporting summaryFurther information on research design is available in the Nature Portfolio Reporting Summary linked to this article.
Comments (0)