
Remember me

This study is a secondary analysis of data previously reported by Demme et al. (2025), which were originally collected to train models for automatic sleep stage classification in preterm infants [5]. Here, we performed an additional analysis to investigate whether pre-existing medical conditions influenced the accuracy of the automatic sleep stage classification.
Study populationThe study was designed as a single-centre observational study at the Jena University Hospital. We recruited a total of 30 preterm infants that were regularly referred to the children’s sleep laboratory. Inclusion criteria were limited to preterm infants with a corrected gestational age (GA) between 35 + 0 and 37 + 6 weeks at the time of measurement, provided that PSG was already planned as part of their clinical care. The ethics committee of the University Hospital Jena approved the project (reg. no. 2022-2831_1-MV and 2022-2831_2-MV), and the parents provided written consent. The study was conducted according to good clinical practice (GCP) guidelines and the Declaration of Helsinki of 1975 (in its most recently amended version).
Two recordings were excluded—one due to the GA exceeding the inclusion criteria (39 + 0) and one due to an inadequate piezo mat signal quality. No further exclusion criteria were applied. Consequently, neither infant nor maternal health status was considered, resulting in a high degree of heterogeneity within the patient group. This variability is reflected in the range of underlying medical conditions, such as neonatal respiratory distress syndrome (NRDS), which affected 60.7% of the infants, and infections, as observed in 32.1% of cases (Table 1). Most medical conditions had been appropriately treated by the time of sleep assessment, meaning that the patients were clinically stable by the time of observation. The final cohort of 28 preterm infants with a mean GA at birth of 30.2 ± 2.1 weeks and a mean birthweight of 1411 ± 248 g is shown in Table 1.
Table 1 Patient demographics and clinical parameters.Experimental setupFor each infant, a PSG was recorded for approximately 4 h in the afternoon. During PSG, video recordings were made to visually detect the child’s movements and to identify potential disturbances, such as feeding, calming of the child, or electrode readjustments by the caregiver. Several electroencephalogram (EEG) channels (C3M2, C4M1, F3M2, F4M1, O1M2, and O2M1) were used for standardised brainwave monitoring. Eye movements were recorded bilaterally using electrooculography (EOG), while submental electromyography (EMG) captured chin movements.
Cardiac activity was continuously monitored via electrocardiography (ECG). Respiratory excursions were assessed by measuring pressure changes using an abdominal air pad or belt, from which the respiratory rate was derived. Additionally, the oronasal airflow was monitored using a nasal pressure sensor with a nasal cannula. Oxygen saturation (SpO2) was recorded by pulse oximetry, while the transcutaneous pCO2 values were measured with an electrode on the infant’s cheek.
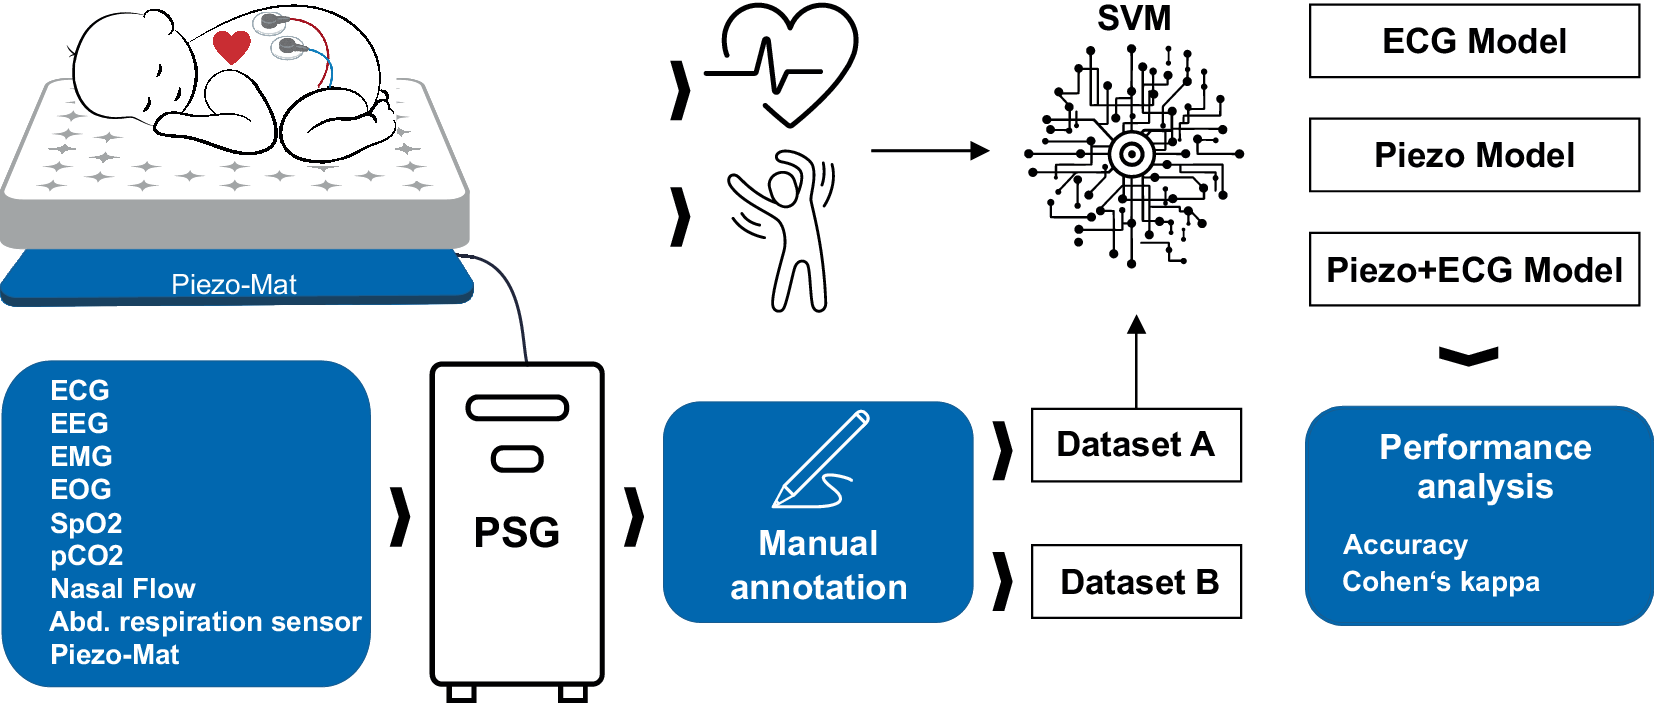
In addition to standard PSG, a motion-sensitive mat (JABLOTRON Nanny BM-02; JABLOTRON, Jablonec nad Nisou, Czech Republic) was placed beneath the infant’s mattress to enable noninvasive, contactless, and continuous monitoring of the infant’s movements, providing valuable insights into the infant’s sleep patterns (Fig. 1). Piezoelectric elements inside the mat convert pressure changes into voltage signals that were synchronously recorded.
Fig. 1 The alternative text for this image may have been generated using AI.
Overview of the experimental setup and methods. ECG electrocardiography, EEG electroencephalography, EMG electromyography, EOG electrooculography, SpO2 oxygen saturation, pCO2 partial pressure CO2, PSG polysomnography, SVM support vector machine
The PSG data were recorded using the Alice‑6 PSG system from Löwenstein Medical (Bad Ems, Germany) in combination with the Sleepware G3 software from Philips Respironics (Murrysville, PA, USA). Data were sampled at 200 Hz, and a 50 Hz notch filter was applied to remove the powerline noise.
Although Sleepware G3 includes an automatic sleep stage classification feature, it is typically inadequate for preterm infants and requires human expert reassessment [5, 7].
Manual annotation criteriaA reference dataset was created through manual annotation of sleep stages based on the American Academy of Sleep Medicine (AASM) scoring manual for infants aged 0–2 months [4, 8]. To minimise observer bias, three independent human experts (C. D., S. J., L. S.) classified each 30‑s epoch into active sleep (AS; equivalent to rapid-eye-movement sleep [REM]), quiet sleep (QS; equivalent to non-REM sleep), and wakefulness (W). Intermediate sleep (IS; equivalent to transitional sleep) was excluded due to its indistinct characteristics, which would add complexity without clinical benefit. As IS exhibits overlapping features of both quiet and active sleep, it is inherently difficult to classify, leading to greater variability and a higher potential for scoring errors [6, 24, 26]. Wakefulness is characterised by a mixed EEG pattern with frequent movement artefacts and irregular breathing and heart rate as well as behavioural indicators such as open eyes, vigorous body movements, and crying. Active sleep is characterised by continuous EEG activity with amplitudes of 40–80 µV, irregular breathing and heart rate, closed eyes with rapid eye movements, and low muscle tone intermittently disrupted by muscle twitches and facial grimacing. In contrast, QS presents a “trace alternant” EEG pattern, high-amplitude waveforms, and sleep spindles, accompanied by closed eyes, reduced body movement, and a regular respiratory and heart rate pattern [8, 16, 26].
The interrater agreement among the three experts was assessed using Fleiss’ kappa. For training and testing of our machine learning-derived algorithm, a consensus label was created for each 30‑s epoch. Two datasets were generated. Dataset A included only epochs on which all three experts agreed (68% of epochs; n = 8757 epochs), serving as a reliable training set for the algorithm. To maximise data utilisation, dataset B expanded on dataset A by including epochs on which at least two experts agreed (98.7% of all epochs; 12,787 epochs). Thus, dataset B was mainly used for further analyses, such as evaluating whether the algorithm’s performance depended on any medical conditions.
Sleep stage classification using Support Vector MachineTo develop an automatic sleep stage classification algorithm, a supervised learning approach employing a Support Vector Machine (SVM) was utilised [5]. Standardised features extracted from piezo mat (body movement) and ECG signals, along with manually labelled sleep stages (dataset A), were used to train three distinct models. One model integrated data from both sources (piezo + ECG), while the other two used either piezo mat or ECG inputs individually. This strategy ensures robust classification of sleep stages, compensating for a potential loss of one source of input. The piezo + ECG model achieved the best performance, with high accuracy and Cohen’s kappa [5].
Applicability of AI across patient groups and statistical analysisGiven the heterogeneity of the patient population, we examined whether pre-existing medical conditions and infant characteristics (e.g. bodyweight at measurement) influenced classification performance, as reflected in accuracy and Cohen’s kappa.
To this end, the classification accuracy and Cohen’s kappa of dataset B were analysed for significant differences between healthy infants and those with specific medical conditions or treatments, such as infections, congenital heart defects, or respiratory disorders (Table 1). The potential impact of sex on classification performance was also examined. Statistical analyses included normality testing (Shapiro–Wilk test) and variance homogeneity assessment (F-test). Parametric testing procedures were applied for normally distributed data; otherwise, nonparametric tests were used. In the case of two-sample t‑tests with unequal group variances, Welch’s correction was applied.
Additionally, correlations between classification performance metrics (accuracy and Cohen’s kappa) and bodyweight at measurement, GA at birth, AHI, and Fleiss’ kappa (as an indicator of interrater variability) were evaluated using both Pearson and Spearman methods.
To further assess the applicability of the machine learning-based sleep stage classification, sleep parameters were calculated and compared with the current PSG gold standard (manual annotations). Demme et al. (2025) previously analysed the percentage of time spent in each sleep stage and the sleep bout length [5]. Expanding on this work, this paper examines sleep stage transitions. All possible transitions between manually (m) annotated and automatically (p) detected sleep stages were compared, including QS to AS, QS to W, W to AS, W to QS, AS to W, and AS to QS as well as aggregated categories, i.e. transitions between AS and QS, W and QS, and W and AS as well as the total number of sleep transitions. A paired t‑test was performed for normally distributed data and a Wilcoxon signed-rank test for nonnormally distributed data.
A p-value < 0.05 was considered statistically significant. Statistical analyses were performed using OriginPro 2019 (OriginLab, Northampton, MA, USA) and SPSS (version 29.0.0.0; IBM Corp., Armonk, NY, USA).
Comments (0)