Fluorophore Synthesis and Characterization
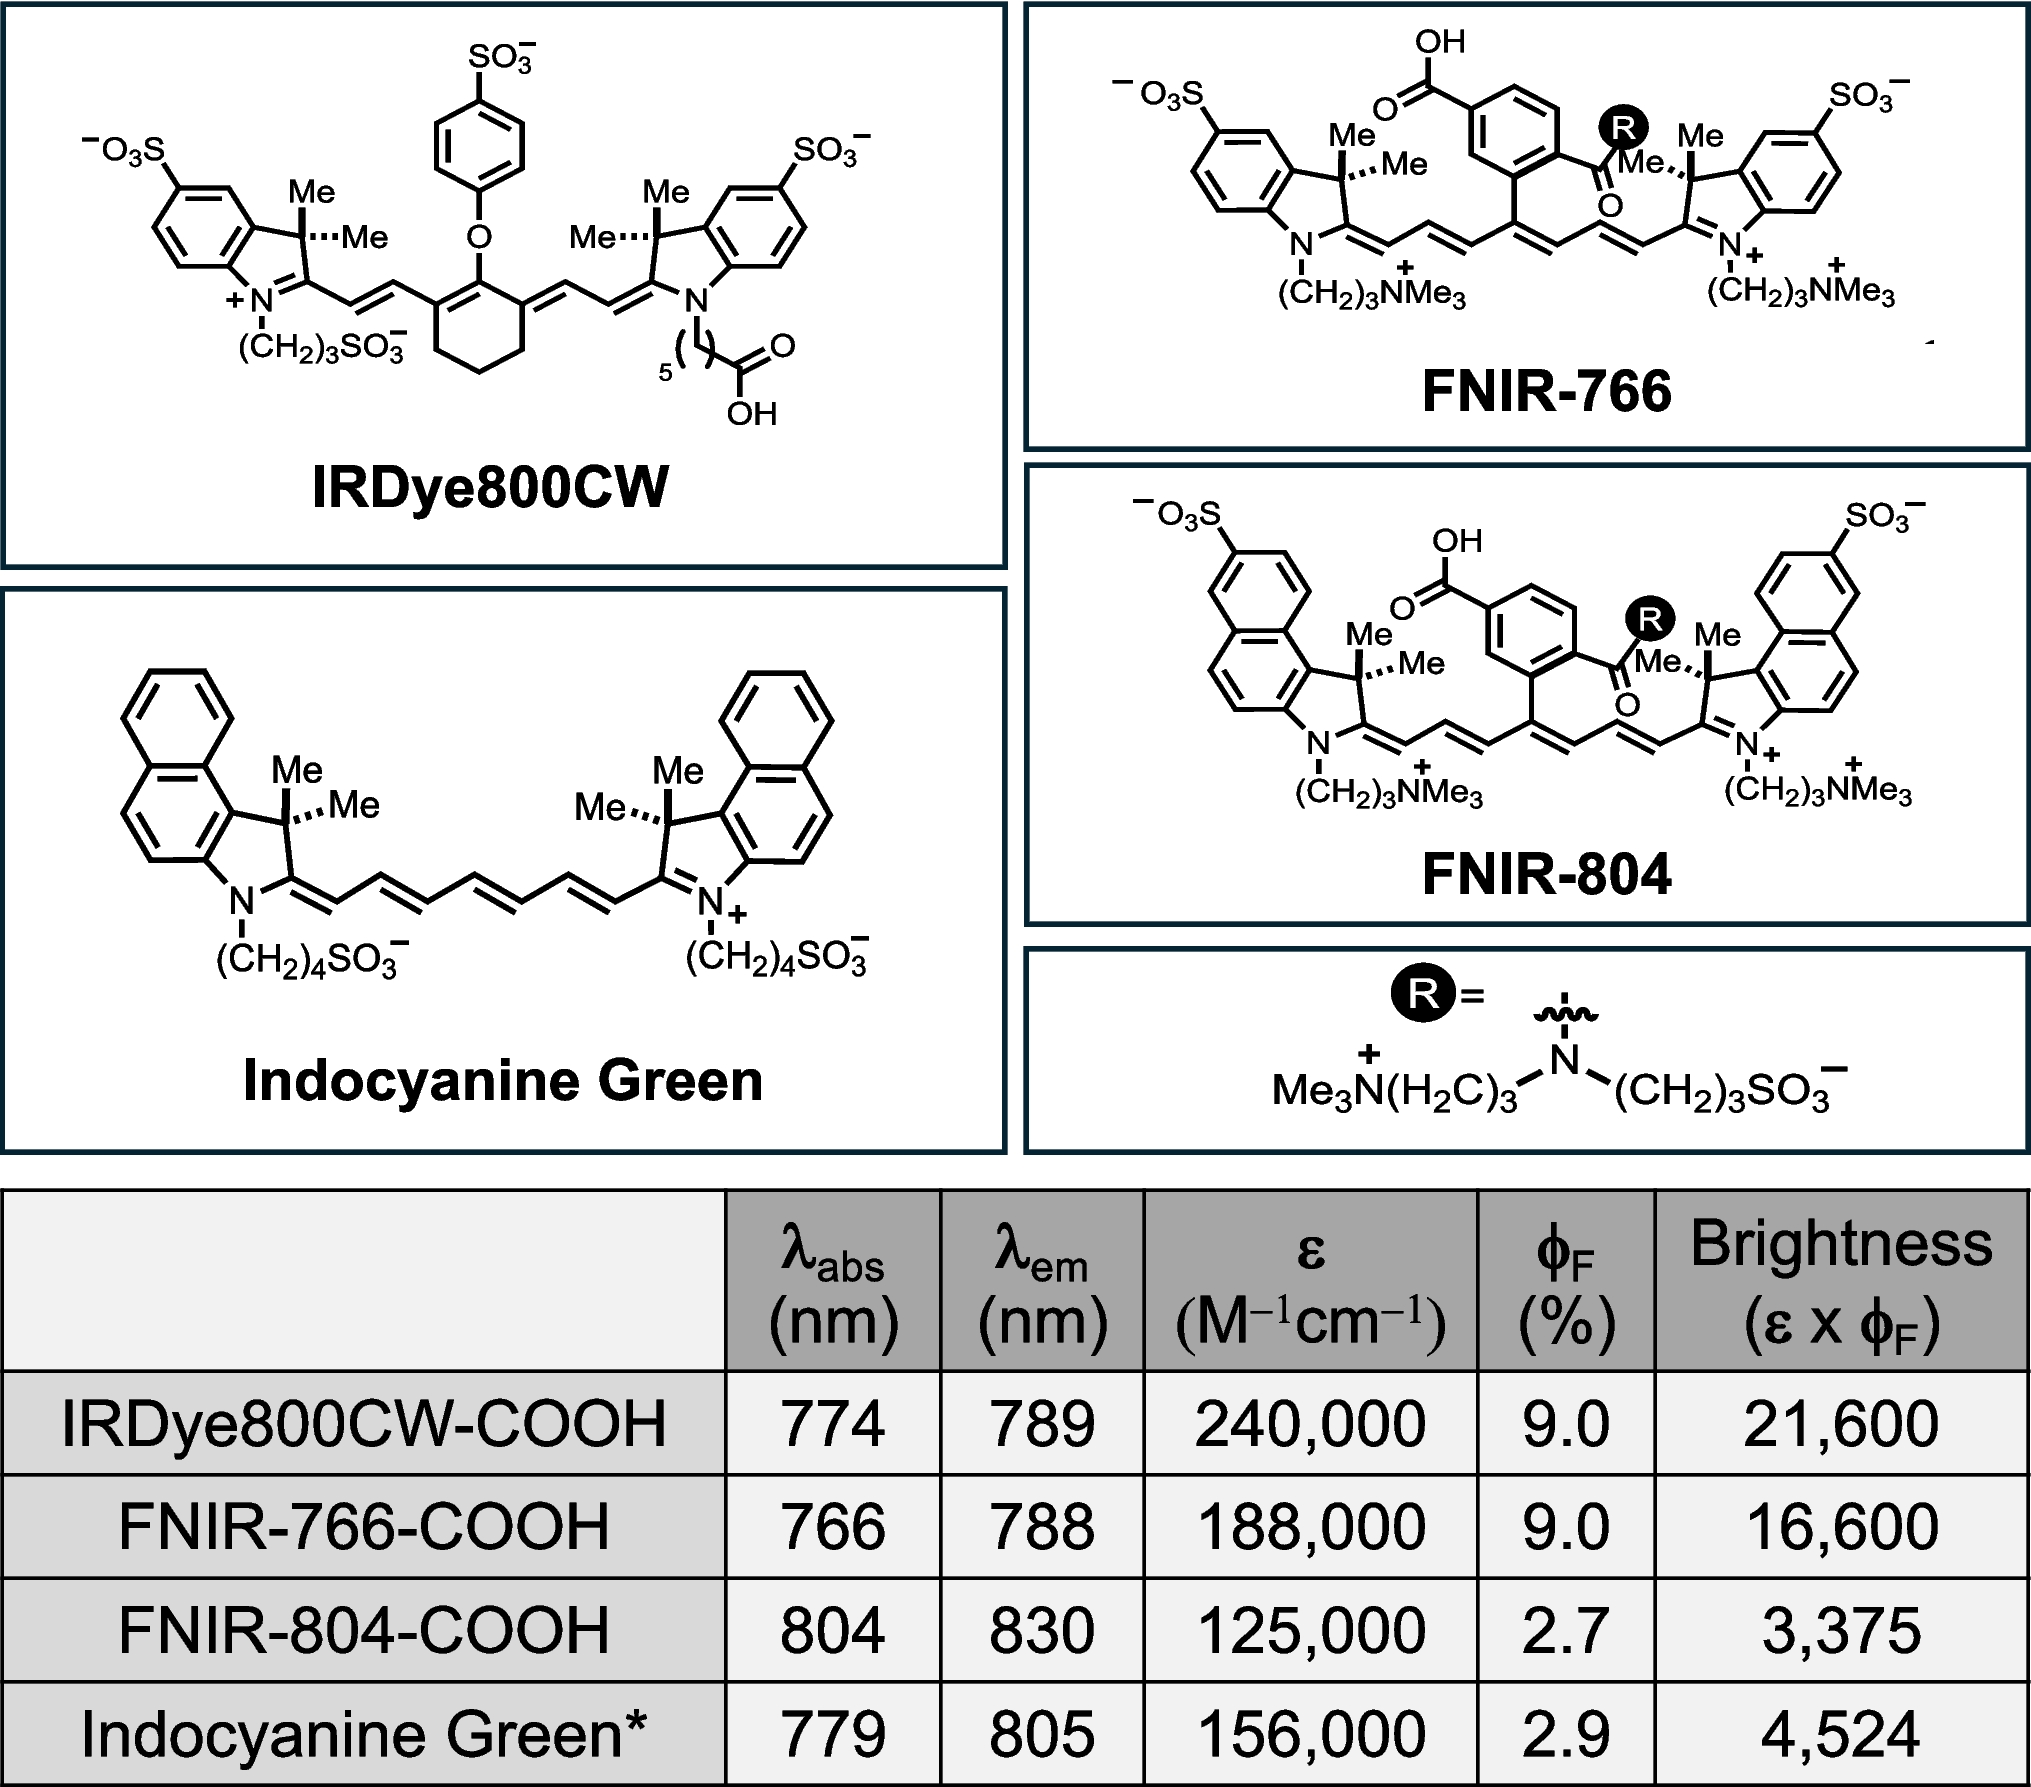
The NHS-FNIR-Tag-766 dye was synthesized as described previously [26]. The NHS-FNIR-Tag-804 dye was synthesized as described in the Supplemental Document. Both dyes were characterized as described previously [26]. In brief, molar absorption coefficients (ε) were determined in PBS (pH 7.4) using Beer’s law. Absolute quantum yields (ΦF) were measured using a Quantaurus-QY spectrometer (Hamamatsu, model C11374).
Antibody-Fluorophore Dye Conjugation
Three near-infrared dyes were used for these studies: (1) IRDye800CW NHS-Ester (excitation 775 nm, emission 796 nm) (LI-CORbio), (2) NHS-FNIR-Tag-766 (excitation 776 nm, emission 788 nm) prepared as described previously [26, 27] and (3) NHS-FNIR-Tag-804 (excitation 804 nm, emission 830 nm) see Supplemental Information for synthesis. The dyes were conjugated to the humanized anti-CEA hT84.66-M5A (M5A) mAb [28]. Conjugation was performed at a 10–15-fold molar excess of dye to antibody. Fresh dye was formulated with a concentration of 10 mg/ml prior to conjugation. The IRDye800CW solution was formulated using Ultra trace water, elemental analysis grade (Fisher Chemical, Pittsburgh, PA). The NHS-FNIR-Tag-766 and NHS-FNIR-Tag-804 were formulated in 10 mM DMSO (Protide Pharmaceuticals: Crystal Lake, IL). Conjugation buffer for the NHS-IRDye800CW was 20 mM sodium phosphate buffer solution (pH 8.5) and conjugation buffer for the NHS-FNIR-Tag-766/NHS-FNIR-Tag-804 was 250 mM phosphate buffer (pH 8.5). The reaction was incubated for 2 h at room temperature on a shaker in the dark. The resulting conjugates were called: M5A-IR800CW, M5A-FNIR-766, M5A-FNIR-804.
Purification and Characterization of Spectral Properties
The antibody dye conjugates were purified by diafiltration using an Amicon ultrafiltration stirred cell (Millipore Sigma, Burlington, MA) with a 30 kDa molecular weight cut-off membrane. After buffer exchange of 15–20 diavolumes of PBS, the antibody was recovered, and sterile filtered. The protein concentration and DOL were calculated by absorbance spectrophotometry using established equations for the free dye (Eqs. 1 and 2 below). Antibody aggregation and the presence of free dye were analyzed by High-Performance Liquid Chromatography-Size exclusion chromatography (HPLC-SEC) using a Superdex 200 column (Cytiva, Marlborough, MA). The NGC chromatography system (Biorad, Hercules, CA) monitored absorbance at wavelengths of 280 nm and 700 nm. This was equipped with an external Jasco FP4020 fluorescent detector (Jasco Inc., Easton, MD, USA) set to the peak excitation and emission wavelengths for each free dye. The absorption scan of antibody-dye conjugates in PBS was performed using the GENESYS 150 Vis/UV–Vis Spectrophotometers (ThermoFisher Scientific, Waltham, MA). These scans are used to qualitatively evaluate the formation of H-aggregates, which are indicated by an absorption shoulder or peak near 700 nm.
The DOL was calculated using Eq. 1:
$$Digree\; of \;Labeling = \frac_ \times _}_ \times [_ - \;Correction\; Factor \times _]}$$
(1)
The antibody concentration (mg/mL) was determined using Eq. 2:
$$Concentration \;(mg/ml) = Dilution\; Factor\; \times \frac \;[ -Correction\; Factor \times ]}}$$
(2)
SEC-Based Binding Assay
To confirm conjugate purity and retention of antigen binding, SEC was performed on a Superdex 200 column. Conjugates (10 µg) were analyzed alone or after a 30 min incubation with soluble CEA protein (50 µg) at 37 °C. The elution profiles were monitored by absorbance at 280 nm.
In-Vitro Studies
Serial dilutions of M5A-fluorophore conjugates in PBS were performed. Protein concentrations were as follows: 1.5 mg/mL, 1 mg/mL, 0.5 mg/mL, 0.25 mg/mL, 0.125 mg/mL, 0.0625 mg/mL, 0.03125 mg/mL, 0.0156 mg/mL. 100μL of the samples were placed in PCR tubes and imaged under the 800 nm channel using the LICOR Pearl Trilogy Small Animal Imager (LICOR Bio, Lincoln, NE).
Cell Culture
The LS174T human colon cancer cell line expressing firefly luciferase (LS174T-LUC +) was used for this study. Cells were cultured in Dulbecco's Modified Eagle Medium (DMEM) media supplemented with Fetal Bovine Serum (FBS). The cells were passaged at least twice and were 90% confluent prior to in-vivo injection.
In-Vivo Studies
All animal studies were performed in accordance with regulations set by the City of Hope and University of California, San Diego Animal Care Program under an approved IACUC protocol.
Subcutaneous Tumor Mouse Models
Nude mice received subcutaneous injection of 1 × 10⁶ LS174T-Luc + cells to establish the subcutaneous xenograft mouse models. Tumors were followed until they measured approximately 100-200mm3.
Orthotopic Mouse Models of Colorectal Cancer
Subcutaneous tumors were harvested and sliced into 1-2mm3 fragments. Mice were anesthetized per IACUC protocol. A lower abdominal laparotomy was made on recipient nude mice The sigmoid colon was extracted through the laparotomy. A tumor fragment was sutured onto the sigmoid colon using 8–0 nylon sutures to create a surgical orthotopic model of colorectal cancer [29]. The sigmoid colon was replaced into the abdominal cavity and the laparotomy was closed with 6–0 nylon sutures. Mice were monitored and pain medication was provided per IACUC protocol.
Antibody Fluorophore Conjugate Injection
Mice were fed a low fluorophore diet 5 days prior to injection of the antibody-fluorophore conjugate. Each mouse was injected with 50 ug of M5A-fluorophore conjugates intravenously via the tail vein.
Fluorescence Imaging
Mice with subcutaneous tumors were serially imaged at the following time points: 0 h, 4 h, 24 h, 48 h, 72 h, and 96 h. The number of mice analyzed per group was as follows: n = 8 for M5A-IR800CW at all time points; for both the M5A-FNIR-766 and M5A-FNIR-804 groups, n = 4 at 0–4 h, n = 9 at 24–48 h, and n = 6 at 72–96 h. At the conclusion of the non-invasive imaging studies (At 96 h), n = 6-7mice per group were euthanized for necropsy and optical biodistribution of fluorescence. Mice with orthotopic colorectal tumors (n = 2 M5A-IR800CW, n = 3 M5A-FNIR-766 and n = 3 M5A-FNIR-804) were imaged at 48 h after intravenous probe injection. Mice were euthanized and imaged non-invasively, after laparotomy, and necropsy. In-vivo imaging was performed using the Pearl Trilogy small animal imaging system (LICORbio) using the 800 nm channel with peak excitation at 785 nm and emission at 820 nm (and if applicable, bioluminescence channel) under isoflurane anesthesia [30]. The distance from the imaging lens to the tissue surface was standardized across all mice. The Pearl Trilogy imaging system has a fixed-position specimen stage and camera. All acquired images in the series were linked during analysis; any adjustments to brightness and contrast were applied globally across the entire dataset across groups. Mean fluorescence intensity (MFI) over the tumor and adjacent normal organ was measured using the ImageStudio software (LICORbio). The tumor-to-background ratio (TBR) was calculated for each animal.
Statistical Analysis
Quantitative data are presented as mean ± standard error of the mean (SEM). Statistical comparisons between the groups of conjugates was performed using a one-way analysis of variance (ANOVA) followed by Tukey’s post-hoc test for multiple comparisons. A P-value < 0.05 was considered statistically significant. All statistical analyses were performed using GraphPad Prism (Version X, GraphPad Software, San Diego, CA).
Immunohistochemistry
At the conclusion of macroscopic imaging, tissue samples were collected. Samples were placed in 4% paraformaldehyde and placed into formalin-fixed paraffin embedded blocks. The blocks were serially sectioned at 4–5 um thickness and processed for standard hematoxylin and eosin (H&E) and immunohistochemistry. The slides were deparaffinized, rehydrated and incubated with endogenous peroxydase activity inhibitor and antigen retrieval solution. The slides were incubated with biotinylated goat anti-human IgG antibody (H + L, Cat#: BA-3000) following by OmniMap anti-goat-HRP (Cat#: 760–4647) incubation. The stains were visualized by DISCOVERY ChromoMap DAB Kit (Ventana) and counterstained with hematoxylin and coverslipped. All IHC stains were performed on a Ventana Discovery Ultra IHC automated stainer (Ventana Medical Systems, Roche Diagnostics, Indianapolis, USA). Whole slide images were acquired with Zeiss Observer II Light microscope (Leica Microsystems, Buffalo Grove, IL). Fluorescence microscopy was performed on the unstained slide using the BXZ-710 microscope (Keyence America, Itasca, IL) with the ICG cube (Chroma Technology Corp, Bellows Falls, VT).

Comments (0)