Oligonucleotides
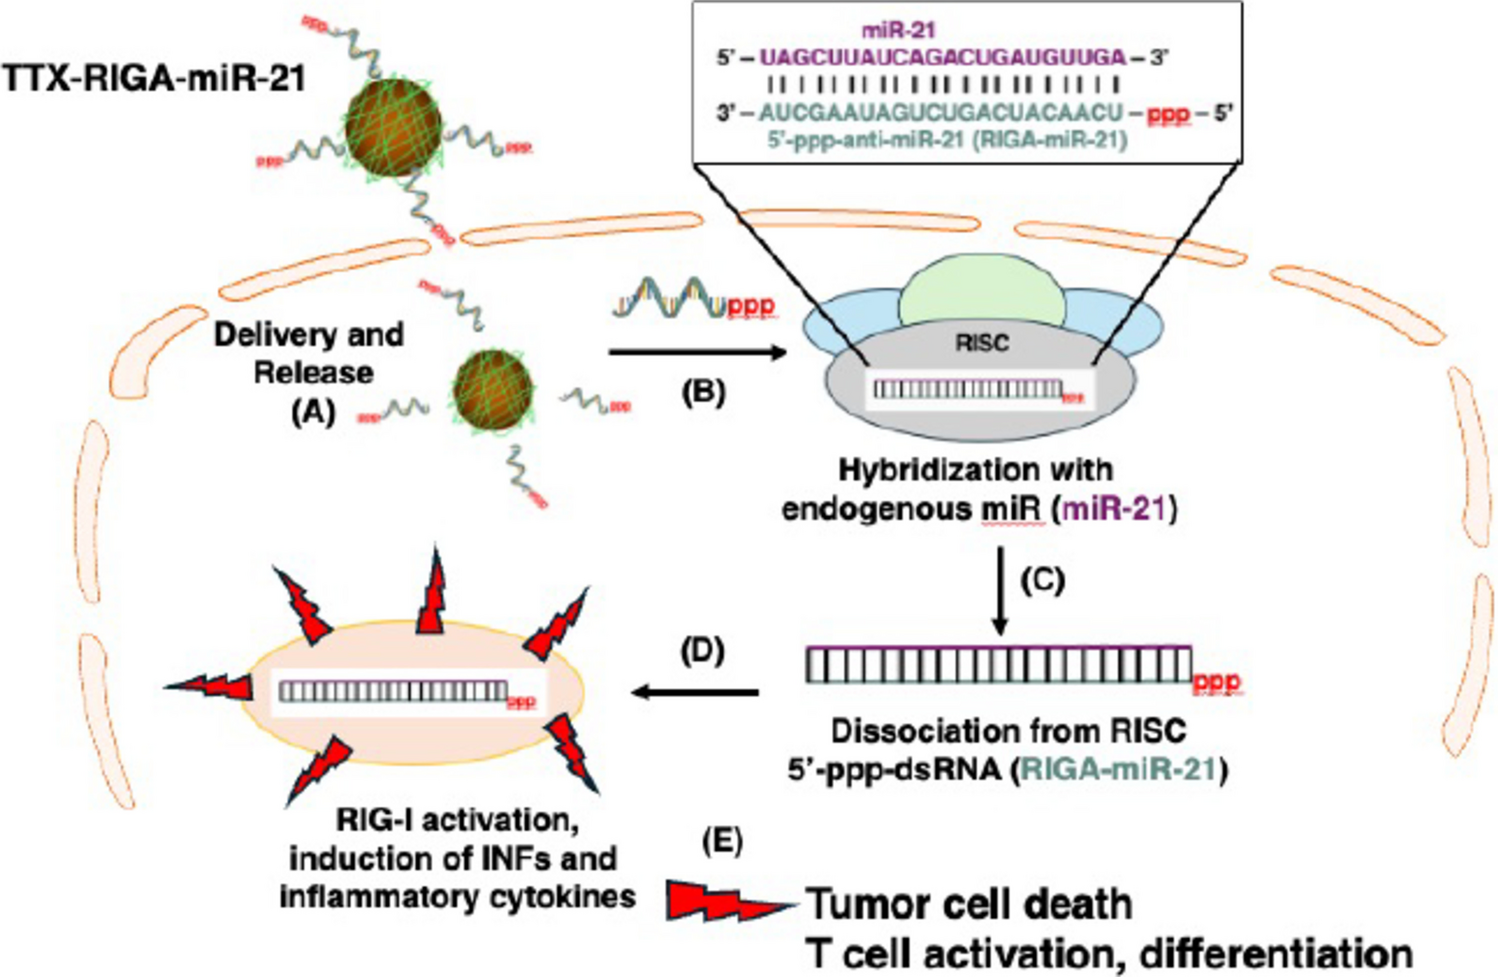
The miR-21 mimic, 5’-UAGCUUAUCAGACUGAUGUUGA-3', and its 100% complementary antisense complement, [± (ppp)]−5’-UCAACAUCAGUCUGAUAAGCUA-3’-(s–s) (termed RIGA-miR-21), were synthesized by Eurogentec (Fremont, CA). 5’-Triphosphate modification (ppp) is required for RIG-I agonism while 3’ disulfide bond (s–s) modification allows the oligos to be covalently conjugated to the nanoparticles. Antisense oligonucleotide (ASO) for miR-21 (anti-miR-21) was synthesized as well. A synthetic RIG-I agonist, 19-mer 5'-ppp-dsRNA, was obtained from InvivoGen (Catalog No. tlrl-3prna; San Diego, CA).
Cell Culture and Transfection
HEK-Lucia™ RIG-I cells, HEK-Lucia™ Null cells (Catalog No. hkl-hrigi and hkl-null; InvivoGen), or murine melanoma cells (B16-F10) were cultured in 96-well plates for 48 h in Dulbecco's Modified Eagles Medium (DMEM, Gibco; ThermoFisher Scientific, Waltham, MA) containing 10% fetal bovine serum, 100 U/mL of penicillin and 100 µg/mL of streptomycin at 37 °C, 5% CO2. Murine 4T1 murine triple negative breast cancer cells were cultured in RPMI-1640 (ThermoFisher Scientific, Waltham, MA) supplemented with 10% fetal bovine serum, 100 U/mL of penicillin and 100 µg/mL of streptomycin at 37 °C, 5% CO2. Cells were transfected using LyoVec™ cationic lipid transfection agent (see Supplementary Materials for details). In all studies miR‑21 mimic concentration was held constant across all nanoparticle doses to ensure changes in signaling reflected nanoparticle-dependent oligo delivery rather than variable template abundance.
Nanoparticle Formulation of RNA Oligos
The synthesis of oligo-nanoparticle conjugates, TTX-RIGA-miR-21 and TTX-miR-21 and their characterization followed a previously described protocol with some methodological modifications [18] (see Supplementary Materials for details).
For in vivo optical imaging and ex-vivo fluorescence microscopy nanoparticles were labeled with the Cy5.5 near infrared fluorescence dye as described in our earlier publications [17, 18].
Western Blotting
To assess protein expression of IFN-β, IP-10, phospho 65/65 and RIG-I we performed Western blot with corresponding antibodies (see Supplementary Materials for details).
RIG-I Activation Assay
Twenty µL of culture media from transfected cells was transferred to a 96-well clear-bottom black plate, 50 µL of QUANTI-Luc™ assay solution (Catalog No. rep-qlc, InvivoGen) was added to each well. Luminescence was immediately measured using a Spectramax M3 microplate reader (Molecular Devices, San Jose, CA) set at a 0.1 s of exposure. Data are presented as mean ± SD.
IFN-γ-inducible Protein 10 (IP-10/CXCL-10) Immunoassay
IP-10/CXCL10 release was assayed using the Quantikine Mouse IP-10 ELISA assay (DY466-05; R&D Systems, Minneapolis, MN) using cell-free media following the manufacturer’s instructions. The absorbance at 450 nm was measured, and the concentration of IP-10 was determined by comparison to the standards. All experiments were performed in triplicate. Data are presented as mean ± SD.
MTT Assay
The Cell Proliferation Kit I (MTT) (Product No. 11465007001; Fisher Scientific, Hampton, NH) was utilized following the manufacturer’s instructions. Ten μL of MTT was added to each cell culture and incubated for 4 h in a humidified atmosphere (e.g., 37 °C, 5% CO2). Then, 100 μL of the solubilization solution was added to each well and the plate was kept overnight in the incubator. The absorbance of the formazan product was determined at 560 nm with a reference wavelength set at 670 nm.
Caspase-3/7 Activation and Viability Assays
Caspase-3/7 activity was determined using the Caspase-Glo 3/7 Assay Kit (Catalog No. G8091; Promega, Madison, WI) following the manufacturer’s instructions. Cell cultures were equilibrated to RT, and 100 µL of Caspase-Glo® 3/7 Reagent was added to each well. Plates were incubated at RT for 1 h and luminescence was measured. Cell viability was determined using CellTiter-Glo® 2.0 Assay after 48 h of incubation according to manufacturer’s instructions.
IFN-β Induction Assay
IFN-β production was analyzed using 50 µL of culture supernatant by mouse IFN-β ELISA Kit (LEGEND MAX™ Mouse IFN-β ELISA Kit, Catalog No. 439407; BioLegend, San Diego, CA) following the manufacturer’s instructions. Absorbances at 450 nm were determined.
RT-qPCR
To assess expression of miR-21, RIG-I, IFN-β, IP-10 and TRAIL we employed RT-qPCR (see Supplementary Materials for details and list of primers).
In vivo Imaging of Tumoral Delivery
Mice (C57BL/6 J, 8-week-old) were obtained from the Jackson Laboratory. B16-F10 melanoma cells (1 × 10⁵) were subcutaneously injected into the right flank. To assess the delivery, mice were imaged using in vivo fluorescence and magnetic resonance imaging (FLI and MRI, see Supplementary Materials for details). Quantification of nanoparticle delivery was performed by measuring tumor ROI radiance normalized to background and by calculating change in T2* relaxation time following nanoparticle administration.
Therapeutic Studies in a Mouse Melanoma Model
Mice bearing B16-F10 tumors were randomized into three groups (n = 5/group). Mice were intravenously treated with TTX-RIGA-miR-21 (400 µg/kg) or PBS and intratumorally with 5’-ppp-dsRNA (1 µg/mouse). Treatments started on Day 4 after tumor implantation and continued daily for 7 d. On Day 15, additional B16-F10 cells (1 × 10⁵) were implanted on the opposite side (Supplementary Fig. S1). Tumor sizes were measured with calipers. Tumor volumes were calculated using Vtumor = (L x W2) × 0.5. Mice were euthanized when tumors reached their allowed maximum volume. Data analysis was carried out by a blinded investigator. Animal studies were approved by the Institutional Animal Care and Use Committee (IACUC) at Michigan State University and are in compliance with the National Institutes of Health Guide for the Care and Use of Laboratory Animals.
Ex vivo Fluorescence Microscopy
After the last imaging session, animals were sacrificed, tumors were excised, snap frozen in OCT and cryosectioned into 10 µm sections. Sections were placed on glass slides, and fixed in 4% paraformaldehyde (PFA) for 15 min. The slides were then rinsed with PBS and mounted with Fluoromount-G mounting medium (Southern Biotech, Birmingham, AL, USA) containing 4',6-diamidino-2-phenylindole (DAPI). Slides were then imaged in Cy5.5 and DAPI channels using a Nikon Eclipse 50i microscope.
Statistical Analysis
Statistical analysis was performed using GraphPad Prism 9.5.1 (GraphPad Software, San Diego, CA). Data are presented as mean ± SD or SEM. Two-tailed t-tests were used in all analyses except dose response, which was analyzed using non-linear regression. A p value of less than 0.05 was considered statistically significant.

Comments (0)