
Remember me
This retrospective study received Institutional Review Board (IRB) approval with waivers for patient informed consent and Health Insurance Portability and Accountability Act (HIPAA) authorization.
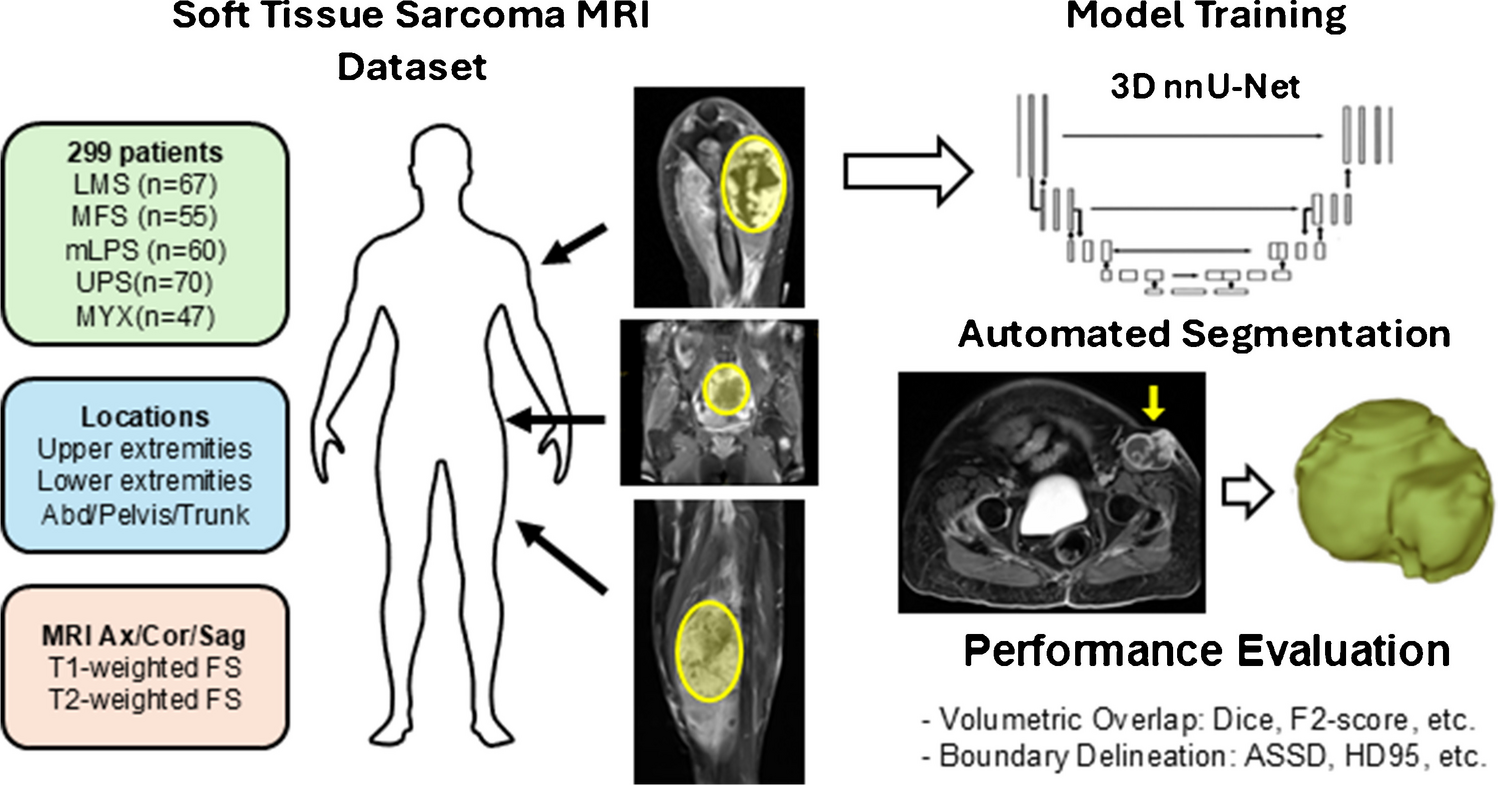
A patient cohort was assembled by searching the institutional electronic data warehouse (EDW) for patients with biopsy-proven soft tissue sarcoma (STS) who underwent pre-treatment magnetic resonance imaging (MRI) of the primary tumor between January 2004 and December 2022. Following the search, anonymized MRI scans were retrieved from the institutional picture archiving and communication system (PACS). Patients were included if their scan had at least one T1-weighted fat-saturated contrast-enhanced (T1 FS CE) or fat-saturated T2-weighted (T2 FS) sequence. Per standard clinical protocols, these sequences were routinely acquired in the axial, coronal, and sagittal planes with sub-millimeter in-plane resolution. This multi-planar approach was crucial for accurately delineating the tumor’s three-dimensional anatomy, heterogeneity, and relationship with adjacent structures, especially given the frequently elongated morphology of sarcomas. The study workflow is summarized in Fig. 1.
Fig. 1
Schematic of the soft tissue tumor automated segmentation workflow
From an initial group of approximately 780 patients, a final cohort of 299 was selected. To ensure reliable model training and performance evaluation for each histology, we included only the five largest mesenchymal tumor subgroups: leiomyosarcoma (LMS; n = 67), myxofibrosarcoma (MFS; n = 55), myxoid liposarcoma (mLPS; n = 60), undifferentiated pleomorphic sarcoma (UPS; n = 70), and intramuscular myxoma (MYX; n = 47). The inclusion of MYX, a benign sarcoma mimic, provided an important control cohort for evaluating model specificity. These subtypes represent the most prevalent and clinically relevant entities encountered in our practice and offered well-balanced case distribution for model development.
MRI acquisition, image preprocessing, and tumor segmentationThe final MRI dataset comprised 248 T1-weighted axial, 208 T1-weighted coronal, 180 T1-weighted sagittal, 224 T2-weighted axial, 217 T2-weighted coronal, and 171 T2-weighted sagittal scans. To ensure uniformity and reproducibility across the dataset, all scans underwent standardized preprocessing procedures [25]. First, N4 bias field correction was applied to mitigate intensity non-uniformities arising from magnetic field inhomogeneities and scanner imperfections [26]. Next, image intensities were normalized using Z-score standardization, harmonizing signal distribution across scans and patients [27]. Finally, all images were resampled to an isotropic voxel size of 1 mm3 using fifth-degree Lagrangian polynomial interpolation [28] to standardize spatial resolution and facilitate 3D convolutional processing.
Manual tumor segmentation was performed using LIFEx (version 7.6, Orsay, France) [28] by trained radiologists (L.P., N.G., M.S.) experienced in sarcoma imaging and a fourth-year medical student (Z.K.) trained in sarcoma image analysis. Lesions were segmented volumetrically across all available fat-saturated, contrast-enhanced T1-weighted and fat-saturated T2-weighted MRI sequences across all planes. All segmentations underwent independent cross-review by two senior radiologists (L.P. and N.G.) to ensure accuracy, anatomical completeness, and inter-rater consistency.
Tumor segmentation modelWe utilized a 3D full-resolution nnU-Net, a self-configuring deep learning framework based on the U-Net architecture that automatically optimizes its own network depth, patch size, and batch size for a given dataset [29]. For this study, the dataset was partitioned into training (70%) and testing (30%) sets, with model development performed on the training set using fivefold cross-validation. To determine the optimal input strategy, we trained separate models for each imaging plane (axial, coronal, and sagittal) across three distinct sequence configurations: T1-weighted only, T2-weighted only, and combined T1-weighted and T2-weighted (T1 + T2) inputs. This design enabled assessment of both technical factors (input modality and orientation) and information fusion strategies on segmentation performance.
During training, we employed extensive data augmentation, including random rotations, scaling, Gaussian noise, gamma correction, and mirroring [30]. The nnU-Net framework automatically configured a patch size of 160 × 112 × 128 voxels and a batch size of 2 to optimize GPU memory usage. Models were trained for 1000 epochs using a combined Dice and cross-entropy loss function. The network optimizer was stochastic gradient descent (SGD) with Nesterov momentum (0.99) [31], an initial learning rate of 0.01, and a weight decay of 3 × 10⁻5. At inference, predictions were generated using a sliding window approach with Gaussian importance weighting to ensure smooth segmentation maps.
Statistical analysisModel performance was comprehensively evaluated using both volumetric overlap and boundary delineation accuracy metrics. For volumetric overlap, we computed the Dice Similarity Coefficient (Dice), Precision, Recall, and the F2 score. For boundary accuracy, we used the Average Symmetric Surface Distance (ASSD) and the 95th Percentile Hausdorff Distance (HD95). All performance metrics were summarized using the median and interquartile range (IQR) given the non-normal distribution of the data. For model selection, the F2 score was chosen as the primary metric and ASSD as a secondary one.
We selected the F2 score as our primary metric because, from a clinical standpoint, under-segmenting a tumor (a false negative at the voxel level) is a more severe error than slight over-segmentation. Inadvertently leaving residual tumor behind due to under-segmentation can lead directly to local recurrence, whereas minor overestimation might result in a slightly larger but still safe surgical margin. This prioritization aligns with the critical surgical objective of achieving a complete tumor resection with negative margins. The model with the highest median F2 score and the smallest median ASSD was selected as the optimal performer for each category (tumor subtype, location, and overall).
Comments (0)