
Remember me
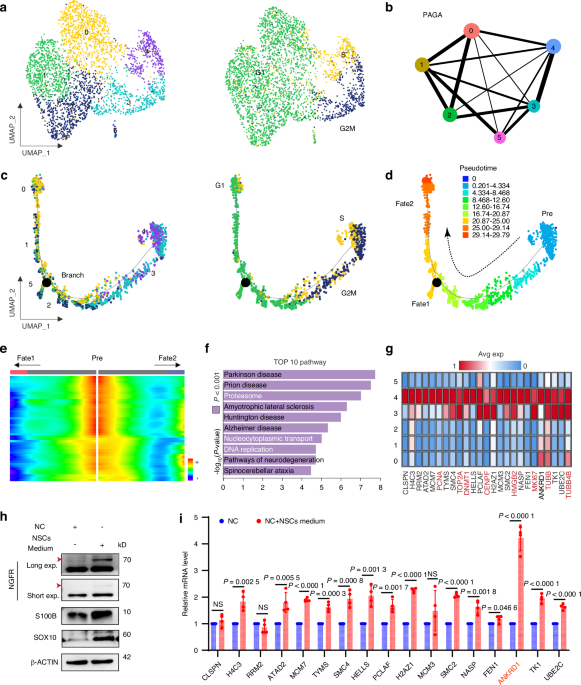
To profile the neurogenic potential related molecular signatures of neural crest-derived BMSCs, we analyzed single-cell RNA sequencing data of human BMSCs. Using UMAP dimensionality reduction and clustering, we mapped six distinct cell clusters (0–5) based on transcriptomic profiles and classified clusters according to cell cycle phases (G1, S, G2M) (Fig. 1a). We observed that clusters 0–5 predominantly occupied the G1, S, and G2M phases, indicating heightened proliferative activity (Fig. 1a). Then, partition-based graph abstraction (PAGA) analysis demonstrated the connectivity between these six clusters, with cluster sizes and transition probabilities reflected by node size and string thickness, respectively (Fig. 1b). Further pseudotime trajectory analysis identified a developmental progression from a progenitor state (Pre) to differentiated states (Fate1 and Fate2), with cluster 4 (purple) as a progenitor population occupied the earliest position on the trajectory and exhibited the lowest pseudotime value (Fig. 1c, d). These data suggest that cluster 4 may represent as a progenitor state in BMSCs.
Fig. 1
ANKRD1 is a vital marker gene in neural progenitor BMSCs. a Uniform Manifold Approximation and Projection (UMAP) plot derived from single-cell RNA sequencing data from Gene Expression Omnibus (GEO) repositories (GSE113253) reveals transcriptional heterogeneity within BMSCs. Color-coded and numerically labeled clusters represent distinct subpopulations, demonstrating the diversity of transcriptional states present in the BMSCs (left panel). UMAP projection of single-cell RNA sequencing data delineates BMSCs by cell cycle phase (G1, S, G2/M), characterized by a dominant G1-phase population alongside smaller but distinct S-phase and G2/M-phase subsets (right panel). b Partition-based graph abstraction (PAGA) was employed to analyze and visualize differentiation trajectories. c, d Pseudotime trajectory analysis of single-cell transcriptomes visualizing developmental progression from progenitor to differentiated states. Cluster 4 (purple), identified as the progenitor population (Pre) with the lowest pseudotime values, occupies the trajectory origin before branching into two distinct differentiated states (Fate1 and Fate2). e Differential gene expression heatmapping reveals progressive downregulation of neural crest progenitor-associated genes during Pre toward Fate 1 and Fate 2 trajectories. f Kyoto Encyclopedia of Genes and Genomes (KEGG) enrichment analysis during Pre toward Fate 1 and Fate 2 trajectories. The bar plots display the top 10 enriched terms. g Top 25 elevated marker genes in cluster 4. h Western blotting against neural markers in BMSCs cultured in NSCs medium (DMEM/F12 + 1 × B27 + 20 ng/mL bFGF + 20 ng/mL EGF + 1%–2% penicillin-streptomycin) versus untreated controls. i QRT-PCR analysis of cluster 4-enriched genes (non-proliferative) in NSCs-treated versus untreated BMSCs
To further characterize the progenitor state, we conducted differential gene expression heatmapping and top-ranked pathway enrichment analysis. The finding revealed progressive downregulation of neural crest progenitor-associated genes during progenitor state toward differentiated states (Fig. 1e). Meanwhile, we identified a significant enrichment of neurodegenerative pathways including Parkinson’s, Alzheimer’s, and Huntington’s diseases–implying a significantly decline of neural function in the process of differentiation (Fig. 1f). Subsequently enrichment analysis of marker genes in cluster 4 illustrated the core transcriptomic network driving its biological identity. Among the top 25 elevated markers, key cell cycle regulators (TOP2A, PCNA, MKI67, CENPF) showed pronounced upregulation, indicating robust proliferative capacity (Fig. 1g). Moreover, violin plot analysis captured concurrent enrichment of neural sensors (PIEZO1, PIEZO2, ORAI1, FUS, SCN9A) and pro-proliferative transcription factors (KLF4, KLF2, MAPK1, SON, HMGB2) (Fig. S1a). These findings collectively show cluster 4 as a self-renewing neuro-progenitor niche with intrinsically coupled proliferative and neural developmental capacities.
Given the established association between progenitor-like BMSCs and neural development, we sought to identify specific markers governing their neurogenic potential. To this end, we incubated BMSCs in neural stem cells (NSCs) medium (3 days). The results revealed a robust upregulation of peripheral nervous system markers (NGFR, SOX10, S100B) following induction (Figs. 1h and S1b). Furthermore, qPCR quantification of top-enriched genes in cluster 4 (excluding proliferation-associated genes) demonstrated upregulated expression of multiple top genes, suggesting their critical role in maintaining BMSCs’ neurogenic properties (Fig. 1i). Among all the genes, ANKRD1 exhibited significantly higher expression under induction (Figs. 1i and S1c), demonstrating its potential involvement in neural health and neurogenic function. These findings implicate the potential role of ANKRD1 in sustaining neural progenitor characteristics of BMSCs.
Downregulation and blocked nuclear localization of ANKRD1 in aging BMSCsCraniofacial morphogenesis originates from neural crest cells (NCCs), the neurogenic properties diminish progressively and concomitant with cellular senescence during organismal aging.34,35,36 To investigate the role of ANKRD1 in this process, we first examined its involvement in the aging of BMSCs. As expected, ANKRD1 expression was significantly downregulated in replicative senescent BMSCs, revealing consistent suppression at both transcriptional and translational levels during BMSC aging (Fig. 2a, b). Critically, parallel evaluation of ANKRD1 expression in BMSCs isolated from human donors with different ages echoed these findings, which further validating an age-associated attenuation of this neurogenic regulator (Fig. 2c). To further investigate whether ANKRD1 regulates the senescence phenotype of BMSCs, we overexpressed ANKRD1 in aged BMSCs and knocked down its expression using shRNA in young BMSCs. We then evaluated both mRNA and protein levels of key senescence-associated secretory phenotype (SASP) components, along with classical cellular senescence markers (p53, p21, and p16). The results shown that knockdown of ANKRD1 in young BMSCs resulted in a marked upregulation of all examined senescence and SASP markers (Fig. 2d, e), while overexpression of ANKRD1 in aged BMSCs led to a significant downregulation of these markers (Fig. S2a, b). These findings indicate that ANKRD1 actively suppresses senescence-associated phenotypes and plays a crucial role in preserving the youthful, proliferative state of BMSCs.
Fig. 2
Downregulation and blocked nuclear localization of ANKRD1 in aging BMSCs. a Western blot analysis of ANKRD1 and senescence-associated markers (p53, p21, and p16) in early-passage (passage 2) and late-passage (passage 25) BMSCs. b qRT-PCR quantification of mRNA levels of ANKRD1 and senescence-associated markers in passage 2 and passage 25 BMSCs. c Western blot analysis of ANKRD1 and senescence-associated markers in BMSCs derived from young (26–33 years) and aged (66–78 years) donors. d Western blot analysis of senescence-associated markers in young BMSCs transduced with control vector (shPLKO.1) or ANKRD1-specific shRNAs (shANKRD1-1 and shANKRD1-2). e qRT-PCR analysis of senescence-associated markers in young BMSCs transduced with control vector (shPLKO.1) or ANKRD1-specific shRNAs (shANKRD1-1 and shANKRD1-2). f Representative high-magnification immunofluorescence images of ANKRD1 staining in young (upper panels) and aged (lower panels) BMSCs. Nuclei were counterstained with DAPI (blue). Scale bar, 10 μm
Moreover, immunofluorescence analysis further revealed that cellular senescence triggers both quantitative decrease and spatial reorganization of ANKRD1 (Fig. 2f). This underwent nuclear re-localization from a diffuse nucleoplasmic pattern to perinuclear enrichment along the nuclear lamina (Fig. 2f). These dynamic changes suggest that ANKRD1 may serve as a key transcriptional regulator in BMSCs, and that its regulatory activity is substantially impaired during cellular senescence, potentially contributing to the progressive loss of stemness and neurogenic potential.
ANKRD1 maintains the multipotent state of BMSCsPrevious studies found that the neurogenic characteristics of BMSCs disappeared quickly after terminal osteogenic differentiation.37 To profiled dynamics ANKRD1 expression during BMSCs lineage differentiation, BMSCs were subjected to osteogenic and adipogenic induction media. Successful osteogenesis was confirmed by Alizarin Red S staining of mineralized nodules, while adipogenesis was verified through Oil Red O visualization of lipid droplets (Fig. 3a, d). We found that terminally differentiated BMSCs exhibited a pronounced reduction of ANKRD1 expression compared to undifferentiated controls (Fig. 3b, c, e, f). To further explore the relationship between ANKRD1 expression and the differentiation status of BMSCs, we performed ANKRD1 knockdown and overexpression experiments. The results showed that knockdown of ANKRD1 significantly upregulated both osteogenic markers (ALPL and Osterix) and adipogenic markers (CEBPA and PPARγ) (Fig. S2c–f). In contrast, overexpression of ANKRD1 led to marked downregulation of these lineage-specific markers (Fig. 3g–j). These findings indicate that ANKRD1 plays a critical role in suppressing premature lineage commitment, thereby helping to preserve the multipotent, undifferentiated state of BMSCs.
Fig. 3
ANKRD1 maintains the multipotent state of BMSCs. a Oil Red O staining of lipid droplets in BMSCs after 21 days of adipogenic induction in vitro. Scale bar, 40 μm. b, c Western blot and qRT-PCR analyses of ANKRD1 and adipogenic markers (CEBPα and PPARγ) in control and adipogenic-induced BMSCs (21 days). d Alizarin Red S staining of mineralized nodules in BMSCs after 21 days of osteogenic induction in vitro. Scale bar, 40 μm. e, f Western blot and qRT-PCR analyses of ANKRD1 and osteogenic markers (ALPL and Osterix) in control and osteogenic-induced BMSCs (21 days). g, h Western blot and qRT-PCR analyses of ANKRD1 and osteogenic markers (ALPL and Osterix) in BMSCs transduced with empty vector (pCDH) or ANKRD1 overexpression vector (pCDH-ANKRD1). i, j Western blot and qRT-PCR analyses of ANKRD1 and adipogenic markers (CEBPA and PPARγ) in BMSCs transduced with empty vector (pCDH) or ANKRD1 overexpression vector (pCDH-ANKRD1)
ANKRD1 occupies super-enhancers to sustain multipotency in BMSCsTo further elucidate the mechanisms underlying ANKRD1-mediated maintenance of multipotency, we comprehensively profiled its genome-wide occupancy using Cleavage Under Targets and Tagmentation (CUT&TAG) in undifferentiated and osteogenic-differentiated BMSCs. Peak distribution analysis revealed prominent enrichment of ANKRD1 binding sites around transcription start sites (TSSs), indicating a primary role in transcriptional initiation (Fig. S3a, b). Principal component analysis (PCA) clearly separated undifferentiated from osteogenic-differentiated BMSCs, confirming distinct chromatin landscapes (Fig. 4a). Genomic distribution analysis shown that the proportions of ANKRD1 peaks in promoters, introns, exons, and proximal intergenic regions remained largely unchanged during differentiation, whereas the proportion in distal intergenic regions decreased significantly (Figs. 4b and S3c). These observations led us to hypothesize that differentiation may impair ANKRD1-dependent long-range regulatory interactions with distal genes.
Fig. 4
ANKRD1 occupies super-enhancers to sustain multipotency in BMSCs. a Principal Component Analysis (PCA) plot showing clear separation between undifferentiated (blue spheres) and differentiated (Induced osteogenic differentiation) (red spheres) BMSCs (n = 2/group). b Pie charts depicting the positional annotation of ANKRD1 CUT&TAG peaks, classified by genomic features in priority order: promoters, 5′UTRs, 3′UTRs, exons, introns, downstream region, and distal intergenic regions. c Hockey stick plots of the rank order of ANKRD1 signals for all enhancers in undifferentiated and differentiated BMSCs. Inserted panels of selected GO functional categories of active SE-associated genes. The red arrow indicates the neuro-related SEs. d Western blotting analysis of ANKRD1 and stem-related markers (NESTIN, OCT4, KLF5, KLF4, NANOG, SOX2) in BMSCs following transduction with pCDH and pCDH-ANKRD1. (e–g) KEGG, GO and disease ontology (DO) enrichment analysis on differential peaks in ANKRD1 CUT&TAG data between undifferentiated and differentiated groups
We next identified active super-enhancers (SEs) using the ROSE algorithm, detecting 1 401 SEs in undifferentiated BMSCs compared to only 458 in differentiated cells (Fig. 4c). Gene Ontology (GO) biological process enrichment analysis of genes associated with the top 100 ANKRD1-bound SEs revealed striking enrichment for neurogenic pathways—including axon guidance, neuronal migration, and axonogenesis—in undifferentiated BMSCs. In contrast, these neural-related signals were markedly diminished in the differentiated group (Fig. 4c). Notably, strong ANKRD1 occupancy was observed at SEs associated with key neural determinants SOX2 and NESTIN exclusively in undifferentiated BMSCs (Fig. 4c).
To directly evaluate ANKRD1’s functional interaction with SOX2- and NESTIN-associated enhancer regions, we constructed luciferase reporter plasmids harboring these elements and co-transfected them with a Renilla normalization control. Overexpression of ANKRD1 significantly activated both SOX2 and NESTIN enhancer-driven luciferase activity, whereas ANKRD1 knockdown markedly suppressed it; co-overexpression effectively rescued the repression (Fig. S4a, b). Furthermore, under osteogenic and adipogenic induction conditions—where enhancer activity normally declined—ANKRD1 overexpression substantially restored reporter signals (Fig. S4a, b). Together, these data demonstrate that ANKRD1 preserves BMSC progenitor identity by directly engaging neurogenic chromatin domains and maintaining the activity of key neural super-enhancers, particularly those governing SOX2 and NESTIN.
Given that ANKRD1 robustly activates NSC marker genes in undifferentiated BMSCs, we next asked whether it also enhances overall stemness. We found overexpression of ANKRD1 significantly upregulated multiple stemness-associated genes (OCT4, KLF4, KLF5, NANOG, and SOX2) (Figs. 4d and S4c). These findings were further corroborated by RNA-seq transcriptome profiling following ANKRD1 overexpression, which showed consistent changes in stemness-related gene expression (Fig. S4d), supporting a role for ANKRD1 in reinforcing the multipotent state. Furthermore, we also performed Kyoto Encyclopedia of Genes and Genomes (KEGG), Gene Ontology (GO), and Disease Ontology (DO) enrichment analyses on genes associated with differential ANKRD1 binding peaks between undifferentiated and differentiated BMSCs. KEGG pathway analysis revealed significant enrichment in neurogenic signaling pathways in the undifferentiated group, including axon guidance, glutamatergic synapse, GABAergic synapse, and calcium signaling (Fig. 4e). GO biological process analysis highlighted prominent terms related to neuron differentiation, neurogenesis, and axon projection (Fig. 4f). DO analysis further uncovered strong associations with neuropsychiatric and cognitive disorders in the undifferentiated group (Fig. 4g). Taken together, these results position ANKRD1 as a central epigenetic regulator that sustains the neurogenic potential of BMSCs in their progenitor state by directly modulating core neurodevelopmental programs.
ANKRD1 sustains divergent chromatin dynamics at SOX2 and NESTIN loci in BMSCsSOX2 and NESTIN are hallmark markers of neuroepithelial progenitors, exhibiting dynamic expression patterns during organismal development.38,39 To further interrogate their chromatin dynamics during BMSC differentiation and aging, we integrated Hi-C and CUT&TAG multi-omics analyses across undifferentiated, differentiated, and aged states. Our results revealed distinct behaviors at these loci. SOX2 stably resides at topological associating domain (TAD) boundaries, preserving conserved chromatin interactions across differentiation and aging (Fig. 5a). This architectural stability underscores SOX2’s role in maintaining genomic organization. In contrast, NESTIN, located within a TAD interior, underwent marked structural remodeling during differentiation and aging, manifested as TAD contraction and weakened intra-domain interactions (Fig. 5c). These alterations profoundly disrupted its regulatory landscape, contributing to reduced expression. Integration of CUT&TAG data with chromatin accessibility (DNase-seq) and insulator (CTCF) signals further illuminated ANKRD1’s regulatory influence. At the SOX2 locus, undifferentiated BMSCs displayed robust ANKRD1 occupancy, heightened chromatin accessibility, and strong CTCF binding, whereas differentiation and aging were associated with diminished ANKRD1 signal and reduced openness (Fig. 5b). Analogous patterns were observed at the NESTIN locus (Fig. 5d). Collectively, these findings position ANKRD1 as a critical factor that sustains an open, permissive chromatin state at both SOX2 and NESTIN in undifferentiated BMSCs, thereby preserving a molecular reservoir for neural differentiation potential.
Fig. 5
ANKRD1 sustains divergent chromatin dynamics of SOX2 and NESTIN in BMSCs. a Hi-C contact maps for undifferentiated, differentiated and aged BMSCs at SOX2 locus. The Hi-C map displays the chromatin interaction frequencies, with red boxes highlighting the SOX2. The color gradient represents the interaction frequencies, with red indicating higher contact frequencies. b Integrative Genomics Viewer (IGV) visualization of ANKRD1 binding and DNase I hypersensitivity at the SOX2 locus in undifferentiated and differentiated BMSCs, along with CTCF signals in undifferentiated and aged BMSCs (green). c Hi-C contact maps for undifferentiated, differentiated and aged BMSCs at NESTIN locus. The Hi-C map displays the chromatin interaction frequencies, with red boxes highlighting the NESTIN region. The color gradient represents the interaction frequencies, with red indicating higher contact frequencies. d Integrative Genomics Viewer (IGV) visualization of ANKRD1 binding and DNase I hypersensitivity at the NESTIN locus in undifferentiated and differentiated BMSCs, along with CTCF signals in undifferentiated and aged BMSCs (green)
ANKRD1 reverses aging related spatial memory deficits via neuron-targeted overexpressionNext, to investigate the role of ANKRD1 in neurogenic maintenance, we conducted behavioral analyses in natural aging model mice. Considering the necessity for the virus to cross the blood-brain barrier (BBB) and transduce neuronal cells, we employed an adeno-associated virus (AAV) construct containing the neuron-specific Syn promoter. We systemically delivered either AAV overexpressing ANKRD1 (experimental group, n = 8) or control AAV (control group, n = 8) via tail vein injection into aged (18-month-old) mice. AAV-mediated expression usually peaked within 4 weeks. Accordingly, we performed animal imaging in vivo after 4 weeks injection to confirm the ANKRD1 expression. Consistent with our expectations, the ANKRD1 signal was predominantly detected in the head, dorsal region, and hindlimbs of the animals (Fig. 6a). Following in vivo imaging, mice underwent behavioral assessments to evaluate neurological functions. Open field testing (OFT) revealed no significant alterations in overall locomotor activity (e.g., total distance traveled, average speed) upon ANKRD1 overexpression mouse (Fig. 6b–d). Similarly, analysis of movement trajectories demonstrated no significant difference between experimental and control groups in either the crossing frequency or time durations in the central zone, the quadrilateral regions, and four-cornered regions (Fig. 6e–h). These data reveal no significant differences in anxiety-like behaviors or motor ability between the two groups.
Fig. 6
ANKRD1 reverses aging related spatial memory deficits via neuron-targeted overexpression. a Tail vein injection of either pAAV-Syn-ANKRD1-P2A-LUC (experimental, n = 8) or pAAV-Syn-LUC (control, n = 8) in 18-month-old C57BL/6J mice (2 × 10¹¹ vg per mouse), with bioluminescence imaging (Day 21 post-injection) revealing greater brain signal. b–d Representative locomotor traces and quantitative statistics (total distance traveled, average speed) of control and ANKRD1-overexpressing mice in the Open field test (OFT). e–g Quantitative statistics of crossing frequency, central zone duration and quadrilateral region duration of control and ANKRD1-overexpressing mice in the OFT. h Representative open field exploration heatmap and quantitative analysis of duration in corner zones showing no significant corner preference in ANKRD1 overexpression mice versus controls. i Quantitative statistics of average swimming speed of control and ANKRD1-overexpressing mice in the Morris water maze experiment. j Quantification of average time to locate the hidden platform across training days for control versus ANKRD1-overexpressin mice. k Representative locomotor traces of control and ANKRD1-overexpressing mice in the Morris water maze experiment. l Percentage of time spent in the second quadrant by control and ANKRD1-overexpressing mice during the MWM. m Quantification of the number of crossings over the hidden platform location during training days for control and ANKRD1-overexpressing mice
Next, we performed the Morris water maze (MWM) to assess the spatial learning ability of the mice. Analysis of escape latency during the five-day hidden platform training phase revealed no significant difference in swimming speed between experimental and control groups (Fig. 6i), consistent with our open field results and confirming comparable motor function. Critically, ANKRD1 overexpression in aged mice exhibited significantly shorter latencies to locate the platform versus controls (Fig. 6j). In addition, post-trial analysis revealed superior platform quadrant occupancy and increased platform-crossing frequency in ANKRD1 expression mice (Fig. 6k–m). Collectively, these findings demonstrate that ANKRD1 can rescue age-associated spatial memory deficits, suggesting a protective role against neurocognitive decline in the context of neurodegenerative processes.
To understand how ANKRD1 rescues age-related spatial memory deficits through activation of endogenous BMSCs during nerve repair, we first examined its potential role in promoting neural fate commitment. Overexpression of ANKRD1 in BMSCs led to marked upregulation of key neural lineage markers, including NGFR, SOX10, S100B, NF200, and NeuN (Fig. S5a, b). Immunofluorescence staining further revealed enhanced βIII-tubulin expression accompanied by pronounced morphological changes, including extension of long, filamentous processes characteristic of neuronal cells (Fig. S5c). Additionally, ANKRD1 overexpression also increased the expression and secretion of key neurotrophic factors (NGF, BDNF, GDNF, and FGF2), as confirmed by qRT-PCR, Western blotting, transcriptome profiling and ELISA quantification of culture supernatants (Fig. S5d, g). Collectively, these results demonstrate that ANKRD1 promotes neural fate commitment and augments secretory activity in endogenous BMSCs, thus contributing to the mechanisms of nerve injury recovery.
ANKRD1 mediated neural activation patterns across cognitive-associated brain regionsTo further explore the cognitive improvement effect of ANKRD1, we next sought to map its neuroanatomical targets in the mouse brain. c-Fos is expressed in neurons and it provides a cellular method for labeling neurons activated by a variety of stimuli, having widespread application in neurobiological research.40 Following viral-mediated ANKRD1 overexpression and brain tissue clearing in aged mice, we observed significant increases of c-Fos fluorescence signals within cognition-associated regions including the hippocampal formation (HPF), hypothalamus (HY), and isocortex (Fig. 7a). Quantification of brain-wide activation patterns revealed robust differences in large structures, with the HY, isocortex, HPF, olfactory areas (OLF), striatum (STR), and medulla (MY) showing the most pronounced responses to ANKRD1 overexpression (Fig. 7b). Next, differential activation was further confirmed through z-score and coefficient of variation (CV) analyses, demonstrating both enhanced magnitude (z-score) and greater interindividual variability (CV) in the AAV-ANKRD1 group across multiple regions (Fig. 7c, d).
Fig. 7
ANKRD1 mediated neural activation patterns across cognitive-associated brain regions. a Virtual coronal sections showing c-Fos expression patterns in AAV-vector (left) and AAV-ANKRD1 (right) groups. Cognition-associated regions (HP, HY, isocortex) were included. Scale bar, 500 μm. b Whole-brain c-Fos fluorescence signal in AAV-vector and AAV-ANKRD1 groups. *P < 0.05; **P < 0.01; ***P < 0.001. c Relative z -score plot of 12 brain areas of 8 animals from two groups. d Coefficient variation plot of 12 brain areas between the control and ANKRD1 overexpression group. e, f Comparison of differential neuronal activation by control and ANKRD1 overexpression. The vertical line represents the fold change in c-Fos fluorescence signal >1.07, and the horizontal line represents the FDR P-value of 0.05. The color of the dots represents the level of the FDR P-value. g The correlation of c-Fos fluorescence signal in AAV-vector and AAV-ANKRD1 groups across HY, isocortex, HPF, OLF, and pons areas. The red lines represent positive correlation and the blue lines indicate negative correlation. h Spearman correlation analysis of c-Fos fluorescence signals across 15 brain regions between the AAV-vector control and AAV-ANKRD1 groups. The size of each bubble corresponds to the magnitude of the correlation levels, and the color gradient represents FDR q-values. Red denotes positive correlation and blue indicates negative correlation
To delineate the specificity of ANKRD1-mediated neural activation, we conducted a volcano plot analysis of regional c-Fos expression, and we identified five major regions with significantly elevated activation: HY, isocortex, HPF, OLF, and pons (P), along with their subregions (Fig. 7e, f). Given the inherently interconnected nature of neural circuits, we subsequently performed systems-level analysis of functional connectivity using Spearman’s rank correlation (ρ) matrices. Positive correlations between brain regions (0 < ρ < 1) reflect synchronized or coordinated neural activity, indicative of functional cooperation within neuronal networks. Conversely, negative correlations (−1 < ρ < 0) suggest an inverse relationship, where activation in one region is associated with decreased activity in another.41 In control group, we observed the expected both positive and negative correlation among various brain regions, reflecting normal functional complexity (Fig. 7g). However, AAV-ANKRD1 treatment triggered a pronounced shift toward globally synchronized network states, characterized by significant strengthening of positive correlations across the analyzed brain regions (Fig. 7g). To further investigate ANKRD1’s impact on neural circuit engagement, we performed a cross-group correlation analysis of c-Fos fluorescence signal across the 15 anatomically defined brain regions. Notably, 12 of these regions exhibited significantly stronger positive correlations in the AAV-ANKRD1 group compared to AAV-vector controls (p < 0.05, FDR-corrected), indicating that ANKRD1 overexpression enhances coordinated activity within these regions (Fig. 7h). These findings demonstrate that ANKRD1 mediate a specific transition from segregated processing toward integrated network states, potentially facilitating functional connectivity by promoting synchronized activation across brain regions.
Comments (0)