
Remember me
In previous studies,16,26 we identified two host-derived Fn-targeting tsRNAs, tsRNA-000794 and tsRNA-020498, which are produced by an immortalized human oral keratinocyte cell line when challenged with Fn. These tsRNAs exhibit antimicrobial activity against Fn with high specificity via their ribosome-targeting functions.26
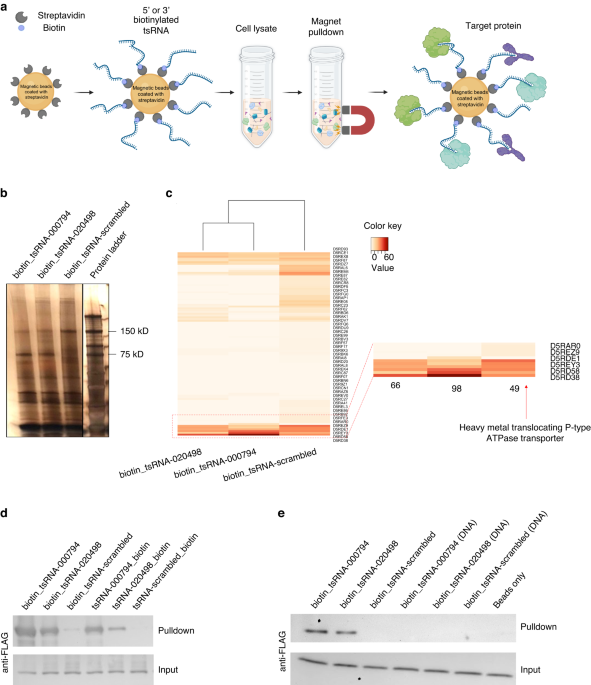
To further elucidate genetic determinants and identify additional targets in Fn for tsRNA-mediated growth inhibition, we performed RNA affinity pulldown assay,27 an established method for identifying sRNA-associated proteins in mammalian cells. Specifically, we prepared total bacterial lysate containing both cytoplasmic and membrane fractions, and used synthetic biotinylated tsRNA and streptavidin-conjugated magnetic beads to pull down putative proteins from the lysate that interact strongly with tsRNA-000794 but less so with the scrambled control, which could in principle enrich for target proteins (Fig. 1a). As shown in the silver staining (Fig. 1b), a band with a molecular weight of ~75 kDa was enriched in the samples from biotinylated tsRNA-000794 but noticeably less from the biotinylated scrambled RNA in three tested Fn strains (Fn ATCC 23726, Fn ATCC 25586 and Fn ATCC 10953) (SI Fig. S1a). Additionally, gel bands with the same molecular weight were detected in the tsRNA pulldown assays using six Fn clinical tumor isolates (CTIs) (SI Fig. S1b). In comparison, when the same RNA affinity pulldown assay was applied in total cell lysates from Streptococcus mitis (Sm) and Porphyromonas gingivalis (Pg), biotinylated tsRNA-000794 or tsRNA-020498 failed to enrich for any specific band compared to that of biotinylated scrambled RNA (SI Fig. S1c). Taken together, the presence of a unique protein band pulled down by two different Fn-targeting tsRNAs from the lysates of Fn but not Sm or Pg suggests specificity in their interaction. This finding supports our previous observations of species- and sequence-specific growth inhibition of tsRNA-000794 and tsRNA-020498 against Fn.26
Fig. 1
Identification of a putative tsRNA-binding protein in Fn. a Illustration of the workflow for an RNA affinity pulldown assay to identify RNA-binding proteins. 5′ or 3′ biotinylated RNA oligonucleotides are immobilized on the surface of streptavidin-conjugated paramagnetic microparticles to capture RNA-interacting proteins from cell lysate. b Silver staining of proteins from the biotinylated RNA pulldown in Fn ATCC 23726. Results are representative images of four independent experiments. c Heatmap showing the relative abundance of proteins isolated from the gel band at 75 kDa through mass spectrometry. The most significant band labeled as ‘D5RD38’ (P-type ATPase transporter, PtaT) was highlighted by a red arrow. d Validating the interaction between biotinylated tsRNA and recombinant PtaT. 5′ or 3′ biotin tsRNA-mediated affinity pulldown was performed using the total lysate of E. coli BL21 Rosetta, in which FLAG-tagged PtaT was recombinantly expressed. 5′ and 3′ biotinylated scrambled RNA serves as a negative control. The lower panel (input) represents an equal amount of total lysates used, and the upper panel (pulldown) indicates the amount of FLAG-tagged PtaT specifically interacting with different biotinylated RNA. A representative image of two independent experiments is shown. e Purified recombinant FLAG-PtaT can specifically bind tsRNA-000794 and tsRNA-020498 but not their DNA counterparts. Recombinant FLAG-tagged PtaT, which was purified from E. coli BL21 Rosetta, was directly used for the pulldown assay with 5′ biotinylated tsRNA. 5′ biotinylated scrambled RNA and beads only served as the negative control
We then sought to identify the proteins specifically pulled down by the Fn-targeting tsRNAs via mass spectrometry. While certain RNases or known RNA-binding proteins were found in the gel bands at ~75 kDa of molecular weight, they were not specifically enriched by the two Fn-targeting tsRNAs when compared to the scrambled control RNA (Fig. 1c). In contrast, a putative membrane-bound P-type ATPase transporter (PtaT) was specifically associated with biotinylated tsRNA-000794 and tsRNA-020498 in Fn ATCC 23726, Fn ATCC 25586 and Fn ATCC 10953 as well as six Fn CTIs. By aligning the amino acid sequences of PtaT, we found that ATCC 23726 and CTI-2 share identical protein sequences for PtaT, while other strains share 96–99% identities with ATCC 23726 (Supplementary Table S1). The conserved sequence for PtaT suggests that this protein may play a common role in tsRNA-mediated growth inhibition in the tested Fn strains. However, since bioinformatic prediction suggested the function of PtaT in transporting metal ions, it remains to be confirmed whether PtaT can indeed bind Fn-targeting tsRNAs.
To investigate the interaction between PtaT and tsRNAs, we ectopically expressed FLAG (DYKDDDDK) tagged PtaT (FLAG-PtaT) in Escherichia coli. In agreement with the RNA affinity pull-down assay from the total lysate of Fn strains, 5′ or 3′-biotinylated tsRNA-000794 and tsRNA-020498 effectively pulled down FLAG-PtaT from the total lysate of E. coli overexpressing the target protein, while the scrambled control had minimal binding. To rule out the possibility that tsRNAs may indirectly bind FLAG-PtaT in the total lysates of E. coli, we further purified recombinant FLAG-PtaT from E. coli. It was demonstrated that when immobilized on streptavidin magnetic beads, biotinylated tsRNA-000794 and tsRNA-020498 but not the scrambled control RNA directly pulled down PtaT in vitro (Fig. 1d). Conversely, we used purified FLAG-tagged PtaT along with magnetic beads conjugated with anti-FLAG antibodies as the bait to pull down tsRNA-000794, tsRNA-020498 or the scrambled control, and performed quantitative PCR to measure the levels of remaining free RNAs in the supernatant. As shown in SI Fig. S2, both tsRNAs exhibited interactions with the target proteins. Importantly, in this latter assay, the absence of biotin labeling, 2′-O-methylation and phosphorothioate bond in the two tsRNAs suggested that the direct binding between tsRNA and its target is dependent on the specific sequence rather than chemical modifications.
Having validated that PtaT can indeed interact with tsRNA-000794 and tsRNA-020498 of either chemically modified or naturally occurring ones, we next sought to examine whether PtaT may also bind to their DNA counterparts. To this end, we synthesized three 5′ biotinylated DNA oligos with identical chemical modifications corresponding to tsRNA-000794, tsRNA-020498, and the scrambled RNA, respectively. We found that the recombinant Fn PtaT protein purified from E. coli can only bind tsRNA-000794 and tsRNA-020498 but not their DNA counterparts (Fig. 1e). Meanwhile, we compared biotinylated tsRNA to DNA oligos of the same sequences by performing the same pulldown assays in Fn ATCC 23726 total lysate, followed by silver staining and Mass spectrometry. Consistent with the direct binding experiment using purified PtaT, Mass spectrometry results demonstrated that tsRNA-000794 but not its DNA counterpart can pull down PtaT from Fn ATCC 23726 (SI Fig. S3). In addition to the scrambled control RNA, we found that two additional piwi-interacting RNAs (piRNAs) commonly found in human saliva did not pull down PtaT from the Fn total lysate. In summary, through three different pulldown experiments, including ectopic expression of FLAG-tagged PtaT in E. coli and Fn, respectively, as well as the use of purified PtaT, we showed that tsRNA-000794 and tsRNA-020498 can interact with PtaT in a highly sequence- and RNA-specific manner.
Knocking out ptaT interfered with the antimicrobial efficacy of Fn-targeting tsRNAsHaving demonstrated that PtaT is a possible RNA-binding protein for tsRNA-000794 and tsRNA-020498 experimentally, we next explored the roles of PtaT in tsRNA-mediated growth inhibition of Fn. To delete ptaT in Fn 23726, we first created a galK mutant strain (ΔgalK) in Fn ATCC 23726 background so that we could use galK gene as a counter-selectable marker28,29 to generate marker-less mutants.30 After obtaining the Fn ATCC 23726 ΔgalK mutant, which did not display any discernible growth defect compared to wildtype, a suicide vector carrying the cloned Fn galK gene and sequences flanking the ptaT gene was designed to enable a double crossover-mediated removal of the ptaT gene in the ΔgalK strain background through galK-mediated counterselection with 2-deoxy-galactose (2-DG). The successful deletion of both galK and ptaT genes was verified by colony PCR and Sanger sequencing (SI Fig. S4), resulting in the Fn ΔgalK ΔptaT mutant.
We first observed that when cultured in a standard rich medium (Columbia Broth medium), although not statistically significant, Fn ΔptaT consistently displayed lower OD when reaching the late log/early stationary phase compared to the parent strain (SI Fig. S5). We then treated Fn ΔgalK and Fn ΔgalK ΔptaT with chemically modified tsRNA-000794 (MOD-(OMe)-000794) and the scrambled control (MOD-(OMe)-scrambled), followed by examining the antimicrobial efficacy of tsRNAs on Fn through a SYTOX Green assay described previously.26,31 MOD-(OMe)-000794 was used as it displayed enhanced potency while maintaining specificity.26 As expected, MOD-(OMe)-000794 induced significant cell death in Fn ΔgalK, indicated by a large portion of cells exhibiting green fluorescence (Fig. 2a). In comparison, Fn ΔgalK ΔptaT was relatively resistant to tsRNA-mediated growth inhibition compared to Fn ΔgalK (Fig. 2a). MOD-(OMe)-scrambled control did not exert an inhibitory effect towards both Fn ΔgalK and Fn ΔgalK ΔptaT (Fig. 2b), as evidenced by very few SYTOX Green-positive bacteria. Quantification of integrated SYTOX Green fluorescence signal after normalization of the total bacterial area further underscored that PtaT indeed plays an important role in mediating tsRNA-induced growth inhibition of Fn (Fig. 2c).
Fig. 2
P-type ATPase transporter (PtaT) plays an important role in the internalization and antimicrobial effect of modified tsRNAs on Fusobacterium nucleatum ATCC 23726. a, b Fn ΔgalK and Fn ΔgalK ΔptaT were treated with 500 nM MOD-(OMe)-000794 (a), and MOD-(OMe)-scrambled (b) for 5 h followed by SYTOX Green staining. c SYTOX Green quantification assay. Each dot represents the normalized raw and integrated fluorescence intensity (calculated from the fluorescence channel) to the total area of bacteria (calculated from the transmission channel), given a certain field of view (FOV). Multiple dots within a group were the FOVs chosen randomly from three biological replicates. Statistical analysis was achieved by Student’s unpaired t-test. ns, not significant, *P < 0.05, **P < 0.01, ***P < 0.001. d Visualization of internalized 5′ Cy3_000794 by Fn ΔgalK and Fn ΔgalK ΔptaT through super-resolution Airyscan confocal microscopy. Fn ΔgalK and Fn ΔgalK ΔptaT were incubated with 5′ Cy3_000794 for 5 h, followed by imaging. e Scatter plot showing the single-cell intracellular fluorescence intensity from 5′ Cy3_000794 between Fn ΔgalK and Fn ΔgalK ΔptaT. ****P < 0.000 1
To query whether the increased resistance to tsRNA in Fn ΔgalK ΔptaT is due to the reduced tsRNA intake, we fluorescently labeled the tsRNAs with Cy3 at the 5′ end and then treated both Fn ΔgalK and Fn ΔgalK ΔptaT with Cy3-tagged tsRNA-000794. Super-resolution Airyscanning fluorescence microscopy was then applied to examine the intracellular accumulation of tsRNA. As shown in Fig. 2d, Cy3-tagged tsRNA-000794 was taken up by Fn ΔgalK, resulting in punctate fluorescence signals intracellularly, as evidenced by ‘bright dots’ (loci) indicative of subcellular accumulation of tsRNA. In contrast, by knocking out ptaT, the intracellular accumulation of Cy3-tagged tsRNA-000794 was significantly reduced (P < 0.000 1). This difference was quantified by comparing the single-cell fluorescence intensities of intracellular Cy3-tagged tsRNA-000794 between Fn ΔgalK and ΔgalK ΔptaT (Fig. 2e). In summary, these data provide genetic and phenotypic evidence on the roles of PtaT in tsRNA uptake and growth inhibition in Fn. It is worth noting that the deletion of ptaT did not completely abolish the intake of tsRNA, suggesting PtaT is not the sole genetic determinant involved in tsRNA uptake.
Knocking out ptaT altered the global RNA profiles of FnOur data so far demonstrate the role of PtaT in mediating the inhibitory effect of host-derived tsRNAs against Fn. To further investigate the additional biological role of PtaT in Fn, we performed RNA-seq to identify the differentially expressed genes (DEGs) in Fn ΔgalK ΔptaT compared to Fn ΔgalK in both log and early stationary phases. Gene expression levels were compared between Fn ΔgalK and Fn ΔgalK ΔptaT during log-phase growth in three biological replicates. A total of 580 DEGs with a false discovery rate (FDR)-adjusted p-value < 0.05 are identified and presented by heatmaps and a volcano plot (Fig. 3). KEGG enrichment scatter plot of DEGs (Fig. 3a) and quantification of differentially expressed genes analysis (Fig. 3b) showed that purine metabolism represents one of the most significantly downregulated pathways in Fn ΔgalK ΔptaT (Fig. 3a, b). Other significantly downregulated pathways include the biosynthesis of secondary metabolites; pyrimidine metabolism, pyruvate metabolism; alanine, aspartate and glutamate metabolism (Fig. 3e). Log-phase Fn ΔgalK ΔptaT also displayed increased expression of glycerophosphoryl diester phosphodiesterase and genes related to methionine metabolism (Fig. 3e).
Fig. 3
Transcriptomic analysis and comparison between Fn ΔgalK and Fn ΔgalK ΔptaT in both log-phase and stationary-phase. a, b Clusters of orthologous groups (COG, a) and quantification of differentially expressed genes (b) from log-phase Fn ΔgalK ΔptaT relative to Fn ΔgalK. c, d Heatmaps showing the global differentially expressed genes for log-phase (c) and stationary-phase (d) Fn ΔgalK and Fn ΔgalK ΔptaT. Each heatmap includes triplicate RNA-seq samples for the indicated Fn ΔgalK and Fn ΔgalK ΔptaT. The coloring indicates Log2FoldChange of the selected samples, while red and blue denote up- and down-regulation, respectively. The DESeq2 method (P-value ≦ 0.05) was applied to generate the heatmap. e, f Volcano plots showing the transcriptomic changes of log-phase (e) and stationary-phase (f) Fn ΔgalK ΔptaT relative to Fn ΔgalK. Red and magenta dots indicate significantly upregulated and downregulated genes, respectively, and grey dots indicate genes with no significant changes. Significantly differentially regulated genes are characterized by an absolute fold change >2 (downregulated log2 < −1, upregulated log2 > 1; vertical dashed line) and p-value < 0.05 (horizontal gray dashed line)
On the contrary, only 18 DEGs were identified between Fn ΔgalK and Fn ΔgalK ΔptaT during stationary-phase growth (Fig. 3d). As shown in the volcano plot (Fig. 3f) and the clusters of orthologous group plot (SI Fig. S6), two DEGs displayed reduced expression in Fn ΔgalK ΔptaT compared to Fn ΔgalK: C4N14_RS10085 (related to glutamine metabolism); C4N14_RS10080 (related to carbamoyl-phosphate metabolism). Nine DEGs showing upregulated gene expression are related to lipopolysaccharide biosynthesis (C4N14_RS09530), tRNA activity (C4N14_RS01465), and histidine phosphatase (C4N14_RS08585). The drastic difference in gene expression pattern between Fn ΔgalK ΔptaT and Fn ΔgalK in log-phase and stationary-phase bacteria agreed with previous studies: the metabolism-linked genes are highly expressed when cells are actively growing and get turned off or downregulated when the cells enter the stationary phase.32,33,34 Taken together, the transcriptomic data highlight the important role that PtaT plays in shaping the global metabolic profiles of Fn, particularly during its actively growing state. The data are in agreement with the finding that Fn ΔptaT mutants display reduced growth, albeit not statistically significant, in the late log phase (SI Fig. S5).
RNA quantification and Raman spectroscopy revealed the PtaT-dependent reduction of nucleic acid levels in FnPurine and pyrimidine are involved with the major energy carriers, and they are the subunits of nucleic acids.35,36 Since our transcriptomic data indicates potentially impaired purine synthesis in Fn ΔgalK ΔptaT in the log phase, we wondered whether the reduced gene expression of purine synthesis-related genes in the log phase would later reduce the abundance of nucleic acids inside bacteria. To answer this question, we first analyzed and compared bulk RNA levels in the stationary-phase cells. It was found that the level of bulk RNA extracted from equal numbers of Fn ΔgalK was ~two-fold higher than that of Fn ΔgalK ΔptaT (P = 0.037, SI Fig. S7). Interestingly, there was no significant difference between log-phase Fn ΔgalK ΔptaT and Fn ΔgalK in the total RNA levels (P = 0.77). These findings suggested a delayed response at the RNA levels following decreased gene expression related to purine/nucleic acid metabolism.
To further corroborate the difference in total bulk RNA extraction experiments, we performed Raman spectroscopy to understand how PtaT-depletion impacted Fn ΔgalK at the molecular and cellular levels. Since Raman spectroscopy has been widely used to provide insights into the chemical makeup of biological samples at the single-cell level,37,38,39 we sought to obtain spectroscopic vibrational information of intracellular biomolecules from both the log- and stationary-phase Fn ΔgalK and Fn ΔgalK ΔptaT. As shown in Fig. 4a, b, both log- and stationary-phase Fn ΔgalK and Fn ΔgalK ΔptaT exhibited typical Raman peaks: 720/780 cm−1 (DNA/RNA); 1 003 cm−1 (phenylalanine); 1 240 cm−1/1 450 cm−1/1 660 cm−1 (Amide III/II/I peaks).
Fig. 4
Spectroscopic characterization of both log-phase and stationary-phase Fn ΔgalK and Fn ΔgalK ΔptaT by label-free Raman spectroscopy. a, b Averaged Raman spectra of log-phase (a) and stationary-phase (b) Fn ΔgalK and Fn ΔgalK ΔptaT. Each scenario was averaged from 50 spectra over three biological replicates. The shaded area represents the standard deviation from the measurements. Peaks of interest were highlighted by dashed blue lines and designated with corresponding Raman shifts. c Linear discrimination analysis (LDA) of 200 Raman spectra from log-phase and stationary-phase Fn ΔgalK and Fn ΔgalK ΔptaT. The plot was shown through the display of LD2 versus LD1. 95% confidence intervals were outlined by colored ellipses. d Quantification of the amount of nucleic acids from both log-phase and stationary-phase Fn ΔgalK and Fn ΔgalK ΔptaT. Quantification of nucleic acids was calculated through the integration of Raman intensity from 770 to 789 cm−1. Statistical analysis was achieved by the Student’s unpaired t-test: ****P < 0.000 1, ns not significant
To globally map out the difference among the four groups, a multivariate data analysis approach, linear discrimination analysis40,41 (LDA) was utilized to model the difference among the four groups through dimensionality reduction of high-dimensional Raman spectra. Each group indeed exhibited a distinct cluster in the LDA plots (Fig. 4c and SI Fig. S8). Raman band at 780 cm−1 is related to nucleic acids due to the cytosine/uracil ring breathing.42 We then quantified the amount of nucleic acids based on the integrated Raman intensity around 780 cm−1 given that Raman intensity is linearly proportional to the amount of biomolecules inside the samples.43 We found that Fn ΔgalK ΔptaT had significantly lower nucleic acid levels (P < 0.000 1) than that of the isogenic control Fn ∆galK in the stationary phase compared to that of the log phase (ns, P = 0.052 8), suggesting that the reduced purine synthesis likely limited nucleic acids level in the stationary phase (Fig. 4d). Consistent with the transcriptomic data and RNA quantification from the bulk sample (SI Fig. S7), label-free Raman spectroscopy provides another line of evidence that PtaT may affect the purine synthesis process which negatively impacts intracellular nucleic acid levels at the stationary phase.
Knocking out ptaT in a Fn clinical tumor isolate interfered with the intake and antimicrobial efficacy of Fn-targeting tsRNAsAfter demonstrating the involvement of PtaT in tsRNA-mediated growth inhibition in the type strain Fn ATCC 23726, we next explored whether similar findings can be validated in a clinical Fn isolate. Fn is a significant contributor to colorectal cancer (CRC).44 Since we have shown the excellent antimicrobial efficacy of MOD-(OMe)-000794 against multiple Fn clinical tumor isolates (CTIs),26 we wondered whether PtaT plays similar roles in tsRNA intake and its induced growth inhibition as observed in Fn ATCC 23726.
To test this, we chose Fn clinical tumor isolate (CTI)-2 because CTI-2 expresses a membrane protein, Fap2, that mediates the adhesion of Fn to colon cancer cells overexpressing Gal-GalNAc to promote the development of CRC.45 Additionally, we also found that the protein sequences for PtaT are identical between CTI-2 and Fn ATCC 23726. For these reasons, we generated a PtaT-depleted Fn CTI-2 strain (Fn CTI ΔptaT) as described in “Materials and methods”.46 After validating the successful knockout of ptaT, we examined the inhibition efficacy of tsRNAs on Fn CTI-2 wildtype (Fn CTI wt) and Fn CTI ΔptaT through the SYTOX Green assay. MOD-(OMe)-000794 induced apparent cell death in the case of Fn CTI wt, indicated by a large portion of cells exhibiting green fluorescence (Fig. 5a) and consistent with our previous study.26 Similar to findings in Fn 23726 ΔgalK ΔptaT, we also observed that Fn CTI ΔptaT was relatively resistant to tsRNA-mediated growth inhibition compared to Fn CTI wt (Fig. 5a). MOD-(OMe)-scrambled didn’t exert an inhibitory effect towards both Fn CTI wt and Fn CTI ΔptaT (Fig. 5b), as evidenced by few SYTOX Green-positive bacteria. Quantification of integrated SYTOX Green fluorescence signal after normalization of the total bacterial area further underscored that PtaT indeed plays an indispensable role in mediating tsRNA-mediated growth inhibition of a Fn clinical tumor isolate (Fig. 5c).
Fig. 5
P-type ATPase transporter (PtaT) plays an essential role in the internalization and antimicrobial effect of modified tsRNAs on a Fusobacterium nucleatum clinical tumor isolate (Fn CTI-2). a, b Fn CTI wt and Fn CTI ΔptaT were treated with 500 nmol/L MOD-(OMe)-000794 (a), and MOD-(OMe)-scrambled (b) for 5 h, followed by SYTOX Green staining. c SYTOX Green quantification was carried out by normalizing raw integrated fluorescence intensity to the areas of randomly picked bacteria, which takes into consideration both SYTOX Green-positive and -negative ones in the field of view. Statistical analysis was achieved by the unpaired Student’s t-test: **P < 0.01, *P < 0.05, ns not significant. d Visualization of internalization of 5′ Cy3_000794 by Fn CTI wt and Fn CTI ΔptaT through confocal fluorescence imaging. Fn CTI wt and Fn CTI ΔptaT were incubated with 5′ Cy3_000794 for 5 h, followed by confocal fluorescence imaging. e Quantification of fluorescence intensity by normalizing raw integrated fluorescence intensity to the areas of bacteria, as shown in (d). Statistical analysis was achieved by the Student’s unpaired t-test: *P < 0.05
Furthermore, the deletion of ptaT in CTI seemed to affect tsRNA intake. As shown in Fig. 5d, Cy3-tagged tsRNA-000794 was densely accumulated intracellularly, as indicated by the formation of multiple loci with strong signal intensity. By knocking out ptaT, the intracellular accumulation of Cy3-tagged tsRNA-000794 was significantly reduced in the Fn CTI ΔptaT compared to Fn CTI wt (P = 0.029, Fig. 5e). This difference was documented by the comparison of the normalized Cy3 fluorescence intensity between Fn CTI wt and Fn CTI ΔptaT. These data provide further evidence showing the important role of PtaT in tsRNA-mediated growth inhibition against a wide range of Fn strains, including clinically relevant ones.
AlphaFold 3 simulates the interaction between tsRNA-000794 and PtaTOur biochemical and genetic data (Fig. 1, Fig. 2, Fig. 5) suggest that PtaT may act as an RNA-binding protein involved in the intake of Fn-targeting tsRNAs. However, none of the PtaT characterized thus far has been shown to be involved in sRNA transport. To obtain additional information on the potential interaction between Fn-targeting tsRNA and PtaT, we employed AlphaFold 3 to predict biomolecular interaction between PtaT from Fn ATCC 23726 and tsRNA-000794.47 We downloaded the full protein sequence of PtaT for Fn ATCC 23726 from the UniProt website that corresponds to the protein identified by mass spectrometry for the tsRNA pulldown assay and chose tsRNA-000794 due to its higher uptake by Fn compared with tsRNA020498.26 We then utilized AlphaFold 3 to predict the structure model of the tsRNA-000794—PtaT protein complex (Fig. 6a). The prediction results suggest the presence of RNA-binding domains with high confidence. Of note, P-type ATPase has a conserved Nucleotide Binding domain (NB domain), which is in the cytoplasm and is responsible for ATP binding and hydrolysis.48 It also possesses a characteristic Phosphorylation domain (P domain), which is closely related to the NB domain and involved in the phosphorylation reaction following ATP hydrolysis.49 Consistent with the above biochemical data, AlphaFold3 prediction suggested tsRNA-000794 may interact with Fn PtaT by contacting both the NB domain and the P domain (Fig. 6b). A detailed analysis of the predicted PtaT-tsRNA interaction reveals a core pocket and an extended region in PtaT for tsRNA binding (Fig. 6c).
Fig. 6
Structural analysis of the predicted complex model of tsRNA-000794 and PtaT. a The predicted complex model of tsRNA-000794 and PtaT by AlphaFold 3. The color of the model presents the confidence of the prediction, as shown in the bar below. b Cartoon view of the predicted complex model. The tsRNA-000794 is shown in yellow, and the PtaT protein is shown in gray, with its Nucleotide Binding (NB) domain in cyan and Phosphorylation (P) domain in deep teal. c Structural analysis of the binding pocket of the predicted model. Upper, binding region of tsRNA-000794 and PtaT. Both RNA and protein are shown in a cartoon with a surface view. Colors are the same as those in (b). Lower, detailed Interactions between tsRNA and NB domain/P domain of PtaT protein. The core pocket is highlighted in red brick. Nucleotide acids are in yellow. Key residues are shown in sticks. Residues in core pocket of NB domain are in blue, in extended region in NB domain are in cyan, and in P domain is in deep teal. Dotted lines represent interactions. Among them, gray indicates π–π interaction, blue indicates hydrogen bonding, and orange indicates salt bridge. d The superimposition of the predicted model (cyan) and CopA (wheat, PDB code: 3A1C). Only the NB domain is shown here for both proteins. A27 in tsRNA-000794 binds to the core pocket of PtaT, which is in yellow stick, and AMPPCP, an ATP analog that binds to CopA, is in pink stick. Key residues in the core pocket are also shown in stick, they are E456 and H461 of PtaT in blue, and E457 and H462 of CopA in orange. RMSD of NB domain between PtaT and CopA is 1.527 Å
The binding mode of the tsRNA-000794 to PtaT resembles the classical binding mode of ATP to P-type ATPases. For example, CopA proteins, a class of P-type ATPases that translocate Cu2+, have had their crystal structures solved, including those containing the ATP analogue—AMPPCP.50 The CopA–AMPPCP complex structure (PDB code: 3A1C) can be used as a model to study ATP binding to P-type ATPases, serving as the homologue to the PtaT protein. The superimposition of the NB domains of the PtaT protein and CopA reveals a high degree of similarity, especially at the core pocket site. Correspondingly, tsRNA-000794 exhibits a similar mode of insertion into the core pocket as AMPPCP (Fig. 6d).
We further predicted the interactions between Fn PtaT and tsRNA scrambled control, or a DNA oligo with sequences identical to tsRNA-00079, referred to as tsDNA-000794. As shown in SI Fig. S9a, while the scrambled control adopted a relatively stable conformation within the complex, it lacks the specificity to bind to the pocket in the NB domain, as seen with the tsRNA-000794. We further simulated the interaction between tsDNA-000794 and PtaT, and we found no binding between them (SI Fig. S9b).
To verify whether amino acids depicted in Fig. 6c are crucial for the interaction with tsRNAs, we performed alanine scanning followed by an Electrophoretic Mobility Shift Assay (EMSA). In the AlphaFold 3-predicted binding model, key residues E456, S459, H461, and K511 play crucial roles: E456, S459, and H461 form hydrogen bonds and/or π–π interactions within the binding pocket, while K511 interacts with RNA phosphate groups in the extended region (Fig. 6). Alanine substitution of E456 and H461 rendered the protein insoluble, likely due to their role in structural stability. To preserve protein folding, we introduced milder mutations (E456L and H461F) to retain some side-chain properties. We tested single mutants (E456L, S459A, H461F, and K511A), as well as double and multi-point mutants (E456L/H461F, E456L/K511A, E456L/S459A/H461F, and E456L/S459A/H461F/K511A). All mutated proteins were validated by fast protein liquid chromatography (FPLC) for structural integrity and tested in EMSA with annealed tsRNA-000794.
For the EMSA experiment, samples were stratified into three groups (SI Fig. S10). The first group was designed to validate the RNA-binding capacity of the wild-type NB domain (NB WT). To improve solubility, both wild-type and mutant NB variants were N-terminally fused to Glutathione S-transferase (GST), a widely used solubility-enhancing tag. To eliminate potential artifacts from the tag, a control assay confirmed that GST alone does not bind tsRNA (SI Fig. S10a, left). With tsRNA held constant at 2 μmol/L, a distinct mobility shift was observed upon incubation with GST-NB WT, at ~6.25 μmol/L protein concentration, indicating a strong interaction (SI Fig. S10a, right). The second group included single-point NB domain mutants (SI Fig. S10b). Substitutions E456L and H461F, despite partially retaining side-chain properties, markedly reduced tsRNA binding, with shift bands appearing only at ~25 and ~50 μmol/L protein concentration lanes, respectively. The S459A variant exhibited similarly reduced affinity, whereas the K511A mutation completely abolished binding. The third group comprised double and multi-site mutants (SI Fig. S10c), none of which demonstrated detectable tsRNA interaction under the tested conditions. Collectively, these data demonstrate that the wild-type NB domain binds to tsRNA directly and specifically, while certain point mutations severely compromise or eliminate this interaction. These findings are consistent with the predicted interface of AlphaFold 3 modeling.
In summary, AlphaFold 3 prediction provides further evidence supporting the specific binding between PtaT and tsRNA compared to the scrambled control and the DNA counterpart, which agrees with our biochemical and genetic data (Fig. 1, Fig. 2, Fig. 5).
Comments (0)