We conducted a cross-sectional study in a random sample of the Danish population aged 18 and above.
2.1 Data collection
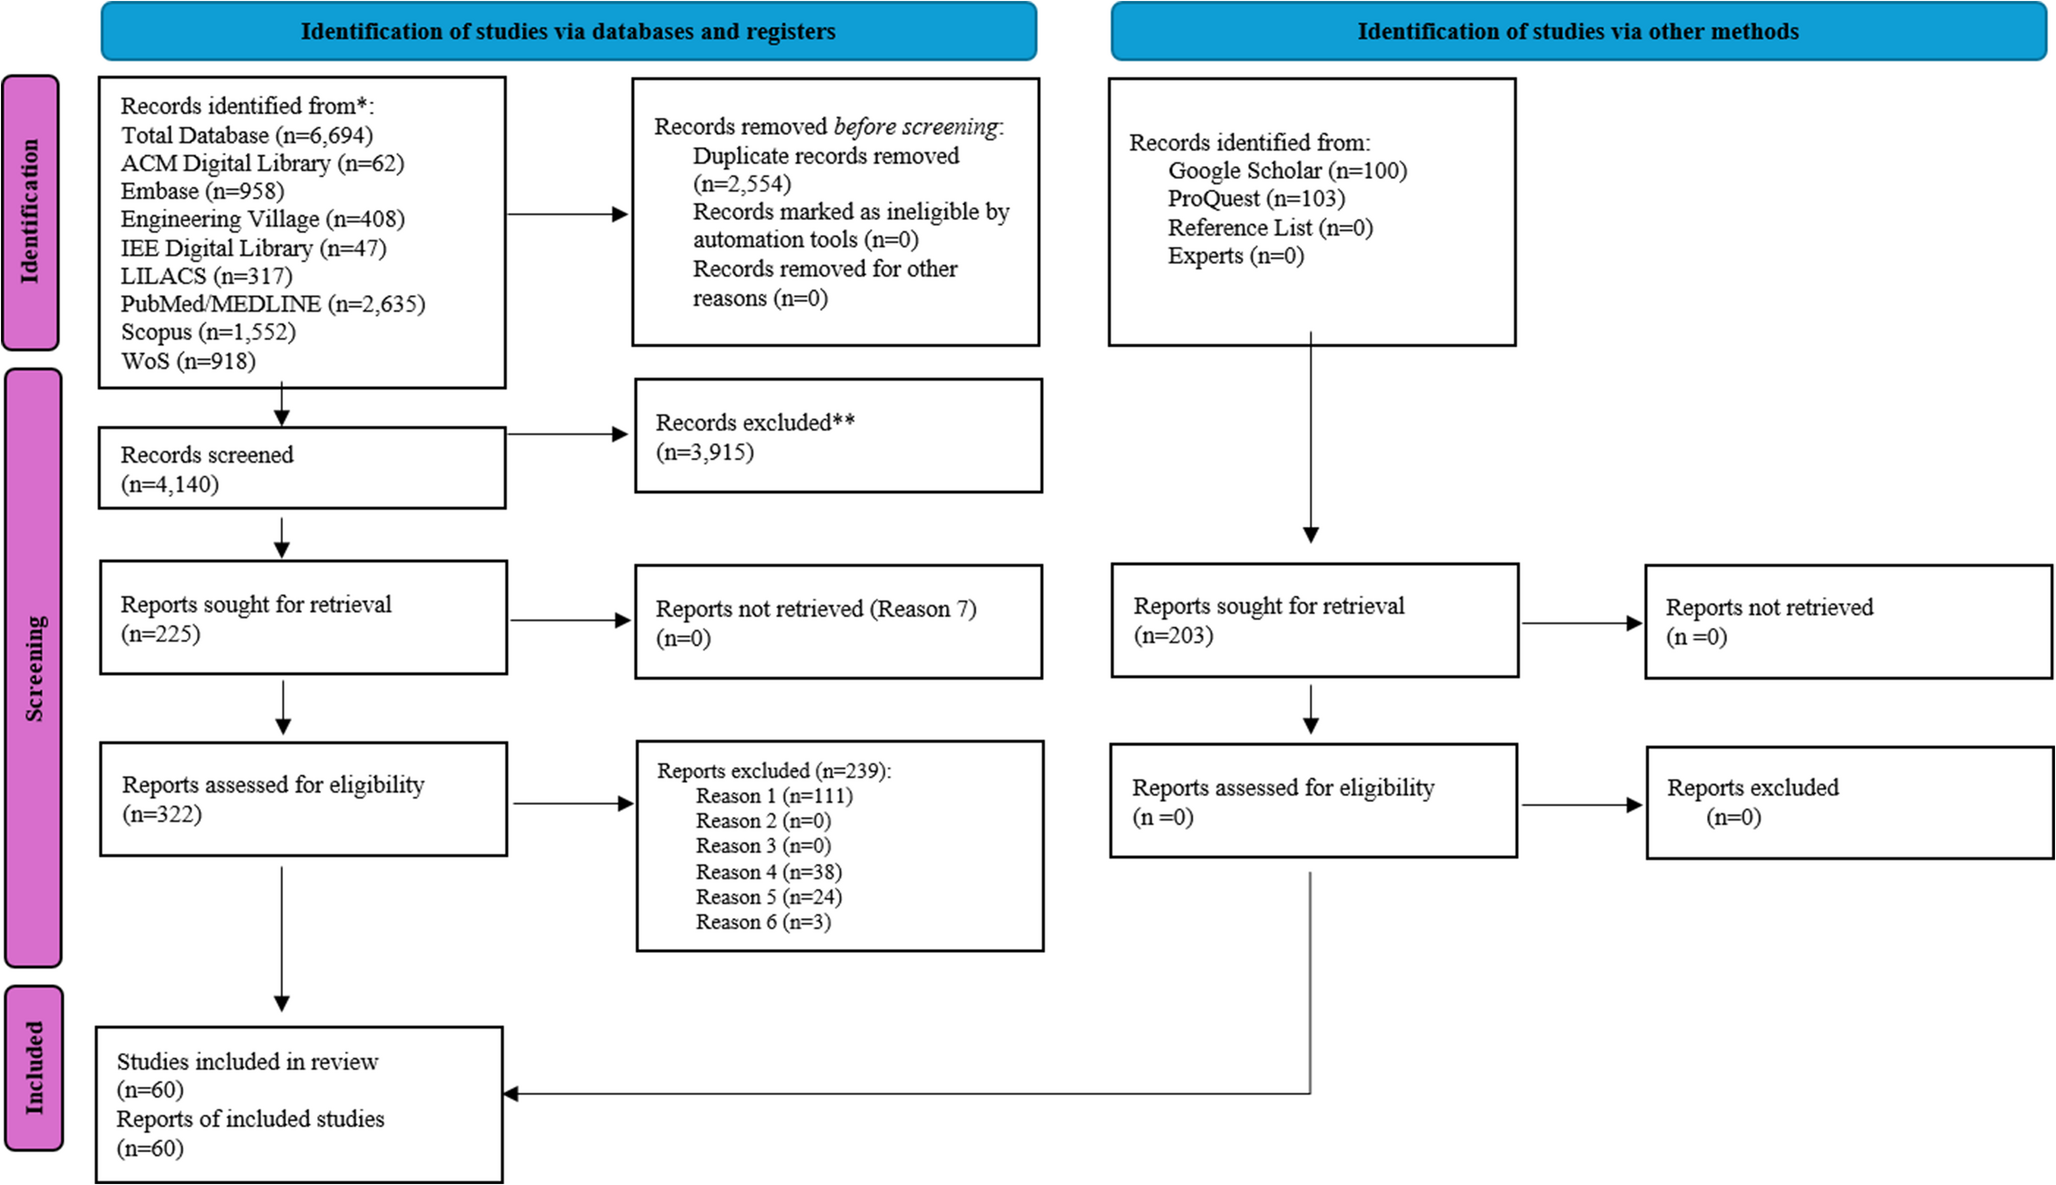
As part of the European HLS19 project [17], a random sample of 29,998 citizens from the Danish population was extracted by the Danish Health Data Agency. The sample included potential participants 18 years of age or older, having lived in Denmark for more than 6 months and not being declared incapable of managing their own affairs. The sample was stratified by sex, seven age groups (”18–25“, ”26–35“, ”36–45“, ”46–55“, ”56–65“, ”66–75“, ”76 or older“) and three levels of urbanization (predominantly urban with a rural population of 20% or less, intermediate with a rural population of 20% to 50%, and predominantly rural regions had rural population of 50% or more) [17]. An invitation to participate and a personal link to the questionnaire in REDCap [24] was distributed using the Danish Public Digital Mail System (e-Boks). Since 2015 it has been mandatory for all 15-year-olds or older to use e-Boks, unless being personally exempted [25]§3. 2,271 citizens from the sample were exempt from e-Boks and did not receive the invitation. The questionnaire was thus delivered to 27,727 citizens, of whom 4,605 responded to the questionnaire. Of the 4,605 responses 926 were not complete and did not meet the requirements of at least 80% of the items in the questionnaire to be answered in order to be included in the study. A further 35 participants were removed as they had missing answers to the questions included in the analysis, leaving a total sample of 3,644 (13.1%) for analysis.
2.2 Variables2.2.1 Educational level
Educational level was used as a proxy for SES because education usually precedes entry into employment and thereby affects income [26]. Education is at the same time associated with literacy. Educational level was self-reported and originally formulated by the European Health Interview Survey (EHIS), classifying educational attainment according to the International Standard Classification of Education (ISCED), but with a national adaptation of the answers. The question stated: “What is your highest level of education?” with eight response categories (primary education (1–7 year), lower secondary (8–10 year), upper secondary, vocational, short cycle tertiary (short term higher), bachelor or equivalent (medium higher), master or equivalent (long term higher) or doctoral or equivalent (PhD or equivalent)). In the analyses responses were collapsed into five groups corresponding to of ISCED 1–3 (primary or secondary education), ISCED 5 (Vocational education), ISCED 5 (short cycled tertiary education), ISCED 6 (bachelor’s level or equivalent) and ISCED 7–8 (master’s level or higher).
2.2.2 Chronic diseases
Information on chronic disease was self-reported. The respondents were asked: “For each of the following diseases and health problems, please indicate whether you have [the disease] now or have had it in the past. If you have had it in the past, please also indicate if you have any after-effects”. The respondents were asked about 13 named chronic diseases, and the number of positive answers were summarized and grouped into “no chronic diseases”, “1 chronic disease” and “≥2 chronic diseases”. The list of the 13 chronic diseases is shown in Table 3.
2.2.3 Digital health literacy
The measure of DHL, HLS19-DIGI, was based on the evaluation for eight items asking for difficulties or ease in searching, understanding, judging and using information on health on the Internet [17]. The answer categories were given as “very difficult”, “difficult”, “easy” or “very easy” and coded 1–4. Answers were summarized (8–32) and transformed into a score of 0–100 with higher values reflecting higher DHL. The scale has been validated in Danish with a Cronbach’s alpha of 0.85, a reasonable fit with a one-factor model and an overall fit with a Rasch analysis [17].
2.2.4 Other covariates
Information on age and sex was retrieved from the Personal Identification Number. Age was grouped into four age groups (“18–45 years”, “46–55 years”, “56–65 years” and “≥ 66 years”) to allow for non-linear associations, as chronic diseases become more prevalent with age.
2.3 Data analysis
Variables were described with number and proportions and further described by mean and standard deviation of DHL.
Simple and multiple linear regression models were used to estimate the relationship between educational level and chronic disease as exposures and DHL as outcome, using vocational education and no chronic disease as the reference groups. Age and sex were included as covariates. The models estimated beta with 95% confidence interval. The model fits were evaluated by examining whether the residuals were normally distributed and homogeneity. We estimated robust standard errors to account for the stratification of the sample.
Age was also included in the models as an interaction term, comparing a nested model with the same model without interaction. The Likelihood Ratio test had a p-value of 0.0502, verifying that age was formally not an effect modifier and therefore included as a confounder.
The final linear regression models, examining whether chronic disease was an effect modifier for the association between educational level and DHL, was adjusted for sex and age. The interaction was tested as nested models as described for age above, but to describe the results, stratified results are presented. The significance level was set at 0.05.
All analyses were conducted in STATA 17 (StataCorp LLC, College Station, Texas).
2.4 Ethics
Questionnaire based studies do not require ethical approval in Denmark [27] § 14 Sect. 2.
The study is in compliance with the General Data Protection Regulation and is registered in North Denmark Region’s record of processing activities (2020-018). The data was collected in accordance with the Helsinki Declaration [28]. The participants were informed about the purpose of the questionnaire, that participation was voluntary, and that they had to indicate their informed consent in the questionnaire.

Comments (0)