
Remember me
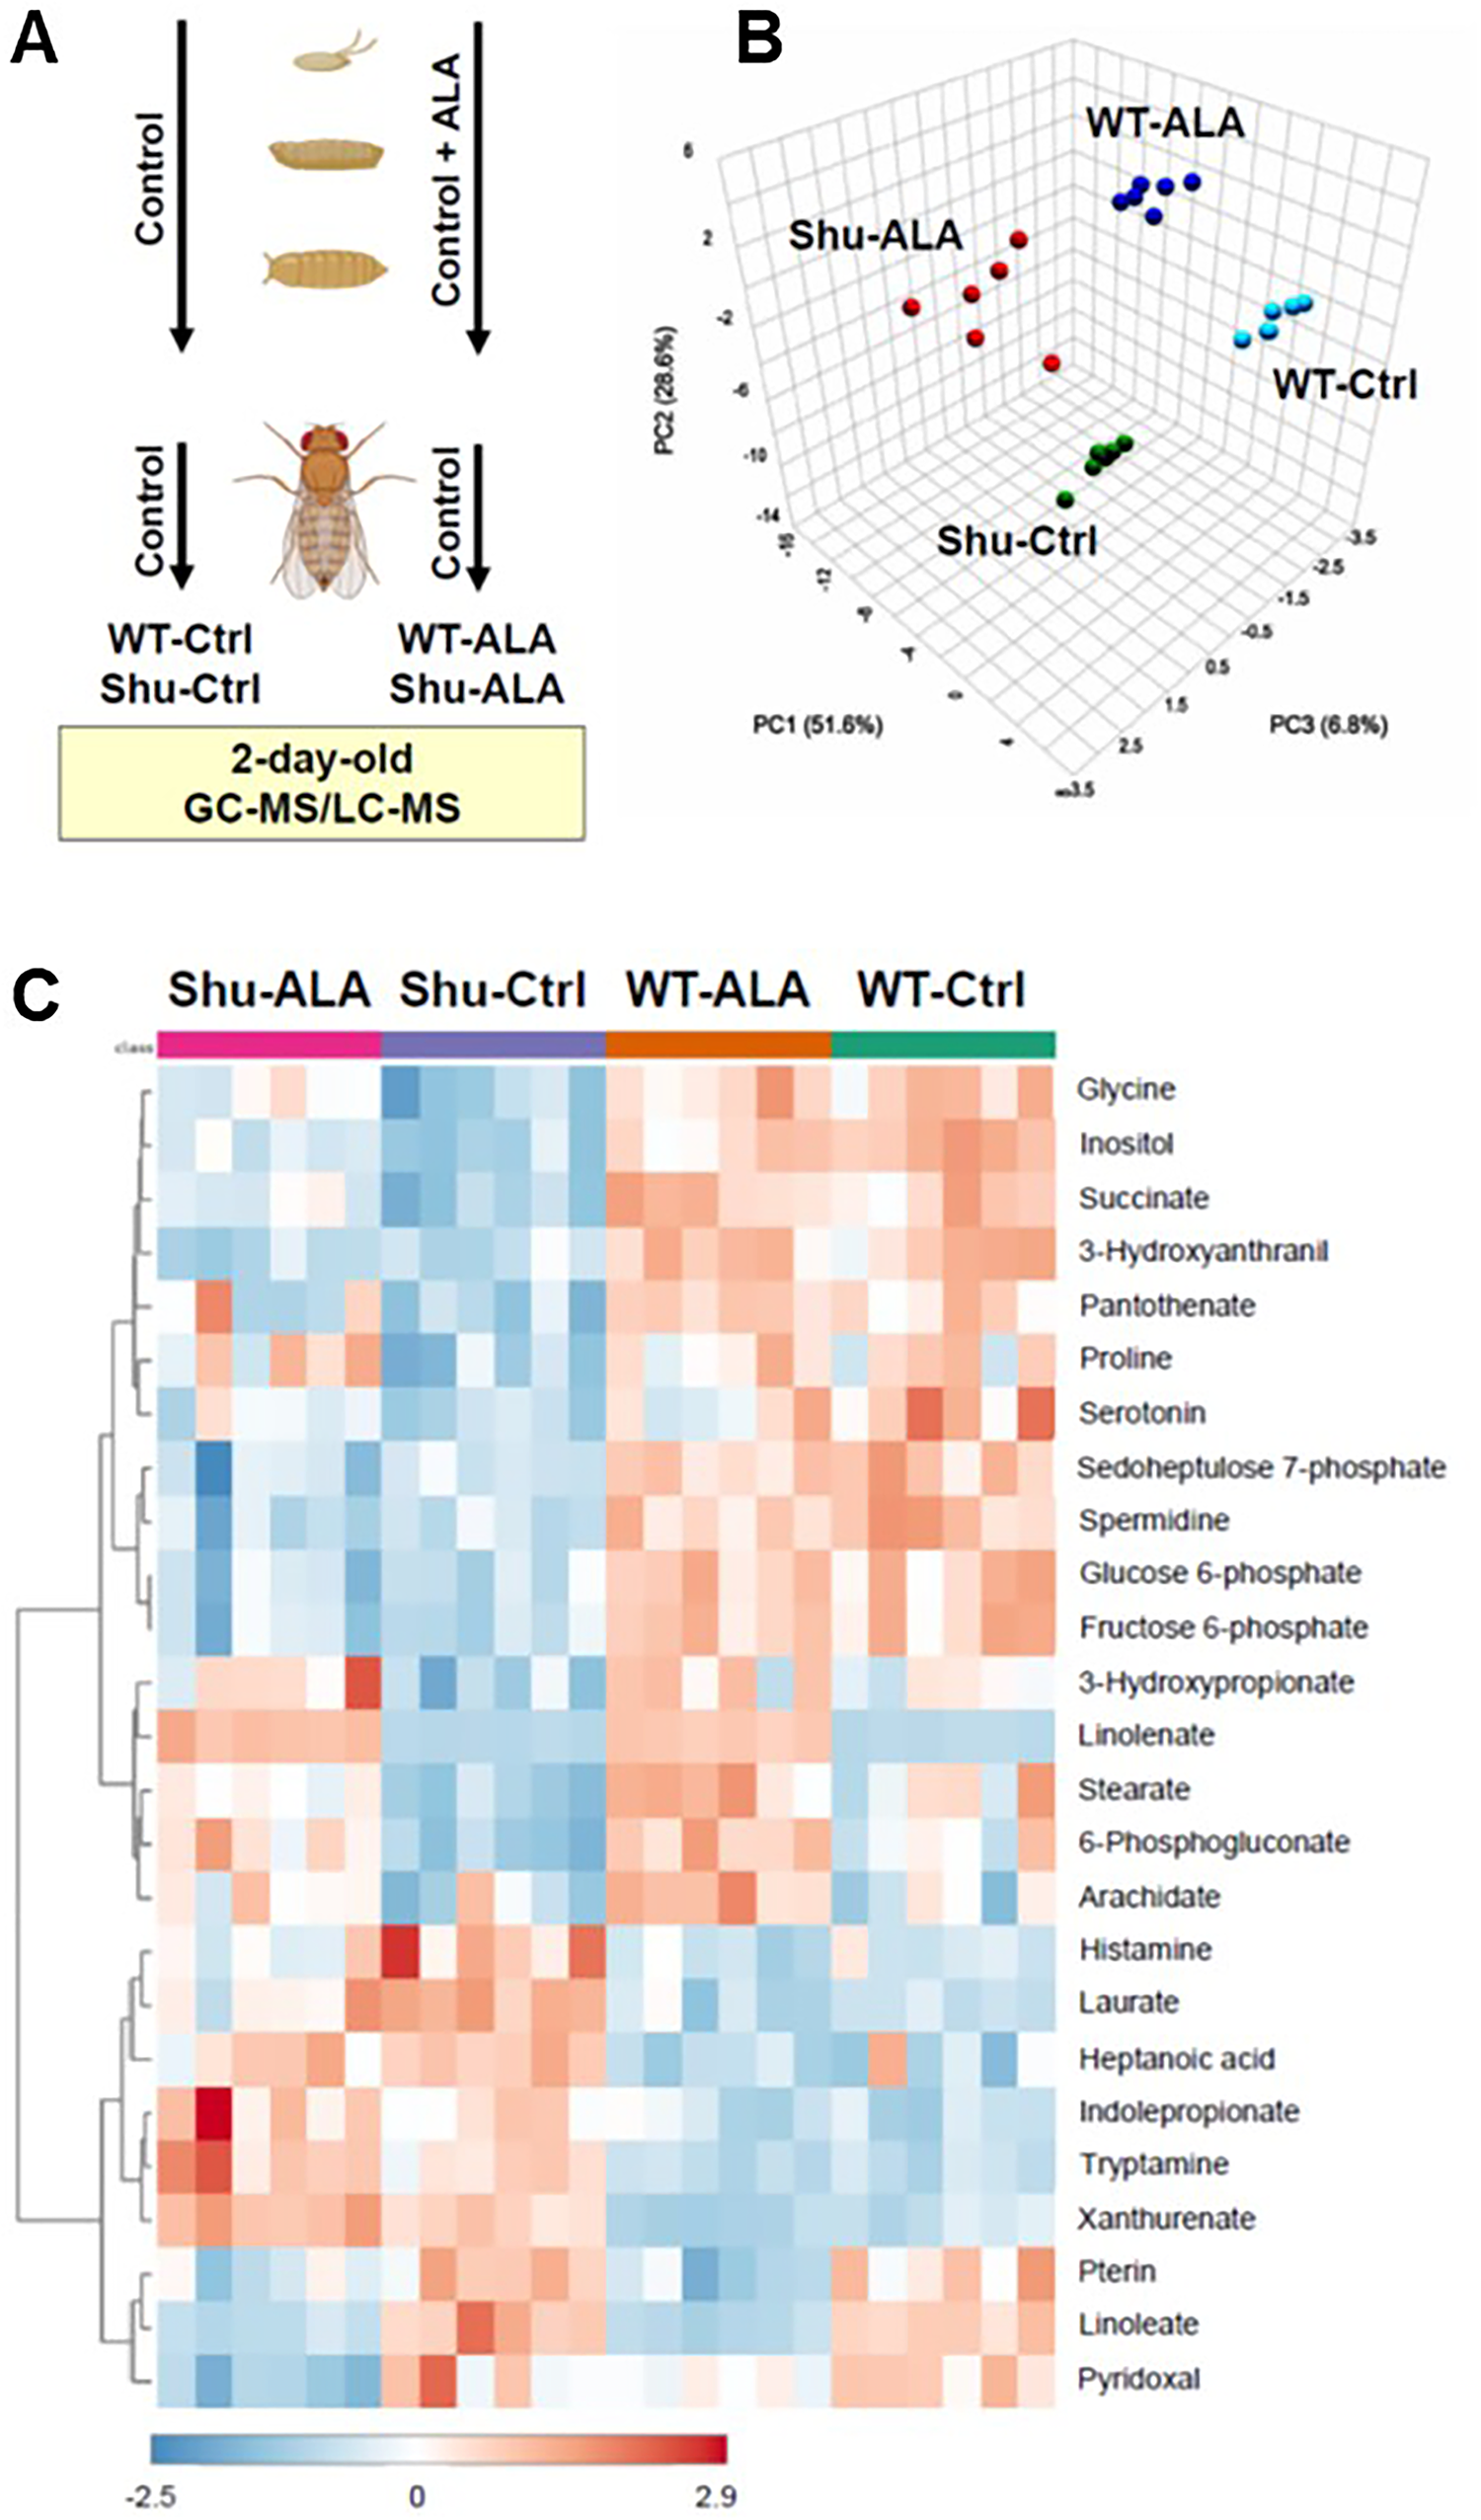
To identify metabolic changes resulting from the paraShu mutation and dietary ALA supplementation, we performed whole-body metabolomic analysis on adult female Drosophila using GC-MS and LC-MS (Fig. 1A). Four experimental groups were analyzed: (1) wild-type Canton-S (CS) flies on a control diet (WT-Ctrl), (2) paraShu heterozygotes on a control diet (Shu-Ctrl), (3) CS flies on a diet supplemented with ALA (WT-ALA), and (4) paraShu heterozygotes on a diet supplemented with ALA (Shu-ALA). A total of 172 metabolites were analyzed (Supplementary Table S2). Principal component analysis (PCA) showed that for each group the six biological replicates were tightly clustered and that the four groups were clearly separated (Fig. 1B). Thus, both the paraShu mutation and ALA supplementation induce reproducible changes in whole-body metabolite profiles and these changes are distinct.
Fig. 1
Whole-body metabolomic analysis of control and paraShu mutant flies with and without ALA treatment. A Schematic of the experimental design. WT-Ctrl and Shu-Ctrl flies were maintained on a control diet throughout the experiment. WT-ALA and Shu-ALA flies were reared on the ALA diet until eclosion, then transferred to a control diet for two days before analysis. Each group included six biological replicates, and each replicate included approximately 50 flies. B Three-dimensional principal component scatterplot. C Heatmap of hierarchical clustering based on the most significantly altered metabolites
One-way ANOVA was used to compare metabolite levels across the four experimental groups (Supplementary Table S3). Heatmaps of the 25 most significantly altered metabolites highlight the primary effects of the paraShu mutation and ALA treatment on the metabolome (Fig. 1C): seven of the affected metabolites are directly involved in fatty acid metabolism (linolenate, linoleate, laurate, stearate, heptanoic acid, arachidate, and 3-hydroxypropionate); five are associated with tryptophan metabolism (tryptamine, xanthurenate, 3-hydroxyanthranilic acid, serotonin, and indolepropionate); and four are involved in glycolysis or the pentose phosphate pathway (PPP; fructose 6-phosphate, glucose 6-phosphate, 6-phosphogluconate, and sedoheptulose 7-phosphate). Notably, significant effects were observed not only for host-derived metabolic products but also for metabolites of microbial origin, such as indolepropionate.
Given that the primary goal of this study was to identify metabolic changes associated with the hyperexcitability phenotype caused by the paraShu mutation, as well as with the suppression of paraShu phenotypes by dietary ALA, we performed two pairwise comparisons: (1) Shu-Ctrl vs. WT-Ctrl and (2) Shu-ALA vs. Shu-Ctrl. These analyses were conducted using Student’s t-tests with a false discovery rate (FDR) threshold of < 0.05. The number of significantly altered metabolites was 55 for Shu-Ctrl vs. WT-Ctrl, and 11 for Shu-ALA vs. Shu-Ctrl (Table 1). Seven metabolites were common to both comparisons (indicated in bold in Table 1). Notably, the levels of all these metabolites changed in opposite directions in response to the paraShu mutation and ALA treatment, consistent with ALA having suppressive effects on the physiological and behavioral phenotypes of paraShu.
Table 1 List of metabolites significantly affected by the paraShu mutation (A) and by dietary ALA supplementation (B)Group separation was visualized using Partial Least Squares Discriminant Analysis (PLS-DA; Fig. 2A, C), and the metabolites most responsible for this distinction were identified based on Variable Importance in Projection (VIP) scores (Fig. 2B, D). A VIP score greater than 1.0 is generally considered important for group discrimination. In the comparison between Shu-Ctrl and WT-Ctrl, propionic acid, cGMP, gluconate, and histamine had high VIP scores (5.1, 4.4, 3.2, and 3.1, respectively) indicative of strong contributions to group separation (Fig. 2C). In the comparison between Shu-Ctrl and Shu-ALA, these metabolites likewise had high VIP scores (1.1, 0.99, 1.53, and 0.94, respectively; Fig. 2D), and thus also appear to contribute to separation. Notably, paraShu and ALA had opposite effects on these metabolites. In the paraShu mutant the metabolite levels increased whereas in the context of dietary ALA supplementation they decreased (Fig. 2C, D).
Fig. 2
Multivariate analysis of metabolic effects of the paraShu mutation and dietary ALA supplementation. A, C Partial least squares discriminant analysis (PLS-DA) score plots comparing Shu-Ctrl and WT-Ctrl flies A, and Shu-ALA and Shu-Ctrl flies C. B, D Variable importance in projection (VIP) plots showing the metabolites that contributed most to the group separation observed in A and C. Metabolites in red were elevated and those in blue were reduced in Shu-Ctrl compared with WT-Ctrl B, and in Shu-ALA compared with Shu-Ctrl D
Metabolites that are significantly up- or downregulated by the paraShu mutation (Fig. 3A) or dietary ALA supplementation (Fig. 3B) were shown using volcano plots. Major metabolic pathways affected by these conditions were identified by pathway analysis using the MetaboAnalyst tool [36]. Applying cutoff criteria of FDR < 0.01 and a pathway impact score (PIS) > 0.3, we identified 18 significantly affected metabolic pathways in the Shu-Ctrl vs. WT-Ctrl comparison (Table 2). Among these, the six pathways with the highest PIS values were: (1) Alanine, aspartate, and glutamate metabolism (PIS = 0.804, FDR = 0.000106); (2) Nicotinate and nicotinamide metabolism (PIS = 0.773, FDR = 0.000593); (3) Pentose phosphate pathway (PPP) (PIS = 0.722, FDR = 8.98 × 10⁻⁵); (4) Glycine, serine, and threonine metabolism (PIS = 0.667, FDR = 0.00078); (5) Arginine biosynthesis (PIS = 0.629, FDR = 0.00326); and (6) Tryptophan metabolism (PIS = 0.549, FDR = 0.000459). In contrast, no pathways met these stringent criteria in the Shu-ALA vs. Shu-Ctrl comparison. However, when more relaxed cutoffs were applied (FDR < 0.05 and PIS > 0.3), Vitamin B6 metabolism (FDR = 0.026, PIS = 0.33) was found to be significantly affected by ALA in this comparison. In the following sections, we highlight key effects on metabolites within the pathways that are most significantly influenced by the paraShu mutation or dietary ALA treatment.
Fig. 3
Volcano plots of metabolite changes induced by the paraShu mutation and ALA supplementation. A Shu-Ctrl vs. WT-Ctrl flies. B Shu-ALA vs. Shu-Ctrl flies. Adjusted P-value (Padj) and fold change (FC) are indicated. Abbreviations of the labeled metabolites: NMeNam N-methylnicotinamide, S7P sedoheptulose 7-phosphate, 2PY N-methyl-2-pyridone-5-carboxamide, NR nicotinamide riboside, HNE 4-hydroxy-2-nonenal, XMP xanthosine monophosphate, F6P fructose-6-phosphate, GSSG glutathione disulfide
Table 2 Metabolic pathways significantly altered by the paraShu mutationCentral Carbon MetabolismCentral carbon metabolism (Fig. 4) is a network of biochemical pathways that processes carbon sources to generate energy, biosynthetic precursors, and reducing equivalents. The major central carbon mechanism pathways include glycolysis, the tricarboxylic acid (TCA) cycle, and the pentose phosphate pathway (PPP) [37], all of which were significantly affected in paraShu mutants (Table 2). The primary end product of glycolysis is pyruvate, and under anaerobic conditions it is converted to lactate through fermentation; this reaction regenerates nicotinamide adenine dinucleotide (NAD⁺) to allow glycolysis to continue (Fig. 4A). Levels of both pyruvate (FC = 1.44, FDR = 0.001) and lactate (FC = 1.30, FDR = 0.016) were significantly higher in paraShu mutants than wild-type flies, indicating that glycolytic flux is high in the mutants. However, levels of upstream intermediates of glycolysis, such as glucose 6-phosphate (FC = 0.66, FDR = 0.0051) and fructose 6-phosphate (FC = 0.68, FDR = 0.0027), were lower. This could potentially be due to increased consumption downstream, which would lead to substrate depletion. It is also possible that alternative sources of pyruvate are utilized, for example the three-carbon amino acids alanine, serine, and cysteine. Within the TCA cycle (Fig. 4B), levels of succinate (FC = 0.76, FDR = 0.00088) and fumarate (FC = 0.48, FDR = 0.018) were lower in the paraShu mutants, suggesting that the pathway is disrupted at the middle or late stage. Conversely, α-ketoglutarate was elevated in the mutant (FC = 1.49, FDR = 0.0037); this could reflect either a reduction in the conversion of α-ketoglutarate to downstream TCA intermediates or an increase in glutaminolysis (with glutamine metabolized to glutamate and subsequently to α-ketoglutarate). Collectively, these changes suggest that flux of the TCA cycle is impaired. The paraShu mutants also had significantly lower levels of 6-phosphogluconate (FC = 0.82, FDR = 0.018) and sedoheptulose 7-phosphate (FC = 0.69, FDR = 0.00088), both of which are PPP intermediates, as well as fructose 6-phosphate (FC = 0.68, FDR = 0.0027), a metabolite that is both a glycolytic intermediate and a product of the non-oxidative branch of the PPP (Fig. 4C).
Fig. 4
Effects of the paraShu mutation on central carbon metabolism. Shown are metabolites of central carbon metabolism, including those involved in glycolysis A, the tricarboxylic acid (TCA) cycle B, and the pentose phosphate pathway C. Differences in metabolites in Shu-Ctrl relative to WT-Ctrl flies are indicated as follows: red boxes, upregulated (FDR < 0.05); pink boxes, upregulated (FDR < 0.1); blue boxes, downregulated (FDR < 0.05); cyan boxes, downregulated (FDR < 0.1); yellow boxes, unchanged; white boxes, not measured. Fold change (FC) values are shown, where FC > 1 denotes an increase and FC < 1 denotes a decrease in metabolite levels in Shu-Ctrl flies relative to WT-Ctrl flies
Treatment of paraShu mutants with ALA partially reversed some of the effects of paraShu on the central carbon metabolism. Dietary ALA supplementation led to increased levels of succinate (FC = 1.14, FDR = 0.049) and 6-phosphogluconate (FC = 1.32, FDR = 0.0042), suggesting that function of the TCA cycle and PPP were improved. However, it did not lead to significant increases in levels of core glycolytic intermediates (FDR < 0.05), suggesting that that ALA does not substantially affect glycolysis.
Amino Acid MetabolismThe paraShu mutation profoundly alters amino acid metabolism. Of the 55 metabolites that differed significantly (FDR < 0.05) between paraShu and wild-type flies, 18 are directly involved in amino acid metabolism (marked with an asterisk in Table 1A). Among them, those that were present at significantly higher levels in paraShu flies were the neurotransmitter-related metabolites histamine (FC = 2.0, FDR = 0.017) and gamma-aminobutyrate (GABA; FC = 1.25, FDR = 0.019). Another was the methionine derivative homocysteine (FC = 1.35, FDR = 0.025). Another set of amino acids and their derivatives were lower in paraShu mutants. These included alanine (FC = 0.90, FDR = 0.046), beta-alanine (FC = 0.83, FDR = 0.016), glutamine (FC = 0.88, FDR = 0.045), glycine (FC = 0.75, FDR = 0.001), proline (FC = 0.81, FDR = 0.019), arginine (FC = 0.79, FDR = 0.0004), and cadaverine, a lysine derivative (FC = 0.85, FDR = 0.026).
Beyond its role in protein synthesis, tryptophan is a precursor to several important bioactive compounds, including NAD⁺, which supports energy metabolism and redox homeostasis [38]), and serotonin, which functions as both a neurotransmitter and a neuromodulator. Tryptophan is metabolized through three major pathways—the kynurenine, serotonin, and indole pathways [39,40,41]. All of these are markedly affected by the paraShu mutation (Fig. 5). In the kynurenine pathway (Fig. 5A), levels of xanthurenate (FC = 1.44, FDR = 0.00026) were higher, whereas those of 3-hydroxykynurenine (FC = 0.76, FDR = 0.023) and 3-hydroxyanthranilic acid (FC = 0.78, FDR = 0.0037) were lower. These changes suggest that the metabolic flux through branches of the kynurenine pathway that support NAD⁺ synthesis may be impaired in paraShu mutants, potentially disrupting redox regulation. In contrast, metabolites within the oxoadipate-acetyl-CoA branch of tryptophan degradation were not significantly altered in paraShu mutants. In the serotonin pathway (Fig. 5B), serotonin levels were lower (FC = 0.86, FDR = 0.036), indicating that serotonergic signaling was diminished. In the indole pathway (Fig. 5C), levels of tryptamine and indolepropionate were higher (tryptamine: FC = 1.74, FDR = 0.0088; indolepropionate: FC = 1.19, FDR = 0.0051), whereas levels of tryptophol were lower (FC = 0.81, FDR = 0.019). Notably, indolepropionate and tryptophol are not synthesized de novo by Drosophila melanogaster; their presence in flies therefore primarily reflects gut bacterial metabolism of tryptophan. Although tryptamine can, in principle, be synthesized by the host via aromatic L-amino acid decarboxylase, this reaction is kinetically unfavorable [42]. Thus, tryptamine detected in flies is likely derived from dietary sources and/or produced by the gut microbiota.
Fig. 5
Effects of the paraShu mutation on metabolites in the tryptophan pathway. Tryptophan metabolites in the kynurenine A, serotonin B, and indole C pathways are shown. Differences between Shu-Ctrl and WT-Ctrl flies are indicated as follows: Red boxes, upregulated (FDR < 0.05); pink boxes, upregulated (FDR < 0.1); blue boxes, downregulated (FDR < 0.05); cyan boxes, downregulated (FDR < 0.1); yellow boxes, unchanged; white boxes, not measured. Fold change (FC) values are shown, where FC > 1 denotes an increase and FC < 1 denotes a decrease in metabolite levels in Shu-Ctrl flies relative to WT-Ctrl flies
The effects of the paraShu mutation on amino acids were partially reduced by ALA supplementation. Notably, although levels of proline and glycine—which are central to redox balance and neurotransmission—were lower in paraShu mutants, they were normalized in the context of ALA supplementation (proline: FC = 1.24, FDR = 0.049; glycine: FC = 1.18, FDR = 0.049), showing that dietary ALA helps restore neurochemical and metabolic homeostasis.
Nucleotide MetabolismThe metabolomic profile of the paraShu mutant also revealed widespread perturbations in nucleotide metabolism, including both the purine and pyrimidine pathways. Levels of several pyrimidine nucleotides were higher. This was the case for CMP (FC = 1.54, FDR = 0.00139), UMP (FC = 1.48, FDR = 0.00413), CDP (FC = 1.89, FDR = 0.0129), and dCMP (FC = 1.16, FDR = 0.0439). Similar trends were observed for the nucleoside thymidine (FC = 1.76, FDR = 0.00815) and its precursor thymine (FC = 1.29, FDR = 0.029). These findings suggest that the biosynthesis and turnover of pyrimidines were increased overall. In contrast to the observed trend for an increase in pyrimidine levels, the effects on purine metabolism were inconsistent (Fig. 6). Levels of both GMP (FC = 1.28, FDR = 0.000884) and its signaling derivative cGMP (FC = 2.4317, FDR = 0.00041612) were markedly increased, consistent with a shift toward guanine nucleotide accumulation and increased cGMP-mediated signaling. However, levels of several purine intermediates were significantly lower. These included XMP (FC = 0.47, FDR = 0.0129), xanthosine (FC = 0.62, FDR = 0.0278), and dGDP (FC = 0.776). Notably, levels of cAMP were higher in the mutant (FC = 1.66, FDR = 0.00244). The contrast between this observation and the decrease in dGDP levels highlights that the deoxynucleotide balance is disrupted.
Fig. 6
Effects of the paraShu mutation on metabolites in the purine pathway. Purine metabolites are shown. Differences between Shu-Ctrl and WT-Ctrl flies are indicated as follows: red boxes, upregulated (FDR < 0.05); pink boxes, upregulated (FDR < 0.1); blue boxes, downregulated (FDR < 0.05); cyan boxes, downregulated (FDR < 0.1); yellow boxes, unchanged; white boxes, not measured. Fold change (FC) values are shown, where FC > 1 denotes an increase and FC < 1 denotes a decrease in metabolite levels in Shu-Ctrl flies relative to WT-Ctrl flies. Red boxes, upregulated (FDR < 0.05); pink boxes, upregulated (FDR < 0.1); blue boxes, downregulated (FDR < 0.05); cyan boxes, downregulated (FDR < 0.1); yellow boxes, unchanged; white boxes, not measured. Fold change (FC) values are shown, where FC > 1 denotes an increase and FC < 1 denotes a decrease in metabolite levels in Shu-Ctrl flies relative to WT-Ctrl flies
Fatty Acid MetabolismThe paraShu mutation and ALA supplementation also noticeably influenced fatty-acid metabolism. Among the saturated fatty acids, five were markedly affected. Specifically, levels of two SCFAs, propionic acid (C3:0) (FC = 2.65, FDR = 4.46 × 10− 5) and butyric acid (C4:0) (FC = 1.28, FDR = 0.0179), and two medium-chain fatty acids (MCFAs), heptanoic acid (C7:0) (FC = 1.37, FDR = 0.0323) and lauric acid (C12:0) (FC = 1.31, FDR = 0.0162), were markedly higher in paraShu mutants (Fig. 7A–D). In contrast, levels of the long-chain fatty acid (LCFA) stearic acid (C18:0) (FC = 0.773, FDR = 0.0278) were lower (Fig. 7E). ALA treatment partially reversed most of these effects in paraShu mutants. Levels of propionic acid and butyric acid were 35% and 11% lower, respectively, in ALA-treated paraShu mutants (Fig. 7A, B). Levels of lauric acid and stearic acid in ALA-treated paraShu mutants were also approaching to those in wild-type flies (Fig. 7D, E). The exception was heptanoic acid, which remained elevated in paraShu mutants compared with wild-type flies, regardless of diet type (Fig. 7C). Among the fatty acids altered in paraShu mutants, the SCFAs propionic acid and butyric acid are primarily produced by gut microbiota [43], whereas the medium- and long-chain fatty acids reflect host lipid metabolism or dietary intake and are not considered direct microbial products.
Fig. 7
Effects of the paraShu mutation and dietary ALA supplementation on levels of fatty acids. Relative levels of fatty acids in WT-Ctrl (cyan), WT-ALA (navy), Shu-Ctrl (green), and Shu-ALA (red) flies, shown as mean ± SEM for six biological replicates. A Propionic acid (C3:0), B Butyric acid (C4:0), C Heptanoic acid (C7:0), D Lauric acid (C12:0), E Stearic acid (C18:0), F LA (C18:2), G ALA (C18:3). Different lowercase letters (a, b, c) above bars indicate statistically significant differences among groups (groups that share a letter are not significantly different). C3:0 propionic acid, C4:0 butyric acid, C7:0 heptanoic acid, C12:0 lauric acid, C18:0 stearic acid, C18:2 linoleic acid, C18:3, α-linolenic acid
We also examined effects on linolenate and linoleate, the ionic forms of ω−3 ALA and ω−6 linoleic acid (LA), respectively. As expected, linolenate levels were significantly higher after dietary ALA supplementation in both wild-type flies (FC = 8.96, FDR = 3.67 × 10− 10) and paraShu mutants (FC = 12.2, FDR = 1.48 × 10− 8 (Fig. 7G). Notably, although linolenate and linoleate cannot be interconverted enzymatically or chemically in the body, linoleate levels were approximately 50% lower in both wild-type flies and the mutants fed the ALA-supplemented diet (Fig. 7F). These findings suggest that the ω−3 and ω−6 fatty acid metabolic pathways strongly regulate one another.
Comments (0)