The E3N-Generation cohort
E3N-Generation cohort is an national, ongoing, prospective cohort study [24]. Between June 1990 and November 1991, 98,995 women born between 1925 and 1950 and insured by the French national health insurance scheme for national education workers (MGEN) who were living in continental mainland France were enrolled, after having given written informed consent (www.e3n.fr). This cohort is part of the European Prospective Investigation into Cancer and Nutrition (EPIC study), which included 10 European countries [25]. The objective of the EPIC study is to investigate risk factors for cancer and other chronic diseases in women. At inclusion, women completed a self-questionnaire about lifestyle, reproductive factors, anthropometry, medical history, including benign breast disease and gynaecological screening and familial history of cancer. After the initial inclusion in 1990, follow-up questionnaires were sent every 2 to 3 years thereafter. To date, 13 questionnaires have been sent with a mean participation rate of about 83%. Each follow-up questionnaire collected information on the occurrence of breast or other cancers and the reasons for any hospitalization or medical care at home, specifying the month and year of each event. A copy of the pathology report or any medical examination confirming the diagnosis of breast cancer was requested from the patient or the physician. Tumour characteristics, including histological type and hormone receptor status, were extracted from these reports [26]. Here, only data collected from the questionnaires up to 2011 have been analysed [24], and a rural or urban residential status at birthplace was assigned based on data from the most recent national census [27].
XENAIR: a case-control study nested within the E3N-Generation cohort
XENAIR, a case-control study nested in the E3N-Generation cohort, has been previously described [28]. Breast cancer cases were identified by self-administrated questionnaires, insurance data or for around 1% of the cases by linkage with the National Services on Causes of Deaths and using information on causes of death [28]. Overall, 93% of the incident breast cancer cases were validated by pathology reports. Cases were included even when pathology reports were not available because of the very low percentage of self-reported false positives (<5%). Tumour characteristics, including histological type and hormone receptor status, were extracted from the pathology reports. When more than one breast tumour was diagnosed at the same time, we recorded the tumour-node-metastasis (TNM) stage for the most advanced breast tumour, or grade of differentiation, if the TNM stages were the same. A total of 6298 histologically confirmed incident invasive breast cancer cases were identified in the E3N-Generation cohort during the 1990–2011 follow-up period.
Each case was matched to a control, randomly selected in the E3N-Generation cohort by incidence density sampling, using at time since entry into the cohort as the time scale. Controls with a blood sample were matched on age ( ± 1 year), French Department of residence (INSEE, 2023), corresponding to “NUTS-3” in the classification of territorial divisions of the European Union (Eurostat, 2021), date of blood collection ( ± 3 months) and menopausal status at the time of blood collection. Controls without a blood sample were matched on the same criteria but these criteria were assessed at baseline (i.e., the time of entry into the cohort) rather than at blood collection, and were additionally matched on the availability or not of a saliva sample. Breast cancer cases were selected based solely on clinical criteria. The availability of a blood sample was not used for case selection but was applied as a matching criterion for selecting controls to enable future analyses.
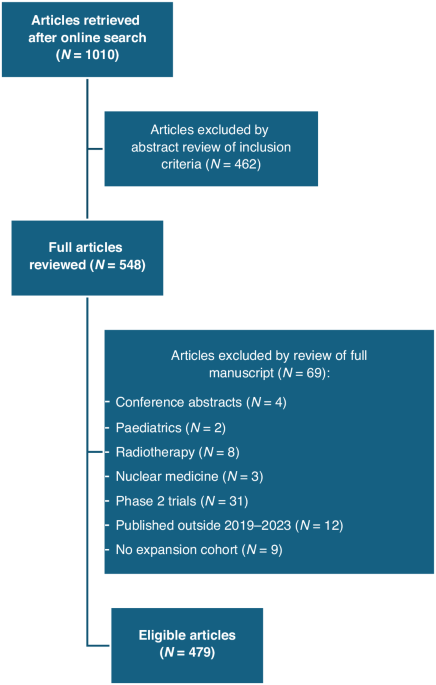
Among the 6298 incident cases of primary invasive breast cancer and their 6298 matched controls initially involved in the study, women with Paget’s disease and phyllodes tumours (n = 19 cases, and their matched controls, 0.3%), those with missing matching variables (n = 3 women, and their matched women, 0.05%) and those with at least two missing addresses, as well those living abroad during follow-up time (n = 1054 women, and their matched women, 16.7%) were excluded [26, 28]. Thus, 5222 incident cases of primary invasive breast cancers and 5222 matched controls were included in this study.
Assessment of long-term exposure to airborne PM2.5 and PM10Estimation of atmospheric PM concentrations
The average annual atmospheric PM concentrations were estimated at the individuals’ residential areas each year from 1990 to 2011, using addresses collected through the E3N-Generation follow-up questionnaires. Two different models of exposure assessment were used to estimate PM concentrations: a land use regression (LUR) model, with a spatial resolution of 50 × 50 m, and an atmospheric chemistry-transport model named CHIMERE, (0.125° × 0.625° resolution, roughly 7 × 7 km) [28, 29]. LUR is a common statistical approach that models the spatial variability of air pollutants [30, 31]. The model is built up of several variables, mainly geographical features (e.g., land use, road networks, traffic or terrain) calculated from circular buffers of different sizes, considered to have an impact on local concentrations [30, 32, 33]. Baseline LUR model were first develop for 2010–2012, and validated against measurements across France (n = 94 and 336 for PM2.5 and PM10, respectively) by performing a hold-out validation. The monitoring sites were randomly split into five groups for each pollutant and we undertook 5-fold cross-validation by leaving one group out at a time, maintaining the same variables and allowing the coefficients to vary, to predict concentration values at sites in the held-out group. The summarized performance shows robust results with R² values of 0.56 for PM2.5 and 0.66 for PM10. Models were back-extrapolated to 1990, after assessment and comparison of four different back-extrapolation approaches against measurements. Model performance remains stable until 2005, after which it declines and fluctuates markedly. This pattern can partially be explained by the substantial reduction in the number of monitoring stations available, particularly before 2002. This limitation constrains the conclusions that can be drawn regarding past model performance but comparisons with baseline models indicate that back-extrapolation reduces the mean error by approximately 20%. These exposure models were already used in two epidemiological studies on breast cancer [34, 35]. The CHIMERE model, develop by the National Institute for Industrial Environment and Risks [36, 37], is the European reference chemistry transport model. The model use emission data, meteorological fields, and boundary conditions as inputs and computes a set of equations representing the physical and chemical processes involved in the evolution of concentrations. The performances of this model are detailed for 2013 at the European level by Couvidat et al. in comparison with daily concentrations (PM10: correlation: 0.6 / RMSE: 9.3; PM2.5 correlation: 0.68 / RMSE: 6.95) [38]. Data from the CHIMERE model has been used in several previous analyses in the same population investigating the effect of other pollutants on the risk of breast cancer [26, 35, 39, 40].CHIMERE is a Eulerian deterministic model that simulates pollutant atmospheric dispersion and other physical and chemical processes using emission data, meteorological fields, and boundary conditions as inputs, and provides hourly averaged concentrations from 1990 to 2010. As PM2.5 and PM10 concentrations were not available for 2011, concentrations were extrapolated using average change rates of the last 5 years available (2005 to 2010) for each address.
Since concentrations of PM2.5 and PM10 can have locally very high concentrations, near major roads for example [30, 32, 33], the main analyses of the study used exposure estimated by the LUR model (higher spatial resolution than CHIMERE). Sensitivity analyses for exposure to PM2.5 and PM10 were performed using the CHIMERE model [41].
The residential history of the participants was geocoded by trained technicians, blinded to the subjects’ case or control status, using the ArcGIS Software (ArcGIS Locator version 10.0, Environmental System Research Institute (ESRI), Redlands, CA, USA) and the address database, BD Address®, from the National Geographic Institute [29]. First, addresses were geocoded automatically and then 16.9% were manually relocated to improve their accuracy. Manual relocation was performed for addresses with low spatial precision or low textual accuracy, following previously described criteria [29]. If addresses were missing at any time during follow-up, the previously recorded address was systematically assigned [26].
Annual mean PM concentration values (in µg/m3) were assigned to the geocoded consecutive residential addresses of each woman, for each year, from inclusion in the cohort to the index date. If a woman moved within a year, the PM2.5 and PM10 concentrations were weighted by the time spent at each address. An average of the annual mean PM2.5 and PM10 concentration estimates was then calculated for each woman, by adding the concentrations estimates of each year from inclusion in the cohort to the index date and dividing by the number of years of follow-up.
Statistical analyses
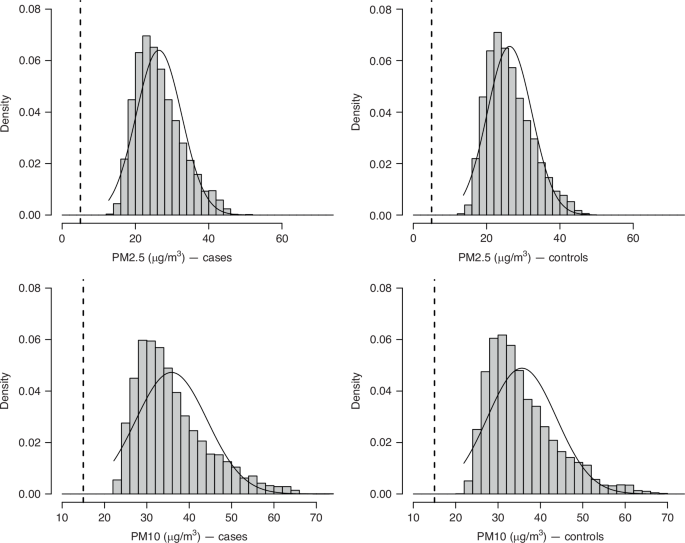
The statistical analyses for PM2.5 and PM10 were run separately, as they are considered as two different pollutants. Atmospheric exposure estimates for PM2.5 and PM10, socio-demographic characteristics and other covariates were described for cases and controls, using mean and standard deviation (SD) for continuous variables, and frequency and percentage for categorical variables. All characteristics were collected at baseline (1990), except for alcohol consumption, which was collected at the third questionnaire (1993). Information available in the questionnaire before the index date was used to determine menopausal status and menopausal hormonal replacement treatments. The distributions and evolution over time (1990–2011) of the mean estimated annual PM2.5 and PM10 concentrations at the different addresses of the participants were graphically described.
OR and corresponding 95% CIs for invasive breast cancer were estimated using conditional logistic regression models, with PM2.5 and PM10 exposure as continuous variables, for an increment of 10 µg/m3 to be homogenous with other studies. A directed acyclic graph (DAG) was used to select the sufficient set of minimal adjustment variables (Fig. S1). This resulted into two sets of variables. The first one included level of education (secondary, 1- or 2-year university degree, and ≥3-year university degree, used as a proxy for socio-economic status) and urban / rural location at inclusion. The second one involved total physical activity (<25.3, 25.3–35.5, 35.6–51.8, and ≥51.8, in metabolic equivalent task per hour per week (MET-h/week)), tobacco smoking status (never, current, former), alcohol drinking (never, ≤6.7 g/day, and >6.7 g/day), body mass index (BMI) (<25, 25–30, and ≥30 kg/m²), parity and age at first full-term pregnancy (no child, 1 or 2 children and age <30 years, 1 or 2 children and age ≥30 years, ≥3 children), breastfeeding (ever, never), oral contraceptive use (ever, never), menopausal hormone replacement therapy use (HRT) (ever, never), mammography before inclusion (yes, no), urban/rural location at inclusion, and urban/rural location at birthplace (urban and rural). We also considered a third set which included the first set and other variables identified as known and potential risk factors of breast cancer in the literature: age at menarche (<12, 12–14, and ≥14 years), menopausal status at index date (premenopausal, postmenopausal), previous family history of breast cancer (yes, no), and previous history of benign breast disease (yes, no). Subgroup analyses were also carried out using breast tumour hormone receptors status (oestrogen receptors (ER) and progesterone receptors (PR)) stage (I, II, III and IV), grade (I, II, III and IV) and histology subtypes of the tumour (ductal, lobular, tubular and, both ductal and lobular).
Assuming data were missing at random, multiple imputation was conducted for the following variables: alcohol intake (28.9% of missing data), urban/rural status of the municipality at birthplace (11.1% of missing data), age at menarche (2.0% of missing data), BMI (1.9% of missing data), oral contraceptive use (0.9% of missing data), family history of breast cancer (1.6% of missing data), parity and age at first full-term pregnancy (1.1% of missing data), education level (0.7% of missing data), smoking status (0.3% of missing data) and total physical activity (0.1% of missing data). We carried out 10 imputations, each with 10 iterations with a multivariate imputation via a chained equations approach (MICE) [42]. All variables included in the different adjustment models, matching variables and exposure variable were considered as predictors. Analyses were conducted in parallel across the 10 imputed datasets and subsequently pooled using Rubin’s rules.
Simple imputation was used for menopausal status at inclusion. If age at menopause was missing and a woman’s age at inclusion was less than 51 years (median age at menopause of women in the E3N cohort), women were considered premenopausal at inclusion, otherwise, women were considered postmenopausal at inclusion [43].
For women with missing data on oral contraceptive use at index date and having reported ‘never use’ at baseline, we assumed for these women that they continued ‘never use’ during follow-up, since age at cohort inclusion was 40 to 65 years. No imputation was performed for menopausal hormone therapy (MHT) as this variable is highly dependent on age and menopausal status, but a missing data category was created.
The linearity of the logit of the effect of the quantitative variables (PM2.5 and PM10 exposure) was investigated using second-order fractional polynomials.
The effect modification by total physical activity, BMI, level of education, tobacco smoking status, breastfeeding and menopausal status during follow-up were tested by including interaction terms between these variables and exposure to PM2.5 and PM10, using the first adjusted model. Menopausal status over the study period was analysed in three categories: premenopausal (women who self-reported premenopausal on the last returned questionnaire or an age at menopause greater than their age at the index date), postmenopausal (women who self-reported postmenopausal on the last returned questionnaire before the index date or an age at menopause younger than their age at the index date), and women premenopausal at study inclusion who transitioned to postmenopausal status before the index date (i.e., women whose status changed during follow-up). Premenopausal and postmenopausal status refer to women who remained in the same category throughout the follow-up period. The third category was defined based on evidence that the menopausal transition represents a window of susceptibility to environmental exposures, particularly those with endocrine-disrupting properties, due to substantial hormonal and structural changes in breast tissue during this period [44,45,46].
A sensitivity analysis was performed using only matched pairs that had been followed for at least 2 years to analyse only data for women with a relatively long follow-up time since breast cancer is known to have a long period of latency.
All statistical analyses were performed with SAS version 9.4 and R software version 4.2.0 and the threshold for statistical significance was set at 5%.

Comments (0)