
Remember me
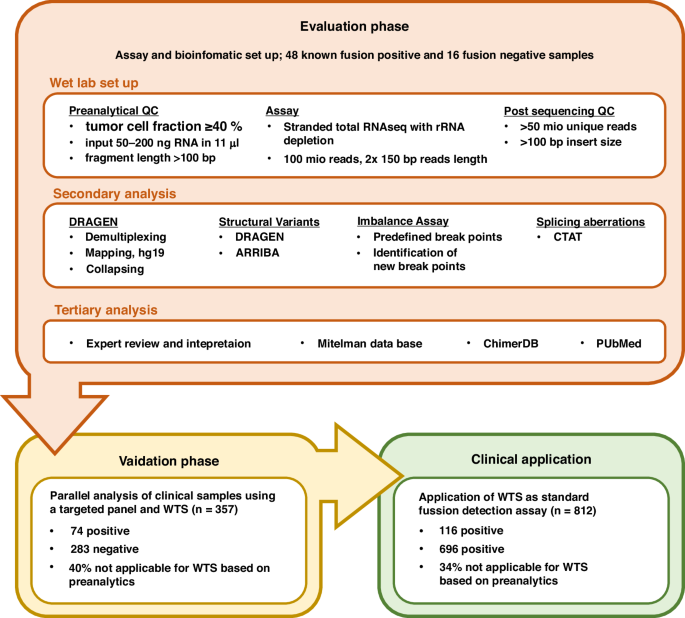
For the implementation of WTS to determine fusion and splice variants in routine diagnostics, an evaluation cohort (EC) of 64 clinical FFPE samples was selected in a first step. All 64 samples (Fig. 2a-g) were previously sequenced with a targeted panel-based assay (hybrid–capture based TSO500 RNA; AMP-based Archer Fusion Plex Pan Solid Tumor v2) for fusion calling established in our lab. In contrast to those assays the now applied WTS approach is based on a stranded protocol with rRNA depletion. For comparison of the different methods, the analysis of the fusion and splice variant calling using WTS was restricted to genes included in the two targeted panels (Supplementary Table 1). Fusion and splice variant calling in the WTS samples was initially performed using the three bioinformatic pipelines Arriba, Dragen and the CTAT-splicing in parallel (Fig. 1).
Of the samples with known fusions (n = 48) in the EC, 44 (92%) were successfully identified with the WTS approach. All fusion negative samples (n = 16) were negative for the genes tested with WTS (Fig. 2c-g).
The selected samples of the EC consisted predominantly of non-small cell lung cancer (NSCLC, n = 44), prostate adenocarcinoma (PRAD, n = 10), colon/rectum adenocarcinoma (COAD/READ, n = 2) and cancer of unknown primary (CUP, n = 2) (Fig. 2a). The largest proportion of detected fusions involved ERG followed by RET and ALK (Fig. 2b).
Four fusion-positive samples were not identified by our initial WTS analysis pipelines: an EGFR::EGFR exon duplication (case N1), a BRCA2::SLC4A4 fusion (case N2), a MET Δex14 (case N3) and an EML4::ALK (case N4) fusion (Fig. 2g).
A more detailed analysis of the QC parameters of the four false-negative samples revealed a TCC of 50%, 30% (two samples), and 10% respectively (Fig. 2c). Regarding the RNA input amount, two samples were at the lower end with 50 ng, one had 150 ng and one the maximum input amount of 200 ng (Fig. 2d). The distribution of unique mapped reads for all samples spanned from 32 M to 140 M reads with a median of 96 M reads. The four failed samples ranged from 70 M to 100 M reads close to the median (Fig. 2e. For the mean insert size of the fragments, all four failed samples were above the median of 129 bp ranging from 133 bp to 138 bp with an overall distribution from 116 bp to 152 bp (Fig. 2f). The amount of RNA input above 50 ng, the number of unique reads and insert length did not generally affect the successful fusion detection using the WTS approach in this cohort.
A bioinformatic imbalance assay supports fusion callingNext, we investigated the failed detection of N1-N4. Case N1 is a duplication of kinase domain exon 18-25 in EGFR with a TCC of 30%. Therefore, rather than being a fusion or splicing alteration, it is the result of a structural variant. At the DNA level, this is most accurately classified as a copy number variation (CNV) event. At the RNA level, this leads to reads spanning from exon 25 to exon 18, as can be seen in the WTS data (Supplementary Fig. 1). However, the alteration was not identified because it falls outside the scope of the bioinformatic tools used. N2 is a deleterious BRCA2 translocation nonsense-mediated mRNA decay [38] with a TCC of 30%, the MET Δex14 in N3 was not detected at a TCC of 10%.
The EML4::ALK fusion in case N4 had a TCC of 50%. No reads specific for an ALK fusion could be detected. Reads mapping to the exons coding for the ALK protein kinase domain were present, but not for the upstream exons (Fig. 3). As shown before, unbalanced transcript expression is a predominant feature of fusion transcripts [23]. In the case of ALK, which is not expressed in adult wild-type tissue [39], expression starting after exon 19, where most of ALK translocations occur [40], could be indicative of an ALK fusion. Therefore, an imbalance assay was developed as an additional approach to infer the presence of a gene for the indication of fusions. In the case of the detection of an unbalanced expression, additional confirmation by an orthogonal test can then be performed in a clinical diagnostic workup.
Fig. 3: A—Imbalance Assay for EML4::ALK fusion.
Top: IGV representation of the missed EML4::ALK fusion in WTS: +/- represent the positive/negative strand based on stranded protocol information. Spliced reads for ALK on the + strand are depicted as grey lines connecting the grey cigars, spliced reads of the—strand are depicted in blue. The splice junction track on top represents splice junctions on the + strand in blue and on the—strand in red. Unspliced reads originating from CLIP4 reaching into the kinase domain of ALK on the—strand. Bottom: Visualization of the EML4::ALK fusion with the coverage track on top, the exon and breakpoint representation below and the resulting fusion transcript on bottom.
Therefore the mean coverages between the exons on both sides of the most common breakpoints from Mitelman Database [24] and in-house database in the gene-set (Supplementary Table 2) as well as the spliced reads on the gene-specific strand were counted and visualized in IGV (Fig. 3). For this specific case, considering the gene specific strand for the ALK transcript, exons 1–19 showed a mean coverage of 0.03x and exon 20–34 of 7.37x. This represents a fold-change of 59.2. Second, the counts for these regions showed 84 vs. 0 spliced reads on the gene specific strand. Both aspects suggest a strongly increased transcriptional activity for the 3’ part of ALK. Of note, by investigating the WTS data of this ALK fusion, plenty of unspliced RNA on the opposite strand to the ALK transcript could be seen originating from CLIP4 pre-mRNA. Hence, the strand identity has to be considered for the mean coverage, to prevent false positive counts based of the antisense strand. The count of splice junctions on the other hand was not biased by antisense reads.
In summary, taking the results of our EC into account we defined the following thresholds of pre-sequencing QC metrics for calling of fusions and alternate splicing events in WTS: TCC of 40% or more and a total input amount of at least 50 ng of RNA. For post-sequencing QC metrics, we established a cutoff for valid samples of at least 50 M unique reads and median insert sizes of at least 100 bp. Significantly different transcriptional activities in genes with known therapeutic targets for a pre-defined gene-set (Supplementary table 2), like RET, ROS1, and ALK missing unambiguous split reads, were subjected for reanalysis with a targeted panel.
Validation of the WTS fusion and splice variant calling pipeline for diagnostic useFollowing the analysis of the EC results and implementation of the imbalance assay, the approach was validated by parallel analysis of a set of routine diagnostic samples (n = 357; validation cohort (VC); Fig. 4a-f) with a targeted fusion panel and WTS. The predominant cancer types were NSCLC (n = 253; 70.9%) followed by CUP (n = 62; 17.4%) and other solid tumor types, grouped in other (n = 31; 8.7%).
Fig. 4: Fusion detection using WTS in the validation cohort (n = 357).
Tree maps representing the composition of cancer types (a) and oncogenic fusion partner (b) in the VC. c–f Violin plots with embedded boxplots showing the distribution of sequencing QC metrics for all samples. Sample distribution for QC metrics are shown in (c) by TCC; d RNA input amount (ng); e Unique molecules sequenced; f Library insert sizes (bp). Green dots indicate cases where a fusion was detected, red dots indicate cases where the fusion was expected but not found, and grey dots represent cases with no fusion in the panel. The red dashed lines mark thresholds for relevant sequencing metrics of 40% TCC, 50 ng RNA input, 50 M unique reads and 100 bp insert size.
Of the 357 VC samples, 131 (37%) had a TCC below 40% (36.7%), 4 samples were sequenced with a total RNA input below 50 ng (1.1%), 21 samples did not reach the 50 M unique reads after collapsing (5.9%) (Fig. 4c-f). Thus, 144 samples did not meet the pre-defined QC criteria (40.3%), while 213 samples (59.7%) met all QC criteria, applying the TCC threshold of 40%, over 50 ng total RNA input, more than 50 M unique sequenced reads and a median insert size of above 100 bp.
Applying the QC-metrics we established resulted in a 100% match in fusion calls between the WTS approach and the targeted fusion panels. Of note, even if all thresholds were disregarded, 352 of the 357 samples (98.6%) were still identified correctly. Sixty-nine out of 74 fusions were called correctly (93.2%) when compared with the results obtained from the targeted fusion panel. All of the five samples with false negative results had a TCC of 30% or 20%, falling below the defined threshold of 40% (Fig. 4c). The further QC metrics of RNA input amount, unique reads and insert sizes (Fig. 4c-f) did not reveal any further need for adjustments of these parameters and were in agreement with the QC data from the EC (Fig. 2c-f).
WTS did not identify additional fusions beyond those already identified by targeted panel sequencing for the validated gene-set (Supplementary Table 1).
WTS in clinical practiceFollowing the successful validation process, the application of WTS for diagnostic gene fusion detection was initiated. During the period spanning from July 2024 until March 2025, a total of 812 clinical samples, which met our QC parameter, were subjected to sequencing and analysis for fusion detection through the utilization of WTS. Specimen type was available for 339 samples, consisting of 193 biopsies (56.9%) and 146 resections (43.1%).
The 812 clinical WTS samples included a diverse range of tumor types (Fig. 5a). NSCLC was the most prevalent cancer type with 391 samples (48.2%), followed by CUP (n = 144; 17.7%). We detected 121 fusions with a diverse range of fusion with ALK and ERG being the two most frequently detected fusion partners (Fig. 5b). Turnaround times for WTS and targeted approaches were comparable.
Fig. 5: Overview of the clinical WTS cohort after adaptation in diagnostics.
a Bar chart representing the cancer type frequencies analyzed (n = 812). b Bar chart representation of validated fusions (n = 121).
In the same time span, 423 of the 1235 diagnostic samples (34.3%¸78% NSCLC (n = 330) had to be analyzed with one of the targeted panels as they did not meet our QC parameters.
Leveraging WTS data beyond fusions and splice variant callingThe use of WTS in diagnostics can provide additional potential valuable information for the patient.
To further improve molecular profiling, an expanded gene list (Supplementary Table 3), comprising regulatory genes, oncogenes, and tumor suppressor genes, was employed to detect fusion transcripts beyond the scope of targeted approaches. A stricter threshold of 10 reads was applied to identify the most frequently altered transcripts for the whole WTS cohort.
Among these, MALAT1 was the most prevalent (n = 11), followed by PTEN (n = 9), and SFPQ and CDK12 (both n = 6) (Fig. 6a). These findings reveal further alterations that could be clinically relevant, such as the loss of the tumor suppressor PTEN due to truncation of the transcript after exon 2 in a case of a pulmonary adenocarcinoma (Supplementary Fig. 2). This variant resembles the effect of a deleterious PTEN mutation, causing a loss of function. This loss of the negative regulator of the PI3K/AKT signaling pathway can act oncogenic and argues for the discussion of a potential treatment with AKT inhibitors, such as Capivasertib. Which is approved, in combination with Fulvestrant, for the treatment of adult patients with oestrogen receptor (ER)-positive, HER2-negative, locally advanced or metastatic breast cancer with one or more PIK3CA/AKT1/PTEN alterations, following recurrence or progression of the disease during or after endocrine therapy.
Fig. 6: Further applications of WTS in the diagnostic setup.
The Pie Chart in a shows the most frequent additionally found translocations (n = 174) in all WTS samples (n = 1233) not covered in the targeted panels with at least 10 reads. Genes found less than 4 times are grouped in ”other”. Two exemplary samples of metagenomic analysis are shown in (b) for HPV including Immunohistochemical stain of p16-positive squamous cell carcinoma(tonsil) and (c) for EBV including EBV in-situ hybridization of EBV-associated nasopharyngeal carcinoma (nonkeratinizing squamous cell carcinoma). d Composite heat map integrating Gene Set Enrichment Analysis (GSEA) and gene expression profiles of 12 ALK fusion-positive samples. Samples are annotated by fusion partner (EML4::ALK or LCLAT1::ALK) and associated domain signatures (retained [+] or lost [−] protein domains). The left panel (GSEA Association Analysis) shows normalized enrichment scores (NES) for pathways significantly enriched (padj ≤ 0.05) across samples. For each sample, the top 10 pathways by NES were selected, and their union was used for visualization. Pathway enrichment is color-coded from purple (suppressed activity) to red (increased activity), with black denoting non-significant results (NS). The right panel (“Gene Expression Analysis”) displays variance-stabilized, z-score normalized expression of the 2000 most variable genes across the samples. Matching row annotations highlight the relationship between expression profiles, pathway activation, and fusion-specific domain alterations.
As a second representative case, an adenoid cystic carcinoma with a MYB::NFIB gene fusion is presented (Supplementary Fig. 1). While MYB::NFIB fusions are a key molecular hallmark of adenoid cystic carcinoma, the structure of this specific fusion is remarkable, as a 1.3 kb intergenic insert was detected, connecting the two partners in this bridged fusion. It is evident that the canonical splicing donor site referring to exon 9 (NM_005375.4) is not utilised in the fusion transcript. However, transcription persists for a region of over 450 bp within intron 9, extending over the potential breakpoint (Chr9:135518908), into an intergenic region (Chr9:15337270-15338597), where de novo splice sites are employed. A similar event can be observed for the second potential breakpoint, leading back to NFIB (Chr9:14088338) shortly before the canonical splice acceptor site of exon 11 (NM_001190737.2), where no splicing can be seen (Supplementary Fig. 3). The intersection and the altered splicing events can complicate the detection of the fusion with a targeted approach based on amplicon, single primer detection, or hybrid capture enrichment strategies, making it difficult or even impossible to detect. WTS using rRNA depletion allows the investigation of the transcriptome for the presence of non-human transcripts, for example, from pathogens. Figure 6b, c display two representative results. In the first case a squamous carcinoma of the tonsil, which was p16-positive by immunohistochemistry, 2485 reads for human papillomavirus 16 could be identified (Fig. 6b). In another case 35190 reads from human gamma herpesvirus 4 (EBV) were detected, in line with the pathological report of an EBV associated non-keratinizing nasopharyngeal carcinoma, positive for Epstein-Barr encoding region detected by in situ hybridization (Fig. 6c).
Furthermore, the human transcripts of the WTS data inherently encompass additional information beyond the mere gene fusion status, which can be utilized for further analysis. To explore the functional impact of ALK fusion events at both the signaling and transcriptional levels, we conducted an integrative analysis combining protein domain composition signatures with gene expression data from 12 ALK fusion-positive samples (Fig. 6d). Hierarchical clustering of gene expression patterns (right panel) revealed distinct gene expression profiles. Furthermore, we identified frequently enriched pathways (padj ≤ 0.05) associated with receptor tyrosine kinase (RTK) signaling and the downstream RAS-MAPK and PI3K cascades, highlighting their central role in ALK-driven oncogenic processes (Fig. 6d).
Comments (0)