4.1 Interpretation of Results
The present CEA demonstrated that, compared with the other biologic agents currently available, etrasimod is a cost-effective or dominant alternative for AT-naïve and AT-experienced patients aged 16 years and older with moderately-to-severely active UC in Spain.
The ELEVATE UC 52 trial already proved that etrasimod, compared with placebo, represents an effective and safe alternative for patients with moderately-to-severely active UC (clinical remission at weeks 12 [27% vs 7%; p < 0.0001] and 52 [32% vs 7%; p < 0.0001]) [16], which led to its approval by several regulatory agencies [17,18,19,20]. Moreover, according to the Bayesian NMA considered in this CEA, the efficacy of etrasimod compared with other ATs in naïve patients with UC, in terms of clinical remission and clinical response, was found to be similar to most comparators both in induction and maintenance phase [40, 41]. The results of this Bayesian NMA were consistent with other published ITC [78]. In this context, assessing the cost effectiveness of etrasimod in moderately-to-severely active UC is key to informing the decision making of both physicians and healthcare institutions.
Based on the decision analytic model, an AT-naïve patient would live 19.51 QALYs and accrue a total direct cost during their lifetime of €600,289. In this population, etrasimod represented the best alternative in terms of health outcomes (QALYs), followed by infliximab (19.47) and adalimumab (19.46). Likewise, the total cost associated with etrasimod was the lowest, followed by vedolizumab (IV) (€616,442) and adalimumab (€635,372). The main drivers of health outcomes associated with the alternatives assessed included their efficacy, speed with which they produce their therapeutic effect, loss of response, and safety. In addition, the profile of adverse events represented a key driver of costs.
Regarding AT-experienced patients, etrasimod was associated with 18.41 QALYs and €589,423 during a lifetime. According to the health outcomes (QALYs), etrasimod was ranked first followed by adalimumab (18.39) and ustekinumab (18.39). In economic terms, etrasimod also produced the lowest direct total cost during the patient’s lifetime (€589,423), followed by vedolizumab (IV) (€589,995) and adalimumab (€610,273).
According to the findings of this CEA, etrasimod would improve patients’ lives, ensuring the sustainability of the Spanish healthcare system due to the potential reduction in total costs. In this context, further budget impact analyses would be key to informing the magnitude of these cost savings in a real-world setting, which is beyond the purpose of the present study.
However, the slight differences in terms of efficacy should be examined to ensure a proper interpretation of the CEA [40, 41]. Additionally, the dominance of etrasimod against biologics was consistent across the analyses conducted. In this setting, no priority groups to be treated with etrasimod were detected in sensitivity analyses, including previous treatment (AT-naïve or AT-experienced), sex or age groups. These findings were consistent with previous studies revealing that both the safety and efficacy of etrasimod was consistent regardless of the patient’s age [79].
Within this context, differences at the regional level and between patients become increasingly important, highlighting the need for a personalized medicine which relies on clinical findings and economic evidence, as well as considering the patient’s characteristics and preferences for treatment selection in clinical practice. Given the deterministic design of the analytic decision model, it was not feasible to capture the heterogeneity caused by regional or patient-related features. Thus, the findings of this CEA should be interpreted within the Spanish setting and extrapolation to other countries should be made with caution. Moreover, remission and response rates are not unique drivers of the results. In contrast, the dominance of etrasimod versus biologics is caused by the convergence of various clinical parameters of the model (remission and response rates, loss of response, safety, etc.), utility values and costs.
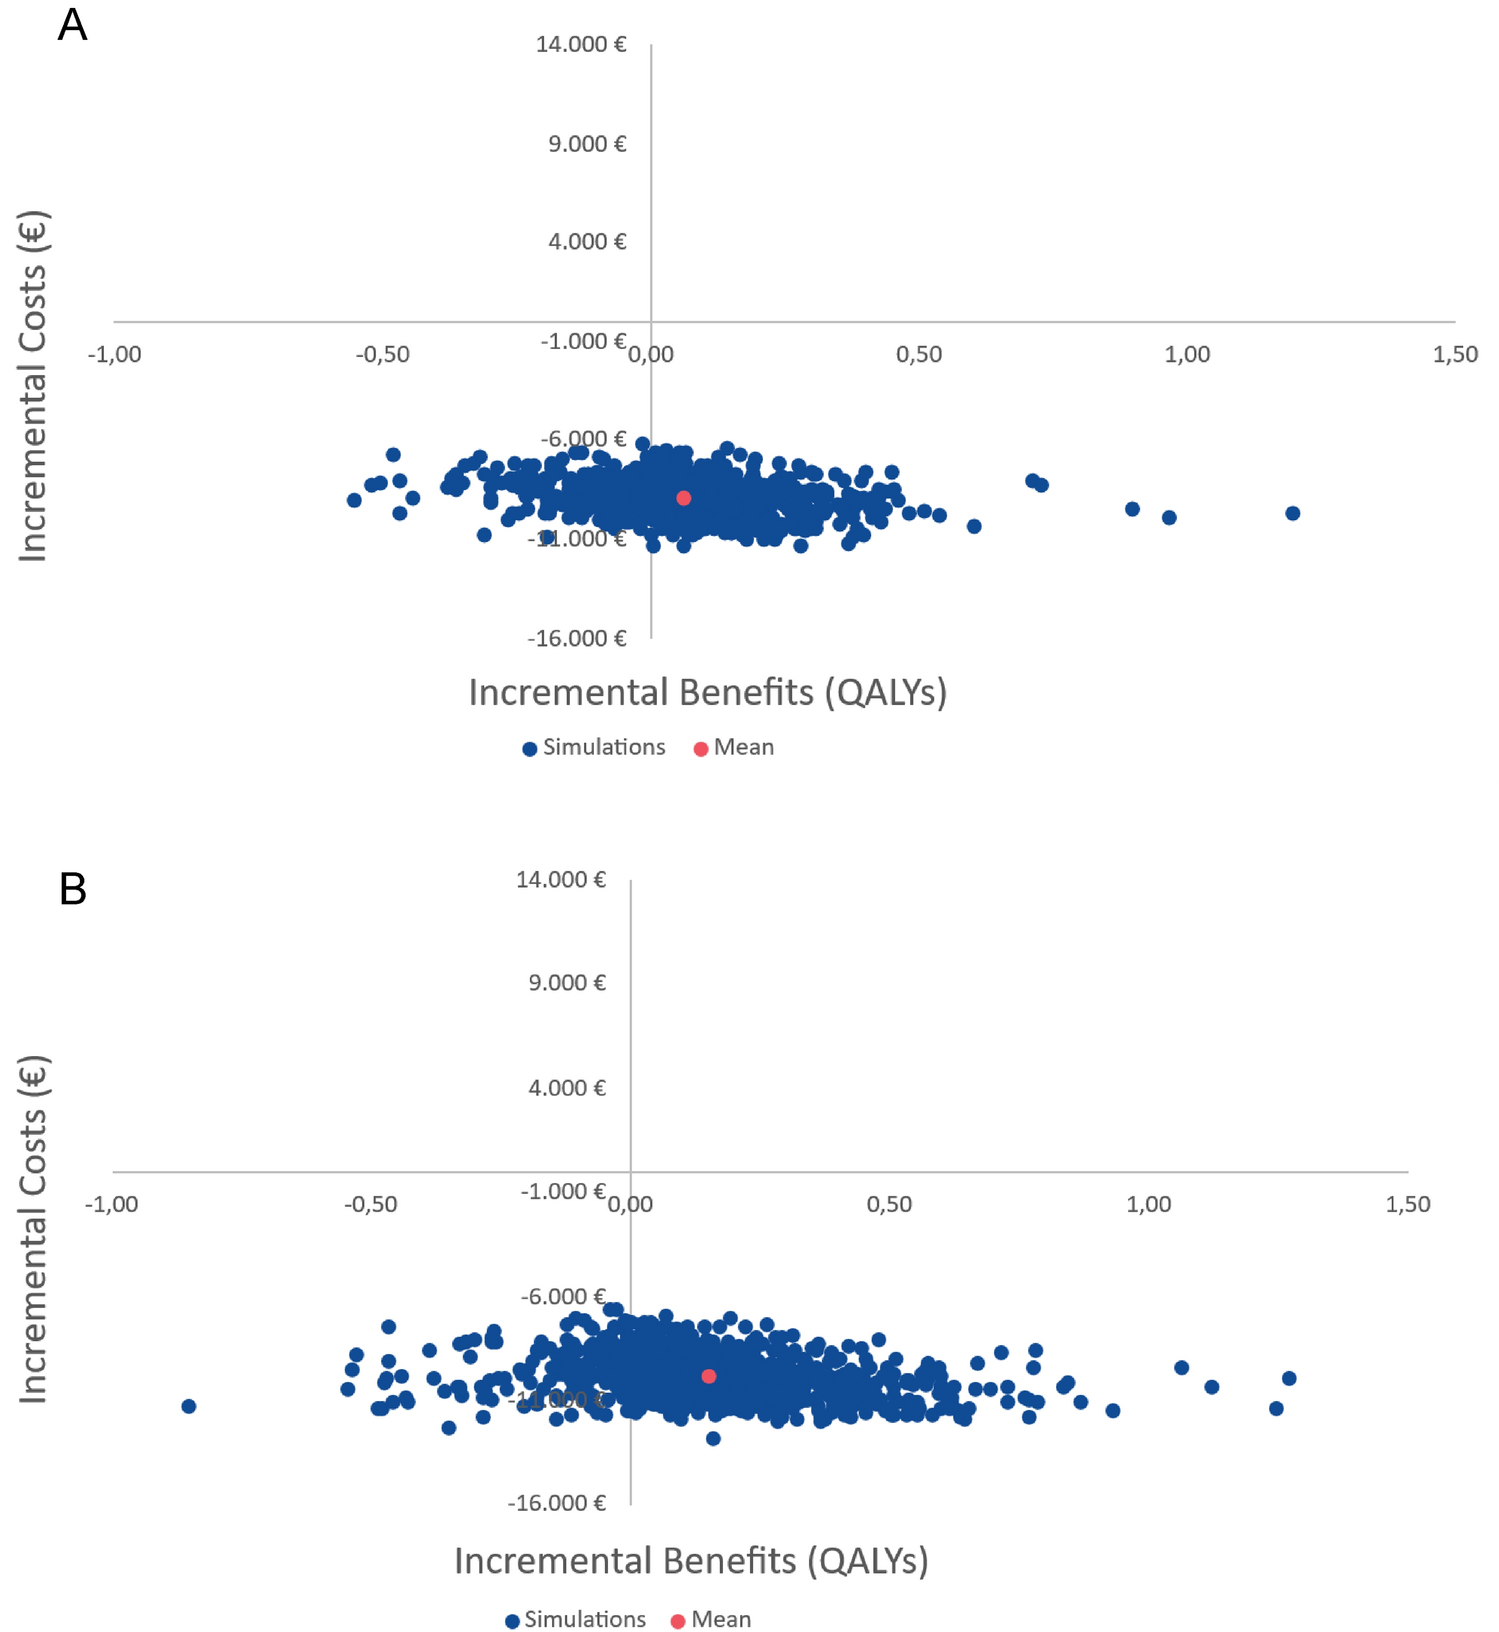
For these reasons, sensitivity analyses are key to testing the robustness of the results, which remained consistent in most OWSAs. Moreover, it is noteworthy that the discount rate, time horizon, costs and utility values did not produce remarkable variations in the CEA estimates. Concerning the PSA, the average estimates of the 1000 Monte Carlo simulations revealed that etrasimod remained dominant in all the pairwise comparisons versus the other biologic therapies. When considering a WTP threshold reflecting the dominancy of etrasimod (€0/QALY), the probability of etrasimod being cost effective (dominant) was over 84% compared with all other comparators. This probability reached 99.9% when comparing etrasimod with infliximab or ustekinumab. The sensitivity analyses demonstrated the robustness of the result and identified that data on efficacy and safety represented the most sensitive parameters.
Regarding efficacy, it was expected that modifying all parameters affecting the response and remission rates of etrasimod or its comparators would be highly sensitive. The Bayesian NMA from which these data were sourced found similar efficacy between all the therapies [40, 41], except for some pairwise comparisons in terms of clinical remission and response during the induction phase in AT-naïve patients, which revealed that etrasimod was significantly more effective than adalimumab administered in standard (RR for remission = 2.05 [95% CI 1.28–3.44]; RR for response = 1.43 [95% CI 1.13–1.89]) and intensified dose (RR for remission = 1.50 [95% CI 1.09–2.01; RR for response = 1.22 [95% CI 1.04–1.40]) [40, 41]. No statistical differences were found in terms of clinical response and remission when comparing the performance of etrasimod and biologic therapies during the maintenance phase [40, 41].
Given these similar remission and response rates [40, 41], several OWSAs were included by considering the lower and upper limits of the 95% CIs estimated by the NMA to test this source of uncertainty. Considering the induction phase in AT-naïve patients, the base-case NMA estimated an RR of response and remission versus placebo of 1.65 and 2.65, respectively. In this population, when considering the upper limit of the 95% CIs, the RR ranged from 1.70 (golimumab) to 1.91 (infliximab) for response, and between 2.59 (vedolizumab) and 3.66 (infliximab) for remission, both considering the induction phase. These trends in efficacy were observed for all comparators in both induction and maintenance phases, considering AT-naïve and experienced patients, except for adalimumab, which remained less effective than etrasimod in all OWSAs. Even when the comparators represented more effective alternatives compared with etrasimod in most OWSAs, etrasimod was cost effective in all these sensitivity analyses (Figs. S1–S6 in the ESM). Additionally, the tornado graphs provided as supplementary material revealed that when varying the efficacy inputs, the incremental net monetary benefit (INMB) remained positive in most cases, suggesting that etrasimod would still be a cost-effective alternative against the comparator.
The efficacy inputs considered in the CEA were consistent with a different NMA evaluating the efficacy and safety of several alternatives for UC during the maintenance phase [78]. In this ITC, the alternatives were split depending on whether those patients achieving response were re-randomized after the induction phase, or were kept in the same treatment group after induction regardless of response to induction therapy (treat-through). Etrasimod was included in the treat-through analysis, and was compared against adalimumab, vedolizumab, etrolizumab (currently not approved for UC) and infliximab. Etrasimod was ranked the best in those studies using a treat-through design according to its efficacy during the maintenance phase (surface under the cumulative ranking area [SUCRA] = 91.1%), and was found to be significantly more effective for achieving remission than adalimumab in standard dose (odds ratio [OR] 2.49 [95% CI 1.01–6.14]), etrolizumab (OR 3.06 [95% CI 1.09–8.56]) and placebo (OR 6.62 [95% CI 3.13–14.02]). No differences were found when comparing etrasimod with vedolizumab and different regimens of infliximab [78]. It should be noted that if the results of this NMA had been used as a source of efficacy [78], etrasimod would have achieved better results. Therefore, the base case can be considered as a conservative scenario.
Due to the similar efficacy of the alternatives, data regarding their safety could be a key driver for decision making. In relation to the approach for modeling adverse events, the model was constrained to consider serious infections exclusively [19], mainly because of the lack of comparative safety between etrasimod and biologic therapies. This design was aligned with previous assessments by NICE in the United Kingdom [52, 53] and, as observed in the base case and OWSAs, the impact on the results was low. Nonetheless, further studies will be needed to assess differences in these aspects.
Given that all the therapeutic alternatives considered in the CEA were associated with similar results in terms of survival (LYG), mainly because UC is not a lethal disease, the utility values represented additional key model inputs. Nonetheless, etrasimod remained dominant in all OWSAs varying utilities, considering all pairwise comparisons and both AT-naïve and AT-experienced cohorts. In addition, it could be argued that utility values for active UC (0.780), response without remission (0.820) and remission (0.890), derived from the ELEVATE UC 52 trial could be slightly favorable for etrasimod. In this regard, other sources can be considered for estimating QALYs ranging from 0.410 to 0.660 in active UC [80,81,82], 0.760–0.800 in response without remission [80,81,82], and 0.860–0.910 in remission [80,81,82]. All these sources were proposed to the experts, who agreed on using those values derived from ELEVATE UC 52 as being the most recent source. Moreover, the utility values provided by alternative sources presented wide differences between the states of active UC and remission (0.200–0.460) [80,81,82], active UC and response without remission (0.110–0.350) [80,81,82], and remission and response without remission (0.090–0.110) [80,81,82]. These remarkable differences between health state-specific utility values would lead to better outcomes associated with etrasimod.
4.2 Additional Implications for Clinical Practice
In addition to improving the patients’ HRQoL, other unmet needs for those patients with UC that belong to specific subgroups should be considered. This is the case for patients with isolated proctitis, which is associated with extended affectation of the UC and produces a remarkable impact on HRQoL [83, 84]. In contrast to other clinical trials in UC excluding these patients with isolated proctitis, the ELEVATE UC clinical program considered this subgroup [85]. A total of 64 participants with isolated proctitis were enrolled, of whom 42 received etrasimod. At week 12, more patients with isolated proctitis achieved clinical remission (43% vs 14%), endoscopic improvement (52% vs 23%), symptomatic remission (52% vs 23%), endoscopic improvement—histological remission (EIHR) (38% vs 14%) and clinical response (71% vs 41%) with etrasimod compared with placebo, all results being statistically significant (p < 0.05) [83, 85]. The efficacy of etrasimod in this patient subgroup remained at week 56, in terms of clinical (44% vs 11%) and symptomatic (56% vs 11%) remissions [83, 85].
Other advantages of etrasimod compared with biologics should be considered. First, the daily 2-mg oral administration could represent a convenient posology compared with the IV or SC administrations for some patients, as it avoids needlesticks and hospital visits. The IV drug administration incurred additional out-of-pocket costs for patients, which produced a remarkable impact associated with the route of administration from a societal perspective. In this CEA, the perspective of the Spanish NHS was chosen to align with national recommendations [23], and because indirect costs could be a significant source of uncertainty.
In addition to its oral route of administration, etrasimod is associated with a fixed dose for the entirety the treatment. In contrast, biologic treatments require dose intensification in some patients. In comparison with the biologics in which dose regimens are susceptible to increase during treatment, the fixed dose of etrasimod led to a predictable economic impact per treated patient. However, future research could test the actual impact of the convenience of etrasimod’s posology, based on patient preferences.
4.3 Comparison with Other Cost-Effectiveness Analyses
To the best of our knowledge, this is the first manuscript describing a CEA evaluating etrasimod in UC. Nonetheless, previous studies have already assessed the cost effectiveness of ATs in moderately-to-severely active UC at a national level [70, 86, 87]. Among those, the first CEA was conducted by developing a Markov model which simulated the progression of patients with UC, treated with infliximab, adalimumab, golimumab or vedolizumab, for a 10-year time horizon [70]. The model estimated total costs ranging from €62,767 (adalimumab) to €146,985 (vedolizumab) (€, 2017), and the QALYs associated with each intervention ranged between 5.070 (adalimumab) and 6.000 (vedolizumab). Compared with adalimumab, none of the biologics were cost effective at the WTP of €30,000/QALY considered by the authors (ICERs = €45,582 [vs infliximab] to €2,175,999 [vs golimumab]) [70].
In 2020, the authors of the previous CEA updated the analysis and included tofacitinib as a new comparator [86]. The estimated costs during the 10-year period were €66,030 for golimumab, €72,671 for adalimumab, €91,604 for infliximab, €134,073 for tofacitinib and €147,642 for vedolizumab (€, 2018). Moreover, these ATs were associated with a QALY gain ranging from 5.46 (golimumab) to 6.74 (vedolizumab). None of these alternatives were cost effective versus infliximab (ICERs = €31,340 [golimumab] to €270,503 [vedolizumab]) [86].
The most recent CEA compared tofacitinib with vedolizumab via a Markov model, considering two different cohorts of AT-naïve and AT-experienced patients [87]. During the patients’ lifetime, tofacitinib produced costs of €181,584 (AT-naïve) and €160,907 (AT-experienced), which were associated with cost savings in both cohorts compared with vedolizumab (AT-naïve: €205,400; AT-experienced: €172,345) (€, 2019). Compared with the biologic, tofacitinib represented a dominant alternative that yielded 0.00014 and 0.042 additional QALYs in AT-naïve and AT-experienced patients, respectively [87].
Although comparison of the results between the present CEA and those previously published studies should be made with caution, some similar trends can be observed. First, adalimumab and infliximab were found to be the biologics associated with the lowest costs [70, 86]. In contrast, vedolizumab produced the greatest costs [70, 86]. Second, small molecules could be an efficient alternative when compared with vedolizumab [87]. Third, modeling AT-naïve patients separately from those previously treated with ATs is important, as their results present important differences in terms of costs and health outcomes [87]. Finally, the effectiveness of the ATs in UC is similar, producing slight differences in terms of quality of life (incremental QALYs), but their impact on survival is minimal due to the low mortality of the disease [70, 86, 87].
4.4 Strengths and Limitations
This CEA is not exempt from some limitations but is also linked to strengths that need to be critically addressed. The use of efficacy and safety data estimated by an NMA could be considered the main constraint of the analysis. However, it should be noted that there are limited head-to-head comparisons between the targeted alternatives. Given the lack of direct comparisons, ITCs are considered an acceptable source of evidence [88, 89]. Moreover, Bayesian NMAs represent updated and evolved methods for conducting these ITCs [88, 89]. In contrast to frequentist NMAs, the Bayesian models can account for the uncertainty inherent to health-related data [88, 89]. In any case, further research would be needed to assess these gaps.
The present CEA used notified ex-factory prices [60], applying the mandatory deduction when applicable [61]. However, in the Spanish setting the pharmaceutical companies, health institutions and hospitals agree on discounts on the notified prices of the commercialized medicines. Thus, the prices considered in this CEA may not present a faithful reflection of the real-world costs. Given that these discounts are not publicly available, the approach considered in the present CEA represented the most adequate method to estimate pharmaceutical costs, and additionally, the lowest published price was selected when biosimilars are available. Nonetheless, the potential impact of this issue could be considered low as the discounts mentioned are applied to both etrasimod and its comparators. In addition, those sensitivity analyses conducted by applying a 50% discount to the prices of adalimumab and infliximab both revealed that etrasimod would still be a dominant alternative compared with all biologics. In this context, the extended use of biosimilars of ustekinumab in the next few years could modify the results obtained.
The population baseline characteristics were derived from the ELEVATE UC 52 trial [

Comments (0)