
Remember me
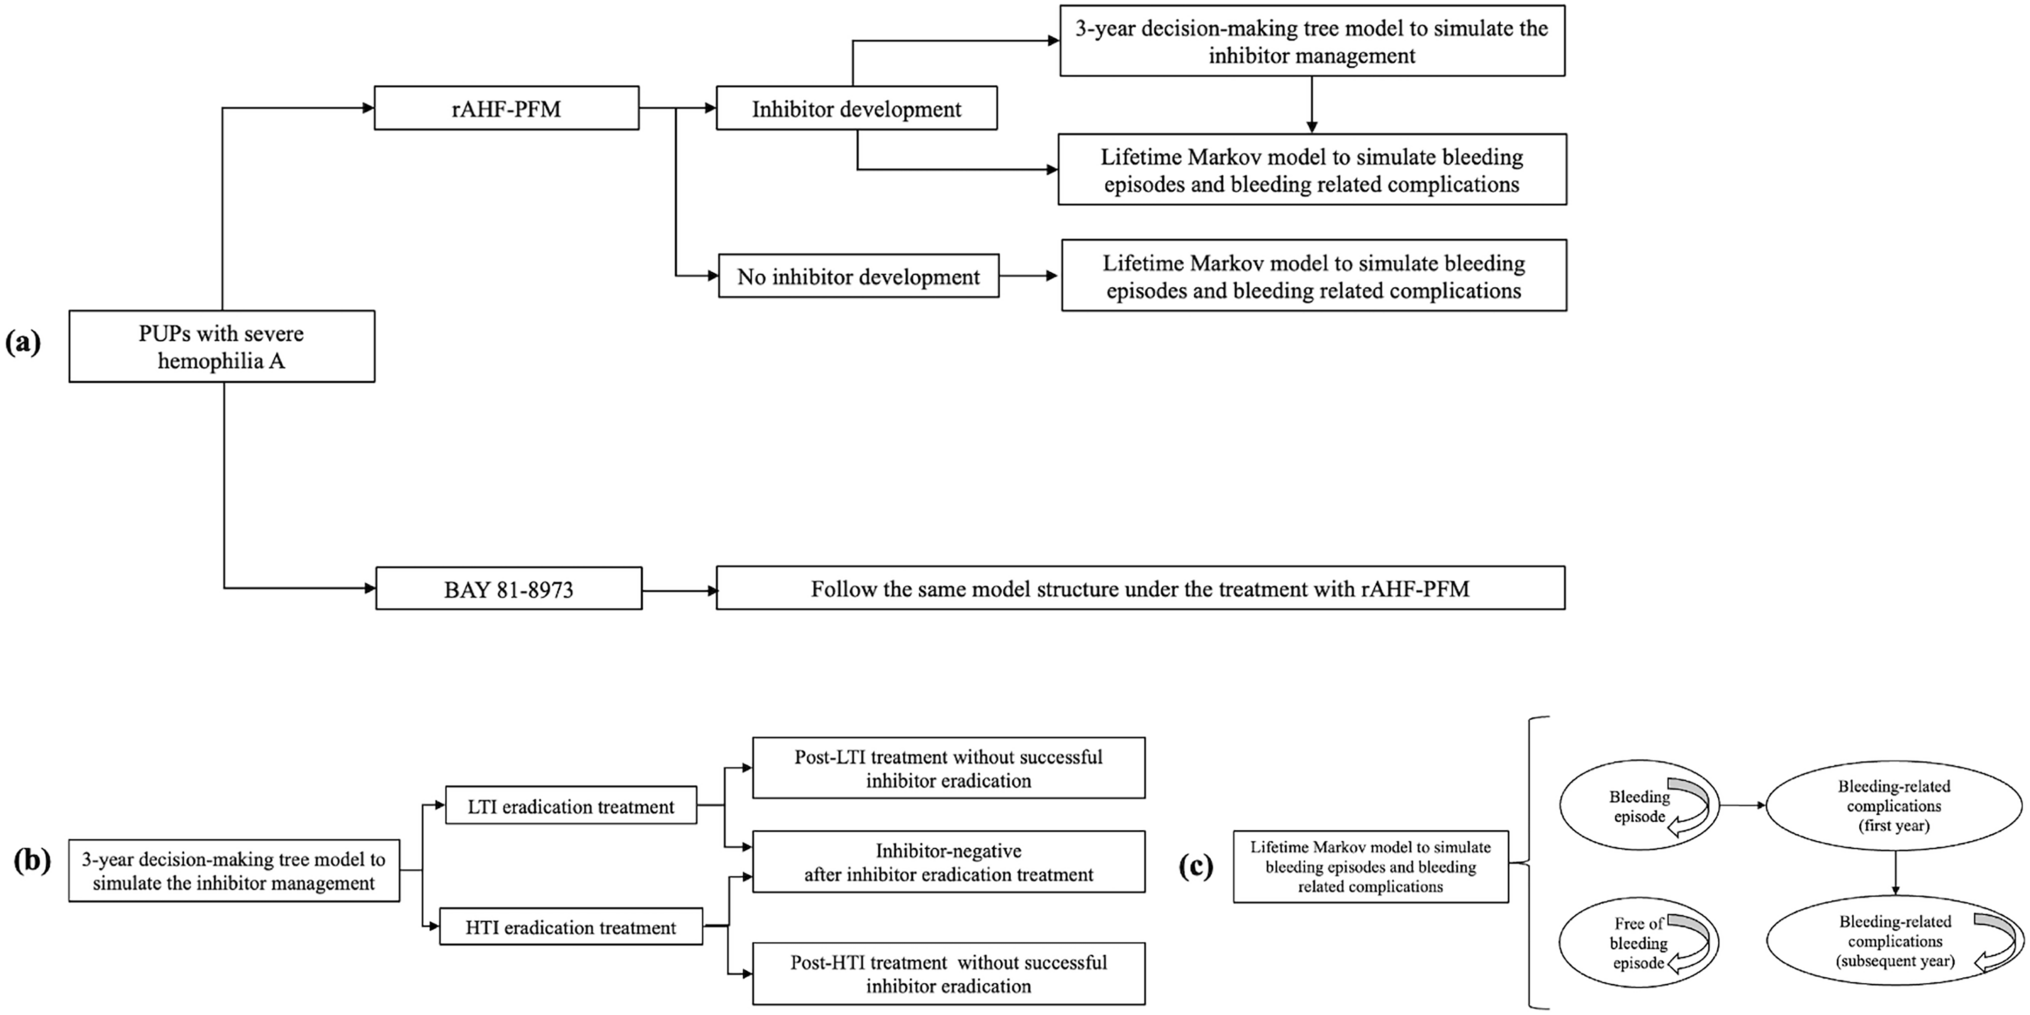
A previously developed hybrid cohort-level model was adapted to assess the impact of varying future trends in cancer management and screening costs on the financial impact of MCED testing [46, 49]. This model compares the economic and clinical outcomes of annual MCED testing in addition to usual care screening versus usual care screening alone for detecting 19 solid cancers (see the electronic supplementary material, Supplementary Table 1, for included cancer types) over a lifetime horizon in a US adult cohort. It comprises two main components: (1) a state-transition (Markov) model that simulates the number of cancer cases diagnosed in the cohort over their lifetimes, and (2) a decision-tree model that estimates the clinical and economic outcomes of newly diagnosed cancers (Fig. 1).
Fig. 1
Model flow diagram. MCED multi-cancer early detection
The model estimated cancer diagnoses in the usual-care arm using age- and stage-specific incidence rates for each cancer type. MCED testing has the potential to detect and diagnose cancers at an earlier stage compared to usual care. To represent this effect, the model includes stage and time shifts for each patient diagnosed through MCED testing. These shifts were derived from a previously published interception model, accounting for factors like testing frequency, sensitivity, and cancer progression rates [42]. The probability of stage shifting depends on the sensitivity of the MCED test for each cancer type and stage as well as the probability that a cancer will be detected earlier based on when the patient is screened. Additionally, the likelihood of detecting a cancer at an earlier stage is impacted by its natural progression rate. For patients diagnosed with cancer in each cycle, the model estimates their remaining life expectancy, management (treatment and workup) costs, screening costs, and accumulated quality-adjusted life years (QALYs) based on their age at diagnosis, cancer type, and stage. To inform the intended analyses in this study, distinct annual growth rates for cancer management and screening costs were applied throughout the model time horizon, assuming compound annual growth.
The model also accounts for possible overdiagnosis and misdiagnosis due to MCED testing, including the occurrence of false positives. The overdiagnosis is quantified so 5% of patients who died of non-cancer mortality are assumed to have undiagnosed cancer at death based on reported prevalence of cancer not associated with mortality in autopsy studies. These patients could have cancers stage and time shifted by MCED testing such that their cancers may be diagnosed but will not impact the time of mortality. The associated work-up costs and the negative impact on quality of life from unnecessary procedures for false positives and cancers with inaccurate signal origin are factored into the analysis.
2.2 Key Model Inputs2.2.1 Clinical InputsThe diagnosis of cancer based on usual care screening alone was determined using age- and stage-specific cancer rates obtained from the Surveillance, Epidemiology, and End Results (SEER) program [50, 51]. The mortality rates for individuals without cancer were derived from the 2018 US period life tables, with life expectancy inputs weighted based on the sex distribution in the modeled cohort [52]. Stage-specific survival data were obtained from the SEER Medicare database to estimate the average survival of individuals diagnosed with cancer, by age, cancer type, and stage [50].
MCED test performance was informed by a prior case-control study, which used an independent validation set that included 2823 cancer cases across more than 50 cancer types and 1254 non-cancer controls aged ≥ 50 years [35]. The study reported a single false-positive rate of 0.5%, with sensitivity varying by cancer type and stage—for instance, lung cancer sensitivities were 22%, 80%, 91%, and 95% for stages I through IV, respectively, and ovarian cancer sensitivities were 50%, 80%, 87%, and 95% for the same stages (see the electronic supplementary material, Supplementary Table 1, for sensitivity of MCED for other cancers).
2.2.2 Economic InputsThe stage-specific treatment costs were determined from the analysis of 2012–2016 data from a retrospective SEER-Medicare database, and these Medicare costs were adjusted by a cost multiplier of 2.34 to estimate commercial costs [53, 54]. Total, inpatient, outpatient, and pharmacy cancer-related service costs were accounted for in the estimated annual costs in the 5 years following a cancer diagnosis. All costs were inflated to 2023 US dollars using the US Bureau of Economic Analysis price index for personal consumer expenditures for healthcare. Table 1 presents the estimated treatment costs for five cancer types with relatively higher mortality rates from a commercial perspective. For the remaining cancers explored in this study, cost data are provided in the Supplementary Table 2 (see the electronic supplementary material). Utilities and costs were applied at the time of diagnosis and accrued continuously for a period of up to 5 years [46].
Table 1 Commercial payer cancer treatment costs by stage and years from diagnosis for select cancersFull details of the clinical and economic inputs used in this analysis are documented in previously published cost-effectiveness studies, which serve as the primary source for input parameters [46, 49].
2.3 Cost-Effectiveness and Net Cost ModelsThis study utilized two distinct analyses to assess the impact of differential future cost trends in cancer screening and management on MCED testing in the US general population: (1) cost-effectiveness analyses using the incremental cost-effectiveness ratio (ICER) and (2) net cost analyses focusing on the cumulative incremental costs associated with MCED testing over time. In both analyses, the initial MCED test costs of $949 (reflecting the current commercial list price for the Galleri® test) and $712 (25% lower) were tested. The 25% reduction represents a plausible, market-driven scenario reflecting potential near- and medium-term pricing dynamics. A range of fixed annual growth rates were then applied separately to screening costs (both MCED tests and usual care screenings) and management costs (cancer treatments and diagnostic workups, including those for false positives) to model slower, long-term pricing dynamics. The growth rate was adjusted in 1% increments within a range of −5% to 10% for each cost category, and the outcomes for all possible combinations were evaluated. In addition to the base case (combination A, with no growth), three benchmark scenarios based on historical trends were explored: combination B assumed a 3% annual increase in cancer management costs (aligned with historical and projected medical CPI [18]); combination D assumed a 5% annual reduction in screening costs, reflecting potential decreases associated with increased adoption and economies of scale, particularly in sequencing-based technologies; and combination C combined both assumptions—a 3% increase in management costs and a 5% decrease in screening costs.
2.3.1 Cost-Effectiveness AnalysesThe impact of differential future cost trends on the cost-effectiveness of MCED testing in addition to usual care screening versus usual care screening alone was evaluated over lifetime from both the commercial and Medicare perspectives. Distinct annual growth rates for cancer management and screening costs were applied throughout the model time horizon. Both cost and health outcomes were discounted at a rate of 3% in this analysis, consistent with the Second US Panel on Cost‐effectiveness in Health and Medicine recommendation [55]. The results were illustrated using contour plots for different scenarios. The commercial and Medicare cohorts of the general population entered the model at age 50 and 65, respectively, and received annual MCED testing until age 79, consistent with age ranges evaluated in MCED clinical studies.
2.3.2 Net Cost AnalysesThe net cost analyses tracked the total cumulative incremental costs of MCED testing in addition to usual care screening versus usual care screening alone for all cost growth rate combinations over a 30-year time horizon. The added cost of MCED and follow-up diagnostic testing and the associated changes in cancer management costs, due to savings from shifts in cancer detection time and stage, impacted the overall cumulative incremental costs over time. These costs were computed at 5-year intervals from the start of MCED screening (0–5, 5–10, and so on, up to 30 years). “Cost neutrality” was attained when the reduction in cancer treatment costs in a 5-year interval exceeded the added cost of MCED screening in that interval.
For the net cost analyses, the MCED screening population was broken into six separate 5-year age intervals (50–54, 55–59, 60–64, 65–69, 70–74, 75–79). Each cohort was analyzed separately over lifetime and then aggregated according to the US population distribution by age group [56]. The aggregated results were used to estimate the overall timing of cost neutrality after the start of screening. For the first three age intervals, commercial cancer treatment costs were applied, transitioning to Medicare costs starting at age 65. In the net cost analyses, cost outcomes were not discounted, to ensure a straightforward assessment of total budgetary impact, as the focus was on financial flows rather than evaluating overall value or efficiency, where discounting would be appropriate. The intervals at which cost neutrality was attained for all possible combinations of cost growth rate scenarios were used to construct cost neutrality regions using contour plots.
2.3.3 Additional Scenario and Sensitivity AnalysisIn the base case, a conservative assumption was made that cancer management costs grow at uniform rates across all stages, although current trends suggest that cost growth in oncology is primarily driven by late-stage innovations. Thus, a scenario analysis was also performed focusing specifically on the treatment costs of stage IV cancer, which are notably more expensive and may be more influenced by the introduction of new treatments. In this scenario, the costs for treating stages I–III cancers and diagnostic workups were held constant. The growth rate for stage IV treatment costs was adjusted in 1% increments within a range of 0% to 10% while screening test costs were adjusted in the range of − 5% to 0%. Note that while the base-case analysis permits the growth rates of screening costs to be higher or lower than management costs, this scenario analysis creates an explicit hierarchy of growth rates with stage IV treatment costs increasing most rapidly, stage I–III treatment costs and all diagnostic workup costs remaining constant, and screening costs remaining constant or decreasing.
The main scenarios explored in this study assumed that the efficacy of the new cancer treatment remains constant over time, but future advanced treatments might offer enhanced efficacy and improved health outcomes. To assess the robustness of our results, sensitivity analyses were performed in which survival benefits were adjusted proportionally to cancer treatment cost growth. Prior research suggests that cancer drug prices may not uniformly align with their value or clinical benefit [9, 57,58,59,60], but this sensitivity analysis assumes future treatments are introduced at a fixed willingness-to-pay (WTP) threshold of $150k per QALY, i.e., that each additional $150k in treatment costs would yield one discounted QALY gain (see the electronic supplementary material for further details).
Comments (0)