
Remember me
The study included 245 healthy participants categorized into three age groups (Table 1): young adults (20–39 years, mean ± SD: 29 ± 5; n = 108 (48.15% males)), middle-aged adults (40–59 years, mean ± SD: 49 ± 6; n = 105 (47.62% male)), and older adults (≥ 60 years, mean ± SD: 65 ± 5; n = 32 (46.88% male)). The mean BMI was 23.85 ± 3.58 for the young group, 27.74 ± 4.31 for the middle-aged group, and 27.06 ± 4.25 for the older adults. The average number of years of education varied across groups, with young adults reporting a mean of 18 years ± 3, middle-aged adults 14 years ± 4, and older adults 13 years ± 4.
BSA and cerebellar vermis aging patterns varied across the three age groups (Table 2). All 245 image analyses have been quality-controlled and approved as Grade A. The BSA increased with chronological aging, with mean values of 29.36 ± 4.99 years in the young group, 47.39 ± 7.18 years in middle-aged adults, and 62.92 ± 6.99 years in older adults. Similarly, cerebellar vermis age estimations showed progressive increases across the subregions. In lobules I–V, the mean age estimates were 30.98 ± 5.70 years, 48.27 ± 7.07 years, and 63.58 ± 5.42 years for the young, middle-aged, and older adults, respectively. For lobules VI–VII, the estimated ages were 31.58 ± 6.34 years, 48.51 ± 7.34 years, and 63.79 ± 5.27 years, while for lobules VIII–X, they were 31.54 ± 6.36 years, 48.91 ± 7.33 years, and 64.07 ± 5.22 years, respectively.
Table 2 Biological age prediction and volume of cerebellar vermis (I–X) (mean ± standard deviation, *p < 0.05)Overall BSA PredictionSummary of ANCOVA findings for brain BSA across subregions of the cerebellar vermis (Table 3). ANCOVA was conducted to investigate the influence of age group (20–39, 40–59, and ≥ 60 years), sex, BMI, years of education, and cerebellar vermis volume on biological age prediction. The model included age and sex as fixed factors, with BMI, years of education, and vermis volume as covariates. Levene's test indicated a violation of the assumption of variance homogeneity (F(5, 239) = 3.617, p = 0.004). Despite this, we proceeded with the analysis, noting that while ANCOVA can show some robustness to violations of this assumption, the results should be interpreted with caution given the unbalanced nature of our age groups (n = 108, n = 105, and n = 32, respectively). The overall model was statistically significant (F(8, 236) = 111.941, p < 0.001), explaining a substantial proportion of the variance in the biological age prediction (R2 = 0.791, adjusted R2 = 0.784). The interaction between age group and sex was marginally significant (F(2, 236) = 3.027, p = 0.050, partial η2 = 0.025). This interaction suggests that the relationship between sex and biological age differs across the age groups. Specifically, in the young adult group, males had a slightly higher predicted biological age than females (mean difference ΔM = 1.28 years). In contrast, this pattern reversed and the magnitude of the difference increased in the middle-aged (ΔM = −1.95 years) and older adult groups (ΔM = −3.30 years), where females had a higher predicted biological age than males. However, the main effect of age group was highly significant (F(2, 236) = 278.132, p < 0.001, partial η2 = 0.702), with post-hoc Bonferroni pairwise comparisons revealing significant mean differences among all age groups (p < 0.001 for all comparisons). Specifically, the 20–39 age group had a significantly lower predicted biological age than the 40–59 and ≥ 60 age groups, and the 40–59 group also had a significantly lower predicted biological age than the ≥ 60 age group. While the main effect of sex approached, but did not reach, conventional statistical significance (F(1, 236) = 3.774, p = 0.053, partial η2 = 0.016), the interaction term suggests the need for caution in interpreting this result. Among the covariates, BMI, years of education, and vermis volume were not significant predictors of biological age (p = 0.153, p = 0.967, and p = 0.142, respectively). The parameter estimates further detail the relationships within the model, showing the specific contributions of each group and interaction effects. The estimated marginal means for each age group, controlling for covariates, were 29.899 for 20–39, 47.086 for 40–59, and 62.382 for ≥ 60.
Table 3 Summary of ANCOVA results for brain biological age estimation across cerebellar vermis subregionsCerebellar Vermis Lobules I–VThe BSA of cerebellar vermis lobules I–V was analyzed using ANCOVA with age group (20–39, 40–59, ≥ 60 years) and sex as fixed factors and BMI, years of education, and vermis volume (lobules I–V) as covariates. The model explained 77.7% of the variance in biological age (adjusted R2 = 0.777, F(8,236) = 107.37, p < 0.001), with age group exhibiting a dominant effect (partial η2 = 0.691, p < 0.001). Pairwise Bonferroni-adjusted comparisons revealed progressive biological aging across cohorts: the ≥ 60 groups showed significantly higher adjusted means (62.73 ± 1.17 years) than the 40–59 (48.09 ± 0.64 years; mean difference = − 14.65, p < 0.001) and 20–39 groups (31.50 ± 0.67 years; mean difference = − 31.23, p < 0.001), while the 40–59 group differed from the 20–39 group (mean difference = − 16.58, p < 0.001). Sex exerted a modest but significant influence (partial η2 = 0.020, p = 0.027), with males exhibiting marginally higher biological age than females. Vermis volume emerged as a protective covariate (B = − 1.75, p = 0.003), indicating that larger volumes predicted younger biological age, whereas BMI and years of education were non-significant (p > 0.36). No significant age group × sex interaction was observed (p = 0.142), suggesting uniform aging trajectories across the sexes. Homogeneity of variance was confirmed (Levene’s F = 1.31, p = 0.26), thus supporting the model assumptions.
Cerebellar Vermis Lobules VI–VIIThe biological age of cerebellar vermis lobules VI–VII was assessed using ANCOVA, with age group (20–39, 40–59, ≥ 60 years) and sex as fixed factors and BMI, years of education, and vermis volume (lobules VI–VII) as covariates. The model accounted for 75.0% of the variance in biological age (adjusted R2 = 0.750, F(8,236) = 92.33, p < 0.001), with age group exhibiting a robust effect (partial η2 = 0.676, p < 0.001). Pairwise Bonferroni-adjusted comparisons revealed significant progressive aging: the ≥ 60 group displayed higher adjusted means (63.36 ± 1.21 years) compared to the 40–59 (48.35 ± 0.68 years; mean difference = − 15.00, p < 0.001) and 20–39 groups (31.94 ± 0.71 years; mean difference = − 31.41, p < 0.001), while the 40–59 group differed from the 20–39 cohort (mean difference = − 16.41, p < 0.001). Vermis volume again emerged as a protective covariate (B = − 3.78, p = 0.004), with larger volumes predicting younger biological ages, whereas BMI and years of education were non-significant (p > 0.22). Sex showed a marginal effect (partial η2 = 0.013, p = 0.074), with males trending toward older biological age. No age group × sex interaction was observed (p = 0.221) and homogeneity of variance was confirmed (Levene’s F = 1.53, p = 0.18).
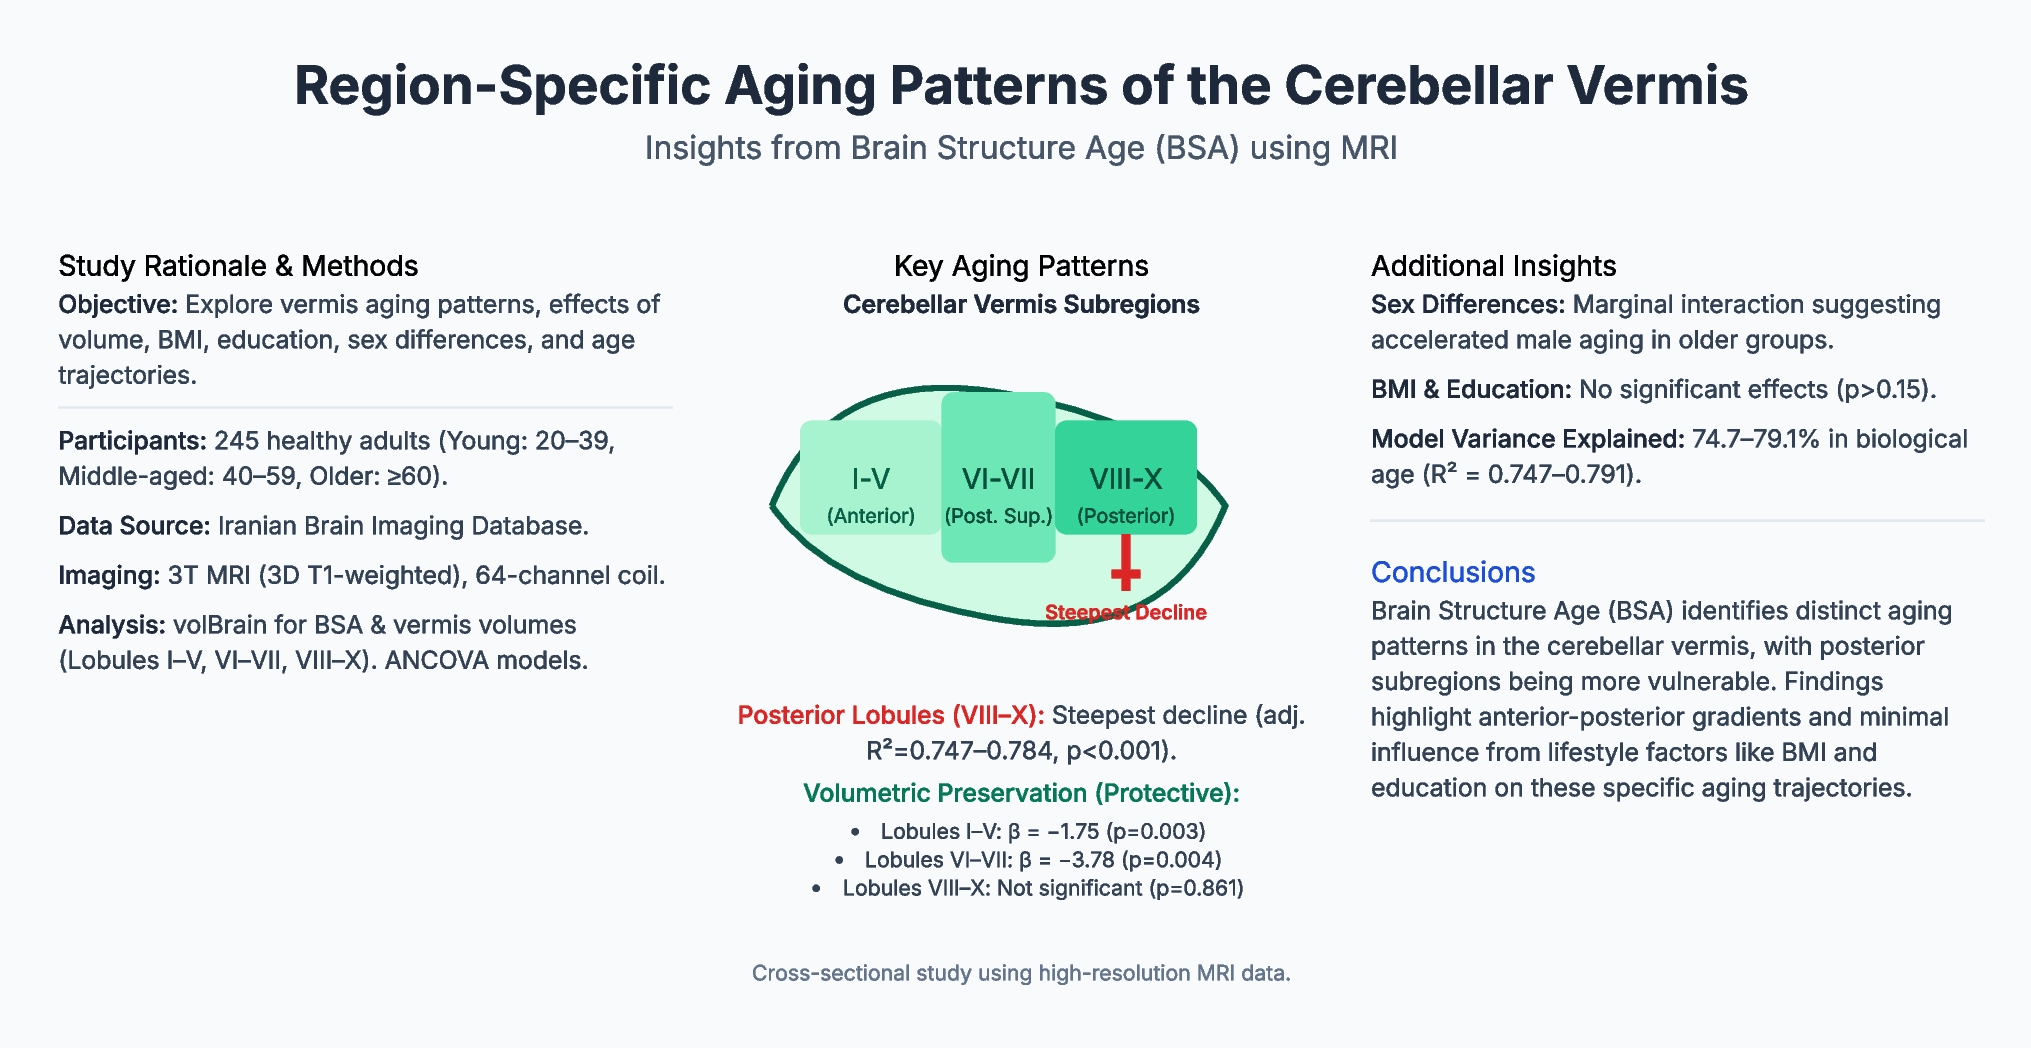
Cerebellar Vermis Lobules VIII–XThe biological age of the cerebellar vermis lobules VIII–X was evaluated using ANCOVA, incorporating age group (20–39, 40–59, ≥ 60 years) and sex as fixed factors, with BMI, years of education, and vermis volume (lobules VIII–X) as covariates. The model explained 74.7% of the variance in biological age (adjusted R2 = 0.747, F(8,236) = 90.86, p < 0.001) (Fig. 2), with age group exerting a dominant effect (partial η2 = 0.685, p < 0.001). Pairwise Bonferroni-adjusted comparisons revealed significant biological aging gradients: the ≥ 60 group exhibited the highest adjusted mean (64.20 ± 1.23 years), surpassing the 40–59 (48.83 ± 0.70 years; mean difference = − 15.37, p < 0.001) and 20–39 cohorts (31.62 ± 0.72 years; mean difference = − 32.57, p < 0.001), while the 40–59 group differed markedly from the 20–39 group (mean difference = − 17.21, p < 0.001). Unlike the findings in vermis lobules I–V and VI–VII, the volume of lobules VIII–X showed no significant association with biological age (B = − 0.20, p = 0.861), BMI (p = 0.199), years of education (p = 0.376), or sex (p = 0.382). Despite violating the homogeneity of variance (Levene’s F = 2.46, p = 0.034), the robust effect size for the age group supports the validity of these trajectories. Parameter estimates highlighted pronounced biological age reductions in younger groups (20–39: β = − 33.11 to − 34.54; 40–59: β = − 17.52 to − 15.72, p < 0.001) relative to the ≥ 60 reference.
Fig. 2
Anatomical localization and subregional parcellation of the cerebellar vermis. The figure illustrates the location of the cerebellum (highlighted in yellow) relative to the whole brain (top left) and within a sagittal MRI scan (top right). The central panel provides a detailed schematic of the unfolded vermis, identifying its constituent lobules (I-X). The inset (bottom right) shows the sagittal view and the three functional subregions used in the analysis: lobules I-V, lobules VI-VII, and the posterior lobules (VIII-IX and X). As highlighted, the analysis revealed that the posterior lobules (VIII-X) showed the steepest age-related decline (adj. R.2 = 0.747–0.784, p < 0.001)
Comments (0)