
Remember me
Participants were recruited from the community and surrounding area through targeted advertisements related to fall detection measures. Those who met the study’s criteria received comprehensive written information about the study as well as a verbal explanation of the testing procedures. The participants were also given the opportunity to clarify the study protocol before providing their informed consent. This study was approved by the Institutional Review Board (approval no. 1653.21) and conducted in accordance with the Declaration of Helsinki.
Following informed consent, health histories were obtained from all participants. Eligibility required: (1) age between 50 and 75 years; (2) persistent LBP for a minimum of three months; (3) absence of significant pathology, such as nerve root compromise, at the time of testing; and (4) no medical or neurological conditions that would impair the ability to stand safely. Control participants met the same inclusion criteria, except that they had no active history of LBP within the past 12 months or any neurological or vestibular disorders. Exclusion criteria encompassed participants with: (1) diagnosed psychological illnesses that might interfere with the study’s protocol, and/or (2) manifest overt neurological signs, such as sensory deficits or motor paralysis.
Standardized questionnaires were used to collect demographic information relevant to the outcome variables. Disability was measured with the Oswestry Disability Index (ODI), a 10-item instrument that evaluates how back or leg problems affect performance of daily activities [23]. Each item is scored on a six-point scale, with higher scores reflecting greater disability. Pain intensity was assessed with the Visual Analogue Scale (VAS), in which participants marked their pain level along a continuous line, yielding continuous and interval-level data [24].
Experimental proceduresParticipants were assigned to the LBP or control group based on self-reported health history and inclusion criteria. Due to the nature of the study design, participants were not blinded to group assignment. However, outcome assessors were blinded to group allocation during data collection and analysis to reduce potential bias.
During testing, participants stood barefoot on a computer-controlled force platform with their feet positioned at a comfortable, shoulder-width distance apart, while their anthropometric data, including height, body mass index (BMI), and date of birth, were separately recorded using the Bertec Balance Advantaget® software. The Bertec software registered the actual platform speed and displacement, aligning closely with the biomechanics of responses to perturbations during standing (Fig. 1). Foot placement was standardized using manual instructions: the medial malleoli were aligned with a horizontal reference line, and lateral positioning corresponded to small, medium, or large vertical markers as guided by the operator’s screen. Participants stood with their arms relaxed at their sides and feet positioned evenly. Each participant wore a full-body safety harness that provided protection in the event of a complete loss of balance, but did not interfere with balance recovery or assist movements. The harness straps were adjusted to ensure appropriate tension and were secure without being overly tight or excessively slack.
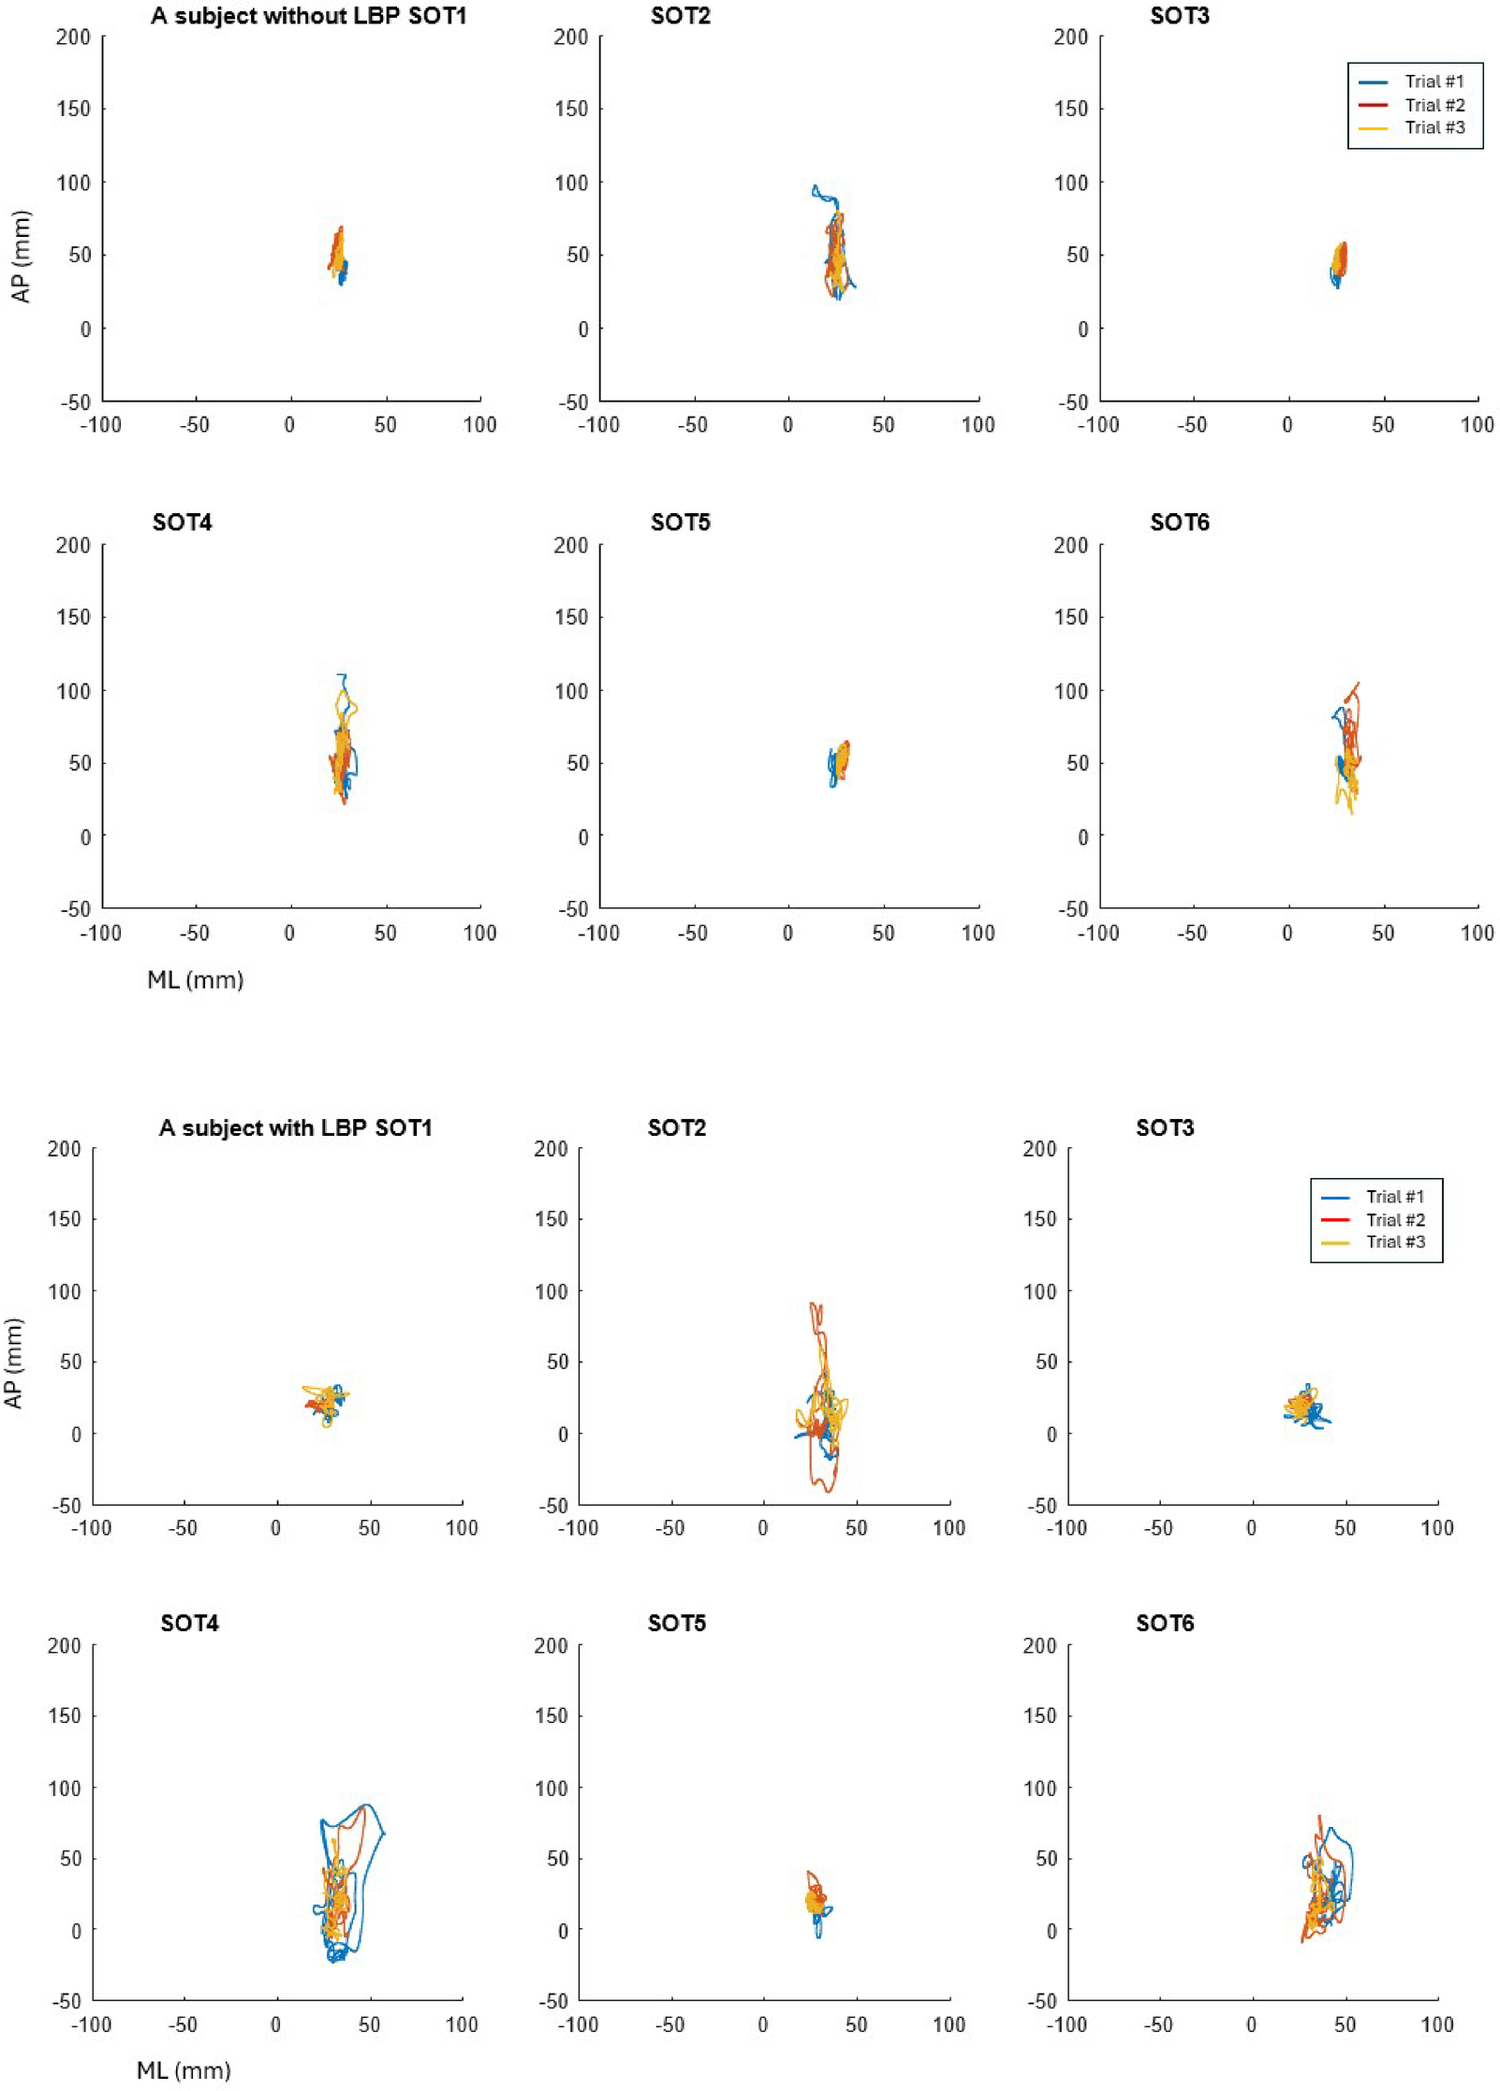
Fig. 1
Example of center of gravity (COG) trajectories over 20 seconds during six conditions of three repeated trials of the Sensory Organization Test (SOT). Overall, Condition 2 (eyes closed, fixed surface) is illustrated for a control participant and a participant with chronic low back pain (LBP). The LBP participant, identified as high fall risk, exhibited greater postural instability and increased sway variability across repeated trials in both the anteroposterior (AP) and mediolateral (ML) directions compared to the control participant
The support surface incorporated a dual-force plate system, consisting of two 23 × 46 cm footplates joined by a pin joint that allowed rotation in the sagittal plane in response to participants’ AP sway. The center of pressure (COP) beneath each foot reflects the combined output of ankle musculature and the neural control mechanisms that regulate balance. For example, increased plantar flexor activity shifts the COP anteriorly, whereas greater inversion activity produces a lateral displacement of the COP [25]. The SOT uses this system to isolate and quantify the contributions of individual sensory modalities and the integration processes required to maintain postural stability. Sensory analysis ratios approaching 1.0 typically indicate optimal utilization of individual sensory systems under conditions that challenge balance. These ratios are reflective of effective sensory integration and stable postural control in healthy individuals. Normative data derived from the SOT consistently show that values near 1.0 are characteristic of adults with intact sensory processing and minimal instability, particularly when assessing altered visual or support cues [26, 27]. In individuals experiencing chronic pain, near-normal sensory ratios may signal preserved baseline integration capabilities or adaptive mechanisms that compensate for deficits elsewhere in the postural control system [28].
Each participant was told to gaze straight ahead and to stand quietly while completing three full repetitions of the SOT protocol, which consists of six conditions. Participants stood approximately 1 meter from the visual surround (wall), ensuring the visual enclosure was within the normal field of view while maintaining a neutral head position. Each repetition included one 20-second trial for each of the six standard conditions (Conditions 1–6), totaling 18 trials per participant. Only the first trial was utilized as shown in Table 1, and there was a 10-second pause between conditions in each sequence. This repeated-measures approach was used to examine intra-individual consistency and potential adaptations in postural responses across successive exposures to sensory perturbations. Each SOT trial lasted 20 seconds, followed by a standardized 10-second rest interval before initiating the next trial. This rest period was consistent with previously published SOT protocols and was designed to minimize cumulative fatigue while maintaining test efficiency [7, 10].
Table 1 The six conditions of the sensory organization testPostural stability during upright bipedal standing was assessed on a force plate under six sensory conditions (Table 1)--Condition 1: fixed surface and visual surround, eyes open; Condition 2: fixed surface, eyes closed; Condition 3: fixed surface with sway-referenced visual surround, eyes open (creating visual–vestibular conflict); Condition 4: sway-referenced support surface, eyes open, fixed visual surround; Condition 5: sway-referenced support surface, eyes closed, fixed surround; and Condition 6: sway-referenced support surface with sway-referenced visual surround, eyes open. In Conditions 4–6, the support platform tilted in response to participants’ AP sway, altering somatosensory input and increasing proprioceptive demands. In Conditions 3 and 6, the moving visual surround refers to a sway-referenced visual enclosure that shifts with the participant’s movement, disrupting accurate visual feedback and testing the ability to suppress misleading visual input.
The SOT protocol is used to quantify reliance on somatosensory, visual, and vestibular inputs by calculating ratios of equilibrium indices across specific conditions [3]. Somatosensory reliance is defined as the ratio of Condition 2 to Condition 1, visual reliance as the ratio of Condition 4 to Condition 1, and vestibular reliance as the ratio of Condition 5 to Condition 1. Visual reliance is calculated as (Conditions 3 + 6) ÷ (Conditions 2 + 5), reflecting the extent to which an individual favors visual input when adapting to sensory conflicts [3].
Metric calculationsThe standardized foot position on the support surface aligned each ankle joint with the transverse rotational axis located at the lateral aspect of the calcaneus. On the platform, the y-axis represented AP movements, while the x-axis captured ML movements. The dual force plates rotated about the x-axis, corresponding to the ankle’s transverse axis. This alignment served as the reference point for calculating sway angles, defined as the angular displacement of the center of mass (COM) relative to the base of support, providing an index of postural stability [29]. This rotation serves as a reference point for calculating sway angles (θ), which were computed as: \(\:\theta\:=arctan\frac\)
Where:
COP (center of pressure) = The weighted average location of force application on the force plate.
AP_ankle = The AP position of the ankle joint, serving as a rotational pivot.
h = The estimated height of the COM from the force plate.
In general, increased sway angles may indicate postural instability, balance deficits, or compensatory control strategies. The platform’s frequency was set at 1,000 Hz, continuously measuring the COP under each foot. COP data were employed to calculate an equilibrium index, representing an individual’s maximum COP sway. The platform’s movement closely followed the individual’s AP sway.
Participants needed to adapt to sensory conflicts while maintaining their balance, with the Bertec system calculating equilibrium indices to assess postural sway. The equilibrium index is a measure of postural stability, quantifying COP sway in the AP direction. It assesses how effectively an individual maintains balance within a theoretical stability limit by comparing maximum anterior and posterior sway angles during a balance trial [30]. The Bertec system computes the equilibrium index to evaluate postural sway by using the following formula: Equilibrium Index = [[12.5° − (θmax (ant) − θmax(post)]/12.5°] x 100, where: θmax (ant) represents the maximum anterior sway angle during the trial; θmax(post) represents the maximum posterior sway angle during the same trial; and 12.5° is the assumed maximum stability limit in the sagittal plane for healthy individuals in normal stance, based on normative data [30, 31].
This formula calculates the proportion of sway relative to the theoretical maximum stability range, with higher values indicating better postural stability. By comparing θmax(ant) and θmax(post) to 12.5°, the Equilibrium Index represents how much sway occurs relative to a healthy individual’s expected postural stability. When COP sway increases beyond this threshold, it indicates instability or increased reliance on compensatory mechanisms to maintain balance. Thus, the equilibrium index provides an objective measure of postural stability while also reflecting the participant’s ability to control sway within their stability limits. However, this angle may vary depending on individual characteristics, reflecting the overall coordination needed to maintain standing posture. If the participant has no sway, a score of 100 would be received; and if the participant exhibits 12.5° or a greater sway (combined forward and backward), a score of 0 would be received.
In Conditions 4–6, the sway-referenced support surface was programmed to move proportionally to participants’ AP sway at a gain of 1.0, representing a 1:1 relationship between body sway and platform tilt, as per the manufacturer’s default settings. The displacement dynamically matches participants’ sway angles in real time with a latency of less than 20 milliseconds, consistent with calibration specifications provided by the manufacturer.
The equilibrium score represents the difference between the participant’s AP COP sway and the theoretical limits of stability (defined as a maximum peak to peak sway of 20°, which is expressed as a percentage) [32, 33]. The less postural sway indicates better (higher) postural stability in the sagittal plane, producing a commensurate higher equilibrium score. Equilibrium Index reflects a subject’s ability to maintain stability during static balance tasks under various sensory conditions and assesses how well an individual can maintain balance when exposed to sensory challenges, such as altered visual or support surface conditions.
The system recorded three-dimensional ground reaction forces via dual force plates. These were used to compute the instantaneous COG in both the AP and ML directions. COG sway ranges were extracted for each trial and represented as the total peak-to-peak sway range in AP and ML directions (measured in millimeters). In addition, COG sway trajectories were time-synchronized with equilibrium indices for integrated analysis.
Statistical analysisStatistical analyses were performed using IBM SPSS Statistics 23.0 (IBM Corp., Armonk, NY, USA). A priori power analysis, based on effect sizes reported in published studies utilizing the SOT in individuals with LBP [7, 10], indicated that a minimum of 28 participants would provide 80% power to detect a medium effect size (0.4) at an alpha level of 0.05. Effect sizes were also verified using partial eta-squared (η²p) from repeated-measures ANOVA, interpreted as small (≥ 0.01), medium (≥ 0.06), and large (≥ 0.14).
Independent variables included group (LBP vs. control) and trial repetition across the six SOT conditions (three repeated trials per condition). Dependent variables were equilibrium indices and sensory analysis ratios derived from each trial. Mixed repeated-measures ANOVAs were used to examine group, condition, and trial effects, as well as their interactions. When sphericity assumptions were violated, the Huynh–Feldt correction was applied. Demographic factors, such as age and BMI, were entered as covariates if significant between-groups were observed. A two-sided α = 0.05 was adopted for all statistical tests.
Comments (0)