Study design
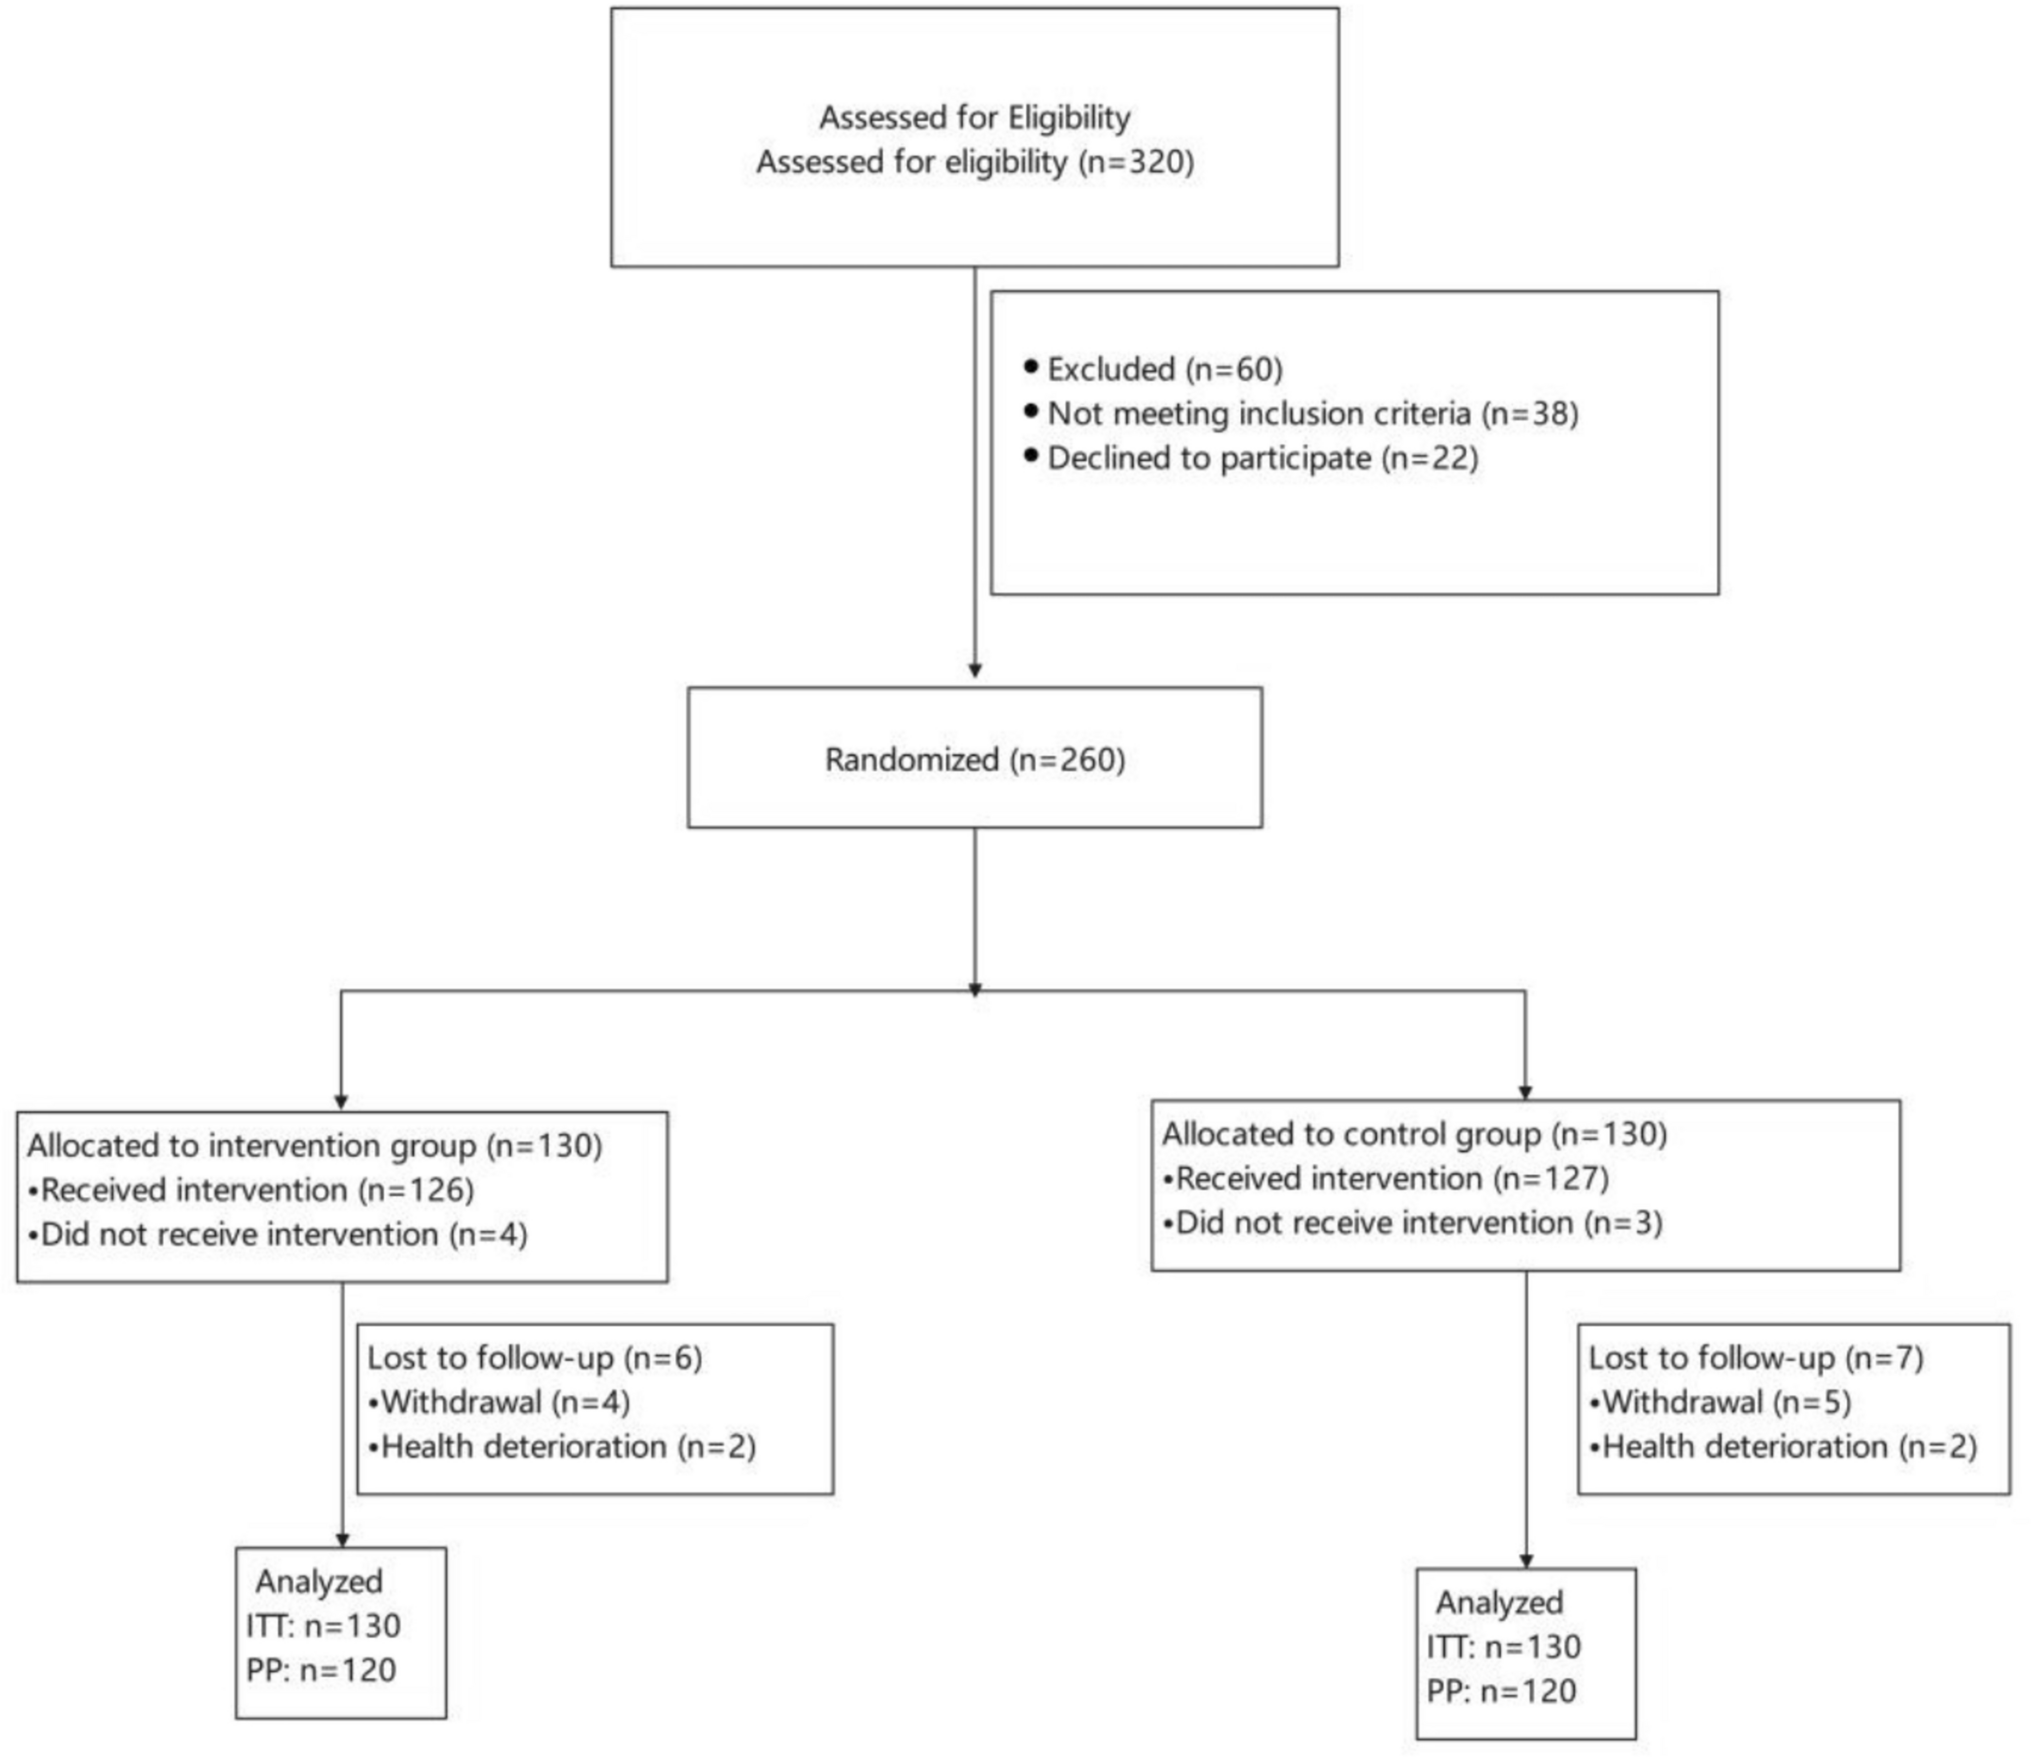
This was a cross-sectional study of adolescent survivors of childhood cancer at The Hospital for Sick Children (SickKids) Leukemia and After Care Survivorship Cancer clinics. Research Ethics Board approval was obtained for this study from SickKids [REB#1000079245] and participants were recruited from February 2023 to September 2024. Inclusion criteria were (1) adolescents aged 13–18 years old, (2) > 18 months post-cancer diagnosis, (3) no active disease, and (4) not undergoing active cancer therapy. Exclusion criteria included (1) insufficient ability to read and speak English, and (2) significant cognitive impairments or co-morbid illnesses as determined by the health care team (e.g., mental health crisis). All participants provided written, informed consent to participate in the study. Study data was obtained from an electronic survey administered to patient participants (no parent-proxy) and from the participants health record.
Health record data
A research assistant (RA) extracted disease characteristics from each participants electronic health record, including the cancer diagnosis, age at diagnosis, age at treatment completion, type of treatment and duration (chemotherapy, radiation, major and minor surgery). The intensity of cancer treatment was rated on the Intensity of Treatment Rating Scale (ITR 3), which has four categories of treatment intensity (1-least intensive, 2-moderately intensive, 3-very intensive and 4-most intensive) [14]. An ITR was calculated independently by two RAs and disagreements were resolved by a third member of the research team who was a pediatric oncologist. Patients were recruited on the day of their clinic visit, and data was extracted from the clinic note on that day to identify if pain was reported by the patient, any pain medications were prescribed or reported, and any pain-related diagnoses (e.g., headache) were documented.
Survey dataDemographic characteristics
Participants reported their age at the time of survey completion, biological sex, gender identity, ethnicity and race. Participants were then asked, “have you had pain in the past month?” with response options yes/no. For participants who responded no, the survey was terminated, and for participants who responded yes, remaining pain-related and psychosocial survey measures were administered and are described below.
Pain characteristics
Participants reported pain intensity using the 11-point Numerical Pain Rating Scale [4] (validated for the pediatric population) and pain duration on the Pediatric PainSCAN©, described below. Pain location (on a body map) and pain quality was measured using a modified version of the Brief Pain Inventory, widely used and validated in adults with cancer [16].
Pain interference
The PROMIS® Pediatric Pain Interference includes 8-items pertaining to the impact of pain on overall life, including sleep, school, social and physical activities. It has demonstrated sufficient internal consistency [11] and construct validity [35], and is validated among youth with chronic pain and with cancer [13]. With all PROMIS® measures, raw scores are converted to a T-score where 50 is the mean, 10 is the standard deviation and higher scores indicate greater expression of the construct.
Pain catastrophizing
The Pain Catastrophizing Scale—Child version pertains to pain-related worry. Total scores range from 0 to 52, with higher scores indicating higher degrees of catastrophizing [7]. The tool has been validated in pediatric chronic pain including the identification of cut-off points for the total score: low (0–14), moderate (15–25), and high (> 26) degrees of pain catastrophizing [26]. The tool includes three subscales that together represent catastrophizing, including helplessness, rumination and magnification. No cut-points for the sub-scales have been identified in the pediatric population.
Depression and anxiety
The PROMIS® Pediatric Depression and PROMIS® Pediatric Anxiety each include 8-items pertaining to symptoms of depression and anxiety in the past 7 days. Both measures are validated in the general pediatric population and in disease groups including pediatric cancer [13] and demonstrated sufficient validity and reliability [17].
Neuropathic pain
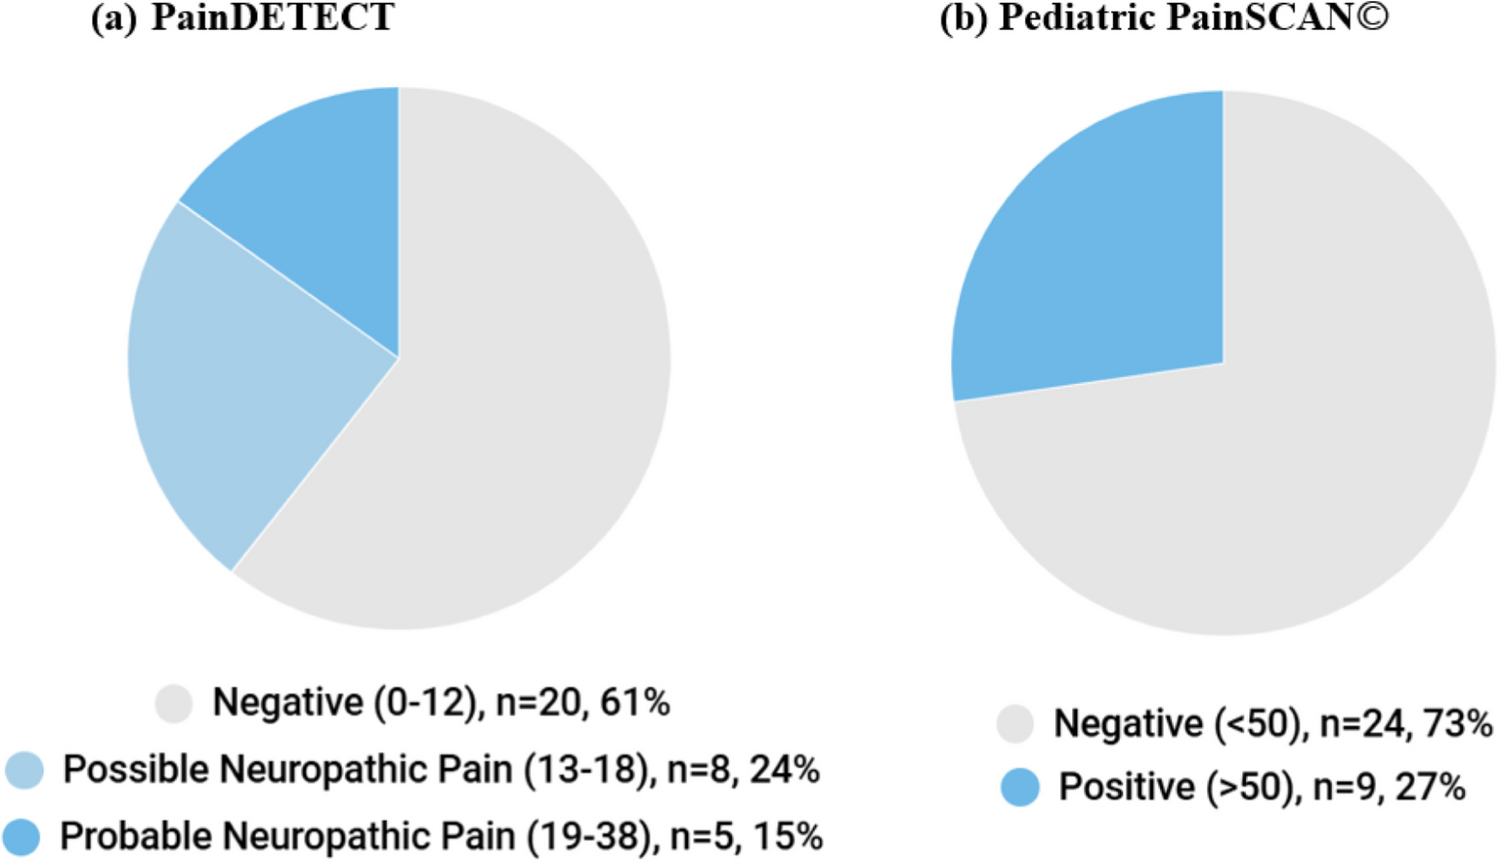
Screening, rather than diagnostic assessment, was used to identify children with NP due to feasibility. There are no validated screening tools for NP in the pediatric cancer setting, as such, two screening tools were administered in this study. The Pediatric PainSCAN© is a screening tool for NP and a related condition, complex regional pain syndrome (CRPS) developed specifically for the pediatric population [19]. The tool has 3 parts, Part A relates to pain location and intensity, Part B screens for NP and CRPS, and Part C screens for CRPS. As there are no known reports of CRPS in the pediatric cancer population [20], only Part B was administered to screen for NP. Part B includes 9-items and asks about pain quality, sensory changes and spontaneous pain; the tool is available online at https://lab.research.sickkids.ca/iouch/research-studies/pediatric-painscan/. Part B demonstrated validity (sensitivity 76% and specificity 63%) and test–retest reliability (intraclass correlation co-efficient 0.76) when tested in the pediatric chronic pain clinic setting [21]. Raw scores are converted to probability scores (0–100) with scores ≥ 50 indicating a positive screen.
The PainDETECT is a screening tool initially developed for adults to identify patients with potential NP. The validity has been tested in the pediatric chronic pain clinic setting (sensitivity 80% and specificity 33%) [12]. The tool includes 9 items rated on a 6-point Likert scale ranging from never to very strongly [10]. Raw scores range from 0–38 with scores < 13 interpreted as non-NP, 13–18 as possible NP and > 18 as likely NP.
Validity of the Pediatric PainSCAN©
The sensibility of the Pediatric PainSCAN© was measured using an adapted version of Rowe & Oxman’s (1993) 10-item Sensibility Questionnaire (Supplemental File 1). Sensibility refers to the common sense aspects of a tool, including face and content validity (the degree to which the tool adequately reflects the construct) and includes aspects of item relevance, comprehensiveness, and comprehensibility [30]. Convergent validity refers to the degree of relatedness of scores between conceptually related tools, which was evaluated by comparing scores between the Pediatric PainSCAN© and the painDETECT [22].
Data analysis
Statistical analyses were conducted using Stata 19 (StataCorp, 2025). Descriptive statistics were used to report participant demographic, pain and psychosocial characteristics and responses on the Sensibility Questionnaire. With non-parametric data, median and interquartile range (IQR) were calculated, and for parametric data, mean and standard deviation.
Prevalence rates
The prevalence of pain (number with pain/total sample size) was classified using participant responses on the question “have you had any pain in the past month?” (yes/no). For participants who responded “yes”, participants were classified with NP if they scored ≥ 50 on the Pediatric PainSCAN© or ≥ 13 on the painDETECT. The remaining participants who scored below the thresholds are referred to as participants with other pain. The prevalence of NP was the proportion of participants classified with NP within the total sample size.
Biopsychosocial factors associated with NP
Differences between participants with NP, other pain, and no pain were examined to identify biopsychosocial factors associated with NP. Variables were selected a-priori based on study hypotheses (sex, diagnosis, chemotherapy treatment) and post-hoc based on visual inspection of descriptive statistics (ethnicity, pain catastrophizing, surgical treatment). Differences were evaluated using Fisher’s exact test (categorical data with cell counts < 5), Chi Square, or Mann–Whitney U test (continuous non-parametric data). Thresholds for statistical significance (p-values) were adjusted to account for multiple comparisons.
Convergent validity
Spearman’s correlation (ρ) correlation coefficients (for non-parametric data) were calculated to compare scores between the Pediatric PainSCAN© and painDETECT. Values were interpreted as < 0.3 weak, 0.3–0.7 moderate and > 0.7 strong relationship and p-values < 0.05 were interpreted as statistically significant [27].


Comments (0)