
Remember me
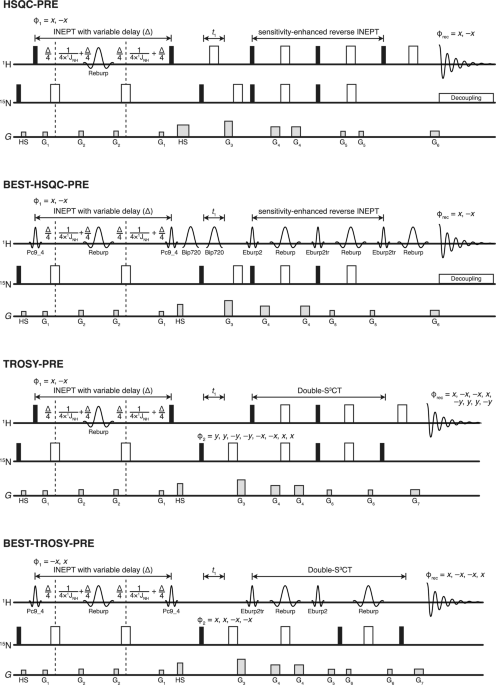
The pulse sequence for recording backbone 1HN-based CPMG experiments under extreme power conditions is shown in Fig. 1. After the INEPT transfer and subsequent 15N frequency labeling, the anti-phase 2HyNz coherence is generated, which is then subjected to the constant-time CPMG block, divided into two symmetric parts with an rcINEPT element in the middle. As discussed in the literature (Ishima and Torchia 2003), this placement scheme of the CPMG pulses after the 15N indirect dimension evolution period (t1) reduces 1HN cross-relaxation artifacts. The first half of the basic CPMG block implemented here operates on 2HyNz coherence. This CPMG block is then followed by a relaxation compensating rcINEPT element (Loria et al. 1999; Ishima and Torchia 2003) employing an amide selective REBURP (Geen and Freeman 1991) 180° refocusing pulse to interchange anti-phase 2HyNz coherence into in-phase Hx magnetization while also suppressing potential dipole-dipole/chemical shift anisotropy cross-correlated relaxation effects. The necessity and the effect of the REBURP refocusing pulse over using a hard refocusing pulse on the 1H channel during the rcINEPT element have been discussed in great detail in the literature (Ishima and Torchia 2003). We have included results from a data set recorded with a hard 180° refocusing pulse instead of the REBURP pulse in the Supporting Information (Fig. S2). As can be seen from the comparison of the respective RD profiles, the use of the hard pulse induces a small pseudo-dispersion effect of magnitude < 1 s− 1 spanning the lower values of CPMG frequency. The RD curves at CPMG frequency values higher than 500 Hz are identical. Thus, the use of REBURP pulse on the 1H channel in the rcINEPT element is recommended for this pulse sequence. The resulting Hx magnetization is subjected to the second half of the constant-time CPMG block. Generation of in-phase Hx magnetization during the second CPMG block produces some extra cross-peaks with minimal intensities arising from 1HN−1HN cross-relaxation. The presence of these cross-peaks was found to have negligible effects in the present study. On the other hand, if this becomes a source of significant problems, proposed methods (Ishima and Torchia 2003) can be used to correct the RD curves, or peaks can be removed from consideration for further analysis.
The CPMG pulses are phase cycled according to the modified version of the [0013] phase cycle (Yip and Zuiderweg 2004; Yuwen and Kay 2019) adjusted for the rcINEPT element. Use of this phase cycle usually introduces a linear decay of the measured R2,eff with increasing CPMG frequency (Yip and Zuiderweg 2004) through the mixing of longitudinal and transverse relaxation occurring during the CPMG pulses (see Supporting Information for more details). To correct this linear decay experimentally, the weight of the longitudinal relaxation has to be made constant for all CPMG fields. We have used the elegant solution described in the literature (Yuwen and Kay 2019) by adjusting the inter-pulse delay (τCP) between CPMG pulses as prescribed to accommodate for longitudinal relaxation during pulsing and incorporating a compensating delay Δ at the end of the CPMG blocks during which the magnetization is longitudinal, i.e., Hz. The mechanism of this compensation is briefly summarized here. It is evident from (Yip and Zuiderweg 2004) that during the CPMG refocusing pulses with the [0013] phase cycle, the magnetization experiences transverse relaxation during three-quarters of the refocusing pulse length and longitudinal relaxation during one-quarter of the refocusing pulse duration, on average. Thus, for any given CPMG block loop counter in the pulse program read from the list, N, the compensated inter-pulse delay (τCP) is adjusted as follows: \(\:_\text}=\left(_\text\text\text}/4N\right)-(_\times\:0.75)\) and the compensating delay Δ is given by: \(\:=(_\text\text}-N)\times\:_\). Nmax is the maximum value of N from the loop counter list used in the experiment, and \(\:_\) is the length of the 90° hard pulse. Therefore, for the reference plane the compensation delay Δ is maximum. As the number of CPMG blocks increases in the experiment, the compensation delay is redistributed in the echo durations surrounding the CPMG refocusing pulses. This causes the magnetization to experience constant longitudinal relaxation irrespective of the value of N, the subsequent effect of which on the amplitude of the magnetization, is already accounted for in the reference spectrum. Thus, the linear decay is removed even with very large values of N corresponding to CPMG frequencies leading up to 30 kHz or more. During each loop of the CPMG block under the [0013] phase cycle, the total duration in which the magnetization undergoes pure transverse relaxation is given by τCPMG, where \(\:_\text\text\text}=_\text}+(_^\circ\:}\times\:0.75)=\left(_\text\text\text}/2N\right)\). Here, \(\:_\) denotes the duration of the 1H CPMG refocusing pulses being applied at the 1H high power limit available to the probe (usually 12 W). The CPMG frequency (\(\:_}=1/_}=\:N/_}\)) is modulated by decreasing τCPMG via decreasing the compensated echo delay τCP, which is achieved by incrementing N in the list. In extreme CPMG conditions, τCPMG approaches the 1H 90° hard pulse duration. As the refocusing hard pulses in the CPMG blocks are phase cycled according to the [0013] scheme, minimum number of CPMG blocks on each half can be set to integer multiples of four, especially for low values of CPMG frequencies (< 1 kHz). However, under E-CPMG conditions, where much higher CPMG frequencies are used (up to 30 kHz in this case), the number of CPMG blocks on each half is recommended to be set to integer multiples of 16. This allows the completion of the full super cycle implemented by permutation of the phases in the basic [0013] block (please refer to the phase list in the pulse sequence code in the Supporting Information). Even under such extreme power conditions, the modified CPMG elements proposed earlier (Yuwen and Kay 2019) were found to produce reliable results. This experiment in E-CPMG limit resembles high power R1ρ or the HEROINE (Ban et al. 2013) experiments (both employing extreme power spin lock fields) due to the CPMG duration almost being totally filled with hard pulses. However, because of the modified delays compensating for longitudinal relaxation during [0013] phase cycled pulses, the CPMG block in this 1HN E-CPMG pulse sequence never fully converts into a constant phase spin lock field, even under the most extreme CPMG frequency.
The lower requirement of absolute values in wattage to reach the same nutation frequency is one of the biggest advantages of 1H-based RD experiments over 15N RD experiments, where sample heating poses a significant problem. To further reduce the possibility of sample heating from pulsing at such extreme conditions, maintaining the ionic strength of the sample to low values is recommended by using low salt concentrations in the sample. We have included overlays of 1D 1H (Fig. S3A, at 600 MHz) and 2D 15N-1H (Fig. S3B, at 800 MHz) spectra acquired with the smallest and largest values of CPMG frequency used in the experiments. The spectra overlap within resolution limit and there is no peak shift from sample heating. However, in the case of samples requiring unavoidable higher salt and buffer concentrations, sample heating may still occur as sample heating is generally a function of the electric susceptibility (Wang and Bax 1993). To address this potential issue, we have included an optional heat compensation block, which keeps the total number of 180° hard pulses being applied on the 1H channel constant. We have also included a comparison of the effect of this heat compensation block for the 600 MHz spectrometer in the Supporting Information (Fig. S3C). These results indicate that for sample condition described in this manuscript, sample heating is not an issue while reaching extreme power conditions on 1H channel using the 1HN E-CPMG pulse sequence. To ensure minimal heating, the duty cycle was kept to a very low value using a 3 s recycle delay with a maximum of 40 ms constant CPMG duration (TCPMG). Monitoring the cryopanel heater reserve power indicated that overall heat generation in the probe head was more sensitive to low-power 15N decoupling being used during the acquisition than the E-CPMG 1H pulses being applied, the contribution of which was negligible. To reduce the impact of required low power 15N decoupling on probe heating, the acquisition time for direct 1H detection dimension was set to a maximum of 50 ms. However, for cases where higher 1H resolution is necessary, a potential trade-off of larger acquisition time can be implemented with increased recycle delay with reduced TCPMG. TCPMG can also be reduced by increasing the contribution of fast chemical exchange (Rex) to the measured overall transverse relaxation rate (R2,eff). Rex increases quadratically with the magnetic field (B0) and is inversely proportional to the kinetic rate of fast chemical exchange, which in turn decreases with reduction of sample temperature. Thus, moving to a lower temperature or a higher B0 field could assist in increasing the exchange contribution to transverse relaxation and subsequent lowering of acceptable TCPMG value. In addition, nutation curves were collected at CPMG frequencies of 2 kHz and 30 kHz to check for detuning related pulse length change upon use of extreme power for 40 ms. The results showed a decrease in pulse length of ~ 4% (7.5 µs 90° for 2 kHz vs. 7.2 µs 90° for 30 kHz) for the 800 MHz cryoprobe and showed an increase of ~ 2.6% (8.15 µs 90° for 2 kHz vs. 8.38 µs 90° for 30 kHz) for the 600 MHz Prodigy cryoprobe. Nutation experiments were recorded at two more intermittent power levels, the results of which indicated a linear change. Thus, we can conclude that the effect of detuning is small even for using such extreme power levels and is expected to be smaller than the radio frequency field inhomogeneity that is usually in the low two digit % range. Moreover, this experiment as well as many other experiments developed in the last decade utilizing E-CPMG and high power spinlock fields (summarized in the Introduction), starting from (Ban et al. 2012), clearly demonstrate that, after consultation with hardware vendors, commercially available modern cryoprobes can be safely operated beyond the usual specifications without any short and long-term damage or loss of sensitivity to the probe. This study highlights the benefits of further investigation and reevaluation of the specifications of commonly used commercially available cryoprobes.
The pulse sequence was tested on a uniformly 15N labeled ubiquitin sample, which was perdeuterated at all non-exchangeable 1H sites. Ubiquitin was chosen because ns to ms motion of the protein backbone had been studied with various NMR experiments (Tjandra et al. 1995; Mills and Szyperski 2002; Briggman and Tolman 2003; Massi et al. 2005; Lakomek et al. 2008; Lange et al. 2008; Hansen et al. 2009; Ban et al. 2011; Charlier et al. 2013; Smith et al. 2016; Wardenfelt et al. 2021), as well as molecular dynamics simulations (Lindorff-Larsen et al. 2016; Champion et al. 2024). Recently, using high power 1HNR1ρ sequence, a concerted peptide flip motion on timescales of tens of µs was detected for ubiquitin at 277 K (Smith et al. 2016). In addition, the terminal residues of ubiquitin exhibit only fast motion below the µs-ms timescale at such ambient temperature conditions. They could, therefore, effectively serve as internal controls for evaluating the performance of the pulse sequence. The necessity of perdeuteration in 1HN CPMG experiments has been discussed in the literature (Ishima and Torchia 2003). It eliminates 3J(HN–Hα) coupling, while also drastically suppressing the cross-peaks and artifacts arising from 1H−1H cross-relaxation. Perdeuteration leads to a reduction of intrinsic relaxation rates (R2,0) of the 1HN nuclei, thus facilitating the detection of smaller magnitudes of underlying chemical exchange processes. Especially, under high power E-CPMG conditions, perdeuteration coupled with the [0013] phase cycle suppresses the possibility of HN−Hα Hartmann−Hahn transfer, even beyond 30 kHz of CPMG frequency, as observed. We would like to point out that this approach, in its current form, may not work with fully protonated proteins and for highest power E-CPMG condition, presently, perdeuteration remains necessary.
We first tested the performance of this sequence in ubiquitin under ordinary CPMG experimental conditions by acquiring site-specific backbone 1HN CPMG dispersion curves up to νCPMG values of 2 kHz at 600 MHz, 277 K (Fig. S4). At this experimental condition, the majority of residues produce flat dispersion profiles free from significant artifacts. For certain residues (F04, V05, K06, G10, E34, D58, Y59, and N60), small oscillations and pseudo-dispersion build-up artifacts (< 1 s− 1) were observed for low values of νCPMG < 500–1000 Hz, potentially arising from 1HN– 1HN cross-relaxation as previously discussed in the literature for 1HN CPMG and R1ρ experiments (Ishima and Torchia 2003; Eichmüller and Skrynnikov 2005). Relaxation dispersion profiles with significant amplitudes (> 2 s− 1) were observed for residues I23, K33, I36, E51, T55, and I61. Most of these residues are known to undergo fast chemical exchange processes as shown by earlier literature (Massi et al. 2005; Hansen et al. 2009; Smith et al. 2016). However, because of the observed low amplitude of the RD curve over this very small νCPMG range compared to the timescale of the underlying processes, we did not fit the dispersion profiles quantitatively. Overall, this result underlines the need to push the νCPMG values to the highest available limit.
We then proceeded to record the RD profiles of ubiquitin with the 1HN E-CPMG pulse sequence under extreme CPMG conditions at 600 MHz and 800 MHz spectrometers at 277 K. We chose to limit this study to 600 MHz and 800 MHz magnetic field strengths because they are in widespread use. The dispersion profiles collected using the proposed pulse sequence for selected 1HN sites are shown in Fig. 2. The dispersion curves for all the resolved residues are shown in Fig. S5. Representative backbone 1HN E-CPMG relaxation dispersion profiles from residues exhibiting the presence of unambiguous fast chemical exchange processes recorded with the proposed 1HN E-CPMG pulse sequence are shown in Fig. 2A. Dispersion profiles of all residues showing such chemical exchange are shown in Fig. S5A. Many of these residues were previously reported to be involved in peptide-flip motion of the ubiquitin backbone occurring at ~ 55 µs at 277 K, detected using high power 1HNR1ρ experiment (Smith et al. 2016). The datasets acquired at both magnetic fields were simultaneously fit to the motional model under fast-exchange approximation, producing a single τex and independent ϕex values for each B0 field in a residue-specific fashion. We note here that τex was fit in a per residue fashion and fitting for a single global τex corresponding to the underlying motional mode was not performed to keep the focus of this paper on the pulse sequence performance. The fitted τex, ϕex, values are included in the figure panels in Fig. S5A. Compared to the high power 1HNR1ρ experiment (Smith et al. 2016), dispersion profiles with larger amplitudes and less scatter were obtained at 600 MHz. The RD curves of D58 and Y59 under 600 MHz showed a small rising pseudo-dispersion artifact (< 1 s− 1) within νCPMG values of 500 Hz. Utilization of the 800 MHz spectrometer with the E-CPMG pulse sequence enabled the collection of RD profiles with larger variations in R2,eff values, producing evidence of fast timescale peptide-flip motion impacting more residues (T22, A28, K29, I30, G35, Q40, Q41, A46, G47, K48, L56, D58 Y59, Q62, V70, and R72), than reported earlier. For some residues (Q40, K48, Y59, and V70), 600 MHz E-CPMG dispersion data was not sufficient to produce meaningful fit results as modulations of R2,eff values were less than 1 s− 1. However, if the modulation of R2,eff values were larger than 1 s− 1 for the 800 MHz dataset, the results at both fields were included for fitting.
Fig. 2
Representative site-specific backbone 1HN E-CPMG relaxation dispersion (RD) profiles of ubiquitin obtained using the pulse sequence shown in Fig. 1 at 277 K, 600 MHz (red) and 800 MHz (blue) spectrometers. Grey-shaded areas indicate the regions typically observable with conventional low power CPMG experiments. (A) RD profiles for selected residues exhibiting fast µs dynamics with the fit values of site-specific motional timescales indicated inside the figures. (B) RD profiles from sites lacking fast detectable dynamics. Black lines indicate the average R2,eff values computed over the whole CPMG frequency range. The same average R2,eff values, along with computed RMSDs are represented in the figure, color-coded according to magnetic field strength
For all other residues, previously not found to be involved in peptide-flip motion (Smith et al. 2016), the new 1HN E-CPMG experiment produced flat dispersion profiles (Fig. 2B for representative residues and Fig. S5B for all resolvable residues), indicating a full in-experiment correction of linear decay even at very high E-CPMG frequencies up to 30 kHz. For these residues, we have indicated the average R2,eff values in the figures with the calculated RMSD of R2,eff over the whole E-CPMG frequency range showing minimal linear decay or other artifacts. Residues F04, V05, and N60 show some minute (< 1 s− 1) cross-relaxation based oscillations and pseudo-dispersion build-up artifacts within frequency ranges of 500 Hz (Fig. S5B). The same result has already been seen for the 2 kHz experiment. However, even for these residues the dispersion profiles are constant for νCPMG values above 1 kHz, indicating that there is no fast exchange detectable at 277 K and that the removal of the linear decay works. A number of residues (T07, L08, I13, D32, E34, D52, E64, L67, L69, and L71) show the presence of relaxation dispersion. However, because of the limited amplitude of the exchange term on R2, eff values (< 1 s− 1 at 800 MHz), such residues were not considered for motional analysis under present conditions. We observed a very small systematic rise of measured R2,eff values for the high values of νCPMG > 22 kHz for the data collected at 800 MHz spectrometer. We have no explanation for this phenomenon. A rise in the sample temperature can be safely excluded since this experiment was recorded with an active heat compensation block, which kept the number of CPMG pulses constant for the whole experiment, irrespective of the CPMG frequency. However, as noted, this effect is very small.
We note here that in addition to the peptide-flip motion directly observed previously as well as in this report, a faster motion has been predicted to impact a smaller number of residues around β1−β2 loop and more sites distributed throughout the ubiquitin backbone, termed as “pincer” mode (Lange et al. 2008). Existence of this motional mode has been probed with additional experiments (Charlier et al. 2013; Michielssens et al. 2014; Wardenfelt et al. 2021; Champion et al. 2024). The specific characterization of timescale and magnitude pertaining to this motion has been subject to debate because of apparent disagreement among the results obtained from various methods and the lack of directly observed unambiguous relaxation dispersion data. Using this new high power 1HN E-CPMG experiment, for residue T09 (Fig. 2A), we unambiguously observe the presence of a faster motion compared to peptide-flip mode, which is found to fit to a timescale of ~ 12.5 µs at 277 K. We will describe the nature of this motion in further work.
These fitted timescales (τex) pertaining to peptide flip and a faster mode (in case of residue T09) motions (shown in black in Fig. 3A) and corresponding chemical shift variances (ϕex) (shown in Fig. 3B), obtained under both 600 (red in Fig. 3B) and 800 MHz (blue in Fig. 3B) magnetic fields, were compared in Fig. 3 to the previously reported values observed from high power R1ρ experiments (Smith et al. 2016) obtained at 600 MHz (green in Fig. 3A and B). Overall, the results obtained using the new experiment show excellent agreement with the previously published results reproducing peptide-flip motions for residues clustered around 50 to 55 µs. Additionally, the new 1HN E-CPMG pulse sequence coupled with the application of higher field enabled the discovery of more residues involved in peptide-flip motion, as summarized in Fig. 3C.
Fig. 3
Comparison of residue-specific fit parameters derived from 1HN E-CPMG pulse sequence shown in Fig. 1 with previously published results (Smith et al. 2016) obtained using high power 1HNR1ρ pulse sequence. (A) Comparison of the fitted timescales (τex) from current experiments (black) with previously published results (green). (B) Comparison of fitted chemical shift variances (ϕex) from current experiments at 600 MHz (red) and 800 MHz (blue) with previously published results (green). (C) Cartoon representation of ubiquitin (PDB ID: 1UBQ) showing the extent of fast motion present through the backbone reported in the earlier study (green) with newly detected extra sites using current experiment at 600 MHz (red) and 800 MHz (blue). T09, which is found to be participating in a faster motion, is represented as blue sticks
Further, to test the limits of this 1HN E-CPMG experiment, datasets were recorded at 292 K and 600 MHz, mirroring the experimental condition reported earlier (Smith et al. 2016). The resulting dispersion curves for some representative residues undergoing fast exchange are shown in Fig. 4A, whereas the RD curves for all resolved residues are shown in Fig. S6. Most residues (Fig. S6A), at this temperature, show no dispersion. No significant artifacts are observed while having flat curves with low RMSD, indicating the robustness of this pulse sequence at very high RF power. Clean dispersion profiles are observed for residues I23, I36, L43, F45, E51, T55, and I61 (Fig. S6B) involved in peptide-flip mode, albeit with lower amplitude. Individual fits of the RD profiles were performed for these residues, the fitting details being indicated in the figure legends. Figure 4B and C summarize the fitted timescales (τex) and chemical shift variances (ϕex) along with the previously published results from high power 1HNR1ρ experiments. Overall, there is excellent agreement between the current observed result and previously reported values, with a broad agreement of the extracted timescales clustered around ~ 15 µs with the previously reported global timescale of ~ 13 µs. We note that at higher temperatures, solvent exchange rates at 1HN sites increase. Ubiquitin is known to have very large water exchange rates for particular 1HN sites, e.g., T09, A46, G75, etc., at elevated temperatures (Rennella et al. 2014). For these residues, the R2,eff reported by this experiment includes the contribution of water exchange, producing larger constant R2,eff values which are unmodulated by the changing values of CPMG frequency. An increase in estimated noise from repeat point measurements for these residues has also been observed at elevated temperatures (Fig. S6).
Fig. 4
Relaxation dispersion (RD) profiles and results obtained with application of 1HN E-CPMG pulse sequence shown in Fig. 1 for ubiquitin backbone 1HN sites involved in observable peptide flip motion measured at 292 K and 600 MHz. (A) Representative site-specific backbone 1HN E-CPMG RD profiles of ubiquitin obtained using the pulse sequence shown in Fig. 1 (red). (B) Comparison of fitted timescales (τex) and (C) chemical shift variances (ϕex) from data obtained using the pulse sequence shown in Fig. 1 (red) with previously published results (Smith et al. 2016) obtained using high power 1HNR1ρ pulse sequence (green)
Comments (0)