
Remember me
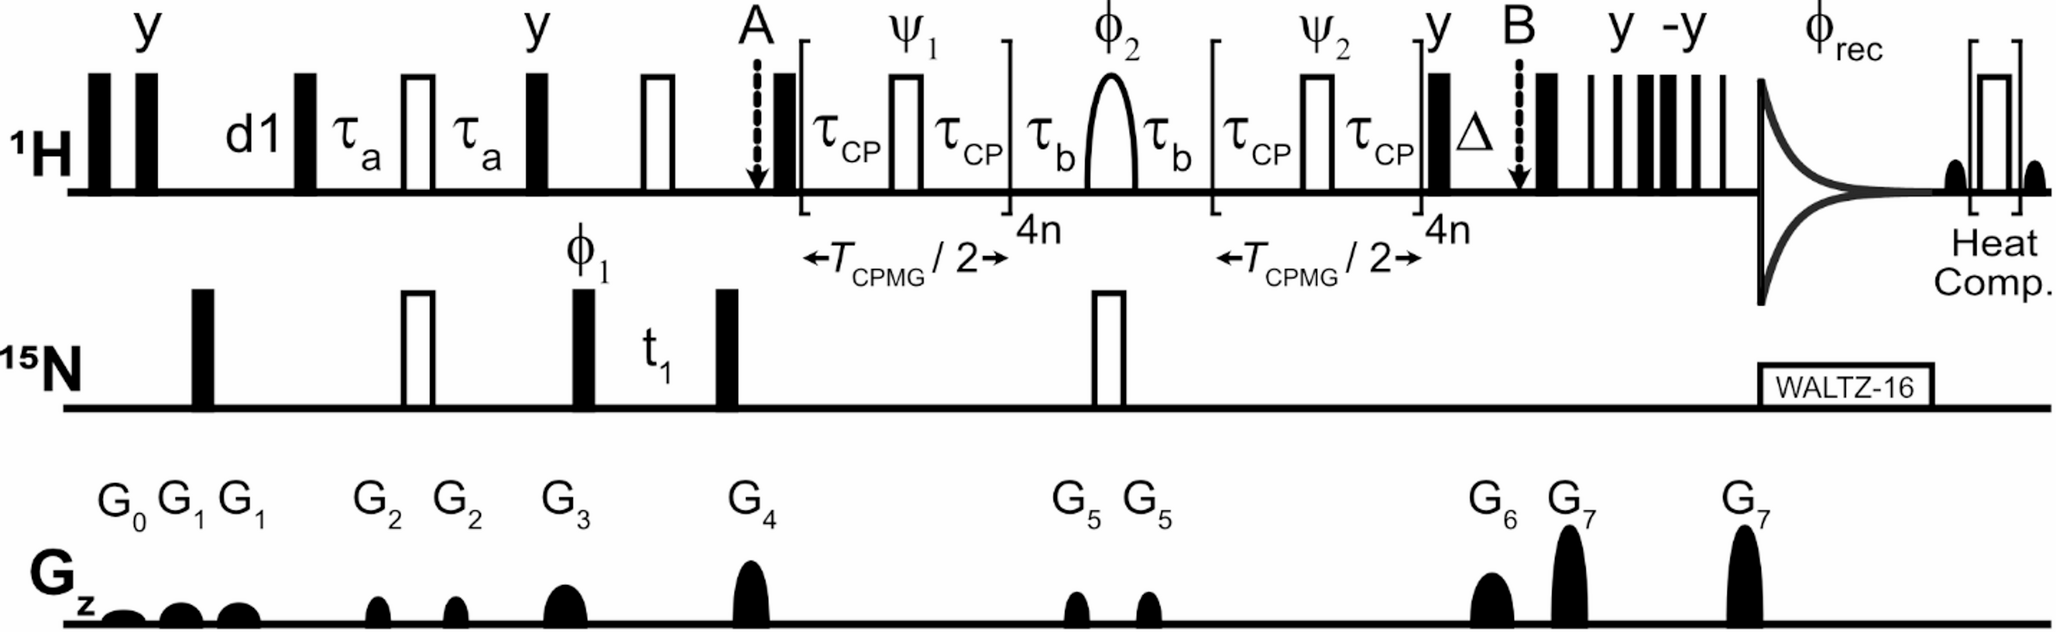

To investigate whether high MAS rates allow for the detection of long-range contacts in protonated protein samples despite the presence of strong proton-proton homonuclear couplings and short-range proton-carbon heteronuclear couplings, we measured 13C–1H contacts using two long CP 1H detected pulse sequences (Friedrich et al. 2020), (H)NCOH and (H)NCAH, at a MAS rate of 105 kHz. The setup of these experiments is similar to the (H)NCAHA, which can be used for backbone assignment under these conditions (Stanek et al. 2016b), or the suite of (H)CNH assignment experiments, used in both protonated and deuterated samples at high MAS rates (Barbet-Massin et al. 2014; Zhou et al. 2012). Starting with the same CP conditions optimized for the assignment suite, conditions for the long-range (H)NCH experiments can be readily found by increasing the length of the last CP step. The (H)NCOH and (H)NCAH use the same polarization transfer scheme and the pulse sequence for both is given in Fig. S1. Initial polarization transfer is from HN to the directly bonded nitrogen via a short CP period, followed by transfer to the backbone CO in i-1 position or the Cα of the same residue via specific CP (Baldus et al. 1998). The length of the final polarization transfer step is variable and longer than needed for a one-bond transfer, making it non-specific with transfers to numerous nearby protons from the carbon atom (Friedrich et al. 2020). Therefore, the (H)NCH experiment yields correlations from the backbone Cα or CO to multiple protons in contrast to the (H)CNH experiments, which yield a single peak for each residue.
Cross-peaks were assigned using the chemical shifts from the backbone resonance assignment suites and distances from the crystal structure of the microcrystalline form of GB1 used here (Frericks Schmidt et al. 2007). Additional resonance assignments of sidechain protons in the (H)NCOH spectrum were made by cross-referencing with the complementary (H)NCAH spectrum. The starting carbon was unambiguously determined for most of the residues except a few with degenerate 15N and 13C chemical shifts. Each plane of the 3D spectra reveals multiple correlations from individual carbon sites to amide and aliphatic protons, with the latter displaying the highest signal intensities.
The rf amplitudes for the spin locks and contact times of the final 13C–1H CP transfer step are optimized to maximize long-range transfers. Figure 1 compares the peaks observed in the 3D (H)NCOH spectrum as the final contact time was varied from 1 to 8 ms, the value which was optimal in fully deuterated samples. Figure 1a shows correlations from a representative residue, A24CO, to amide and sidechain protons of residues across different contact times in the (H)NCOH experiment. The sequential peaks corresponding to T25-HN and A24-Hα are consistently observed with similar intensity at all contact times. As the contact time increases to 4 ms, additional cross-peaks can be assigned to both sequential residues as well as structurally defining contact to K28. However, at 8 ms, fewer cross-peaks are observed, especially in the amide spectral region. This observation contrasts with similar experiment conducted on deuterated samples at 37 kHz, where mixing times up to 8 ms continued to show additional cross-peaks. This drop in cross-peak intensity at longer mixing times is likely due to 1H–1H spin diffusion during these longer spin locks (Kolodziejski and Klinowski 2002). We see similar behavior for a beta-sheet residue G9CO in Fig. 1b, with additional proton contacts as contact time increases up to 4 ms, and a sharp decrease, especially in the amide region at a contact time of 8 ms. Based on these results, the contact time for the final CP step was set to 4 ms for all subsequent acquisitions of both (H)NCOH and (H)NCAH spectra.
Fig. 1
Representative strips of the 3D (H)NCOH spectra of GB1 showing the effect of varying 13C–1H CP step contact time on cross-peak density. 1 ms, 1.5 ms, 2 ms, 4 ms and 8 ms contact times are depicted in pink, light blue, blue, red and green respectively. (a) Shows correlations at the chemical shift of T25N-A24CO to different protons with resonance assignment indicated with dashed lines. Sequential peaks show the highest intensities across all the contact times. At 8 ms, strong correlations are still observed for sidechain protons, but the amide protons show diminished intensities. (b) Shows K10N-G9CO correlations to different protons. 4 ms shows the maximum cross-peak density
The (H)NCOH spectrum with a contact time of 4 ms revealed a range of HN and aliphatic correlations that provide valuable insights into residue-specific interactions and structural connectivity (Fig. 2). For example, for 9GCO (Fig. 2a), HN correlations are observed to E56, L12, T11, G9, and the sequential K10. Moreover, there is a correlation to the sidechain N8-Hδ. Similarly, at the V54CO frequency (Fig. 2b), there are HN correlations to E42, G9, T44, T53, T54, E56, T55, and its hydrogen bonding partner, N8. Resolved aliphatic correlations, mostly Hα, Hβ and Hγ, were made across the spectrum, especially to the same residues observed in the HN region. For example, V54CO (Fig. 2b) shows Hα and Hγ correlations to T55, V54, T53, N8, E42, W43. V54CO also shows correlations to W43-Hε (Fig. 2b); this side chain nitrogen was extremely important for defining the core of GB1 in the first proton-detected structure of GB11. Figure 3 displays the protons within 6 Å of V54CO to better visualize the correlations. We can see that the density of side chain protons is more important than the existence of hydrogen bonding in explaining the appearance of cross peaks.
Fig. 2
13CO–1H 2D planes of the 3D (H)NCOH spectrum. Each strip contains assignments of the observed 13CO–1H correlations, including amide and aliphatic correlations. (a) shows G9CO correlations to protons of nearby residues, T11, N8, L12, K13, and also the long-range, E56. (b) V54CO also shows multiple proton cross-peaks correlations to neighboring residues and to E42 and N8. (c) A26CO shows correlations to A20, A24, T25, A26, E27, K28, V29, F30 and K31
Fig. 3
Structural representation of V54CO contacts. Oxygen, Nitrogen and carbon atoms are represented in gray, blue and white respectively. V54CO atom is depicted with a mauve sphere. (a) Observed amide protons are depicted with red spheres. (b) Additional aliphatic protons are depicted with red spheres. Tan spheres depict protons within 6 Å not observed
To understand the completeness of CO–HN correlations observed in the 3D (H)NCOH spectrum, the protonated GB1 crystal structure (Institute and of Health (NIH) 2022; Frericks Schmidt et al. 2007), was analyzed to identify atoms within defined distances. For distances ≤ 3 Å, we observed 97% of expected correlations which were almost exclusively intraresidue (i = j) or sequential (|i − j|= 1) residues. Of the amide correlations expected between 3–4 Å, 81% were observed, and 43% of these are medium (1 <|i − j| ≤ 5) to long-range peaks (|i − j| ≥ 5), with the rest again sequential. Most of these long-range correlations are the result of the hydrogen bonding network fundamental to the formation of protein secondary structure, namely across adjacent beta strands and to the Hi+4 position in the alpha-helix. Also, between 4–6 Å, ~ 39% of observed peaks are medium to long-range correlations, while 61% are sequential. The summary statistics of observed peaks is shown in Table S2. In addition, two sidechain carbonyl carbons, 8NCγ and 37NCγ, show multiple proton cross-peaks (Fig. 4). 8NCγ shows correlations to L7, G9, E56 and N8, while 37NCγ shows correlations to A34, G38 and N37. About 203 HN cross-peaks were unambiguously assigned in the (H)NCOH spectrum. A full list of manually assigned correlations in the (H)NCOH spectrum is listed Table S3. Additional strips from the spectrum and sidechain correlations in glutamine sidechain CO are shown in Fig. S3 and S4 respectively.
Fig. 4
15Nδ–13Cγ 2D planes illustrating the observed 13CO–1H correlations from asparagine sidechain. The N37Cγ exhibits correlations exclusively to protons of residues in close proximity, while the N8COγ shows correlations to protons of nearby residues and more distant residue, E56
The primary distinction between the observed correlations in the (H)NCOH and (H)NCAH spectra lies in the distribution of intraresidue, sequential, and long-range peaks. The (H)NCOH spectrum gives a range of medium and long-range cross-peaks, reflecting its capabilities of capturing interactions beyond direct neighbors. In contrast, the (H)NCAH spectrum predominantly displays sequential cross-peaks within a single residue or immediate neighbors. Most of the cross-peaks observed in the (H)NCAH spectrum correspond to aliphatic protons, with comparatively fewer correlations to HN protons. Typically, only the HN correlated with the Cα of a given residue is detected. However, the weaker cross-peaks in the amide region were observed with extended signal averaging (62 h experiment time, ~ 3.5 × longer than the CO version). For instance, at the frequency corresponding to the G9Cα chemical shift (Fig. 5a), there is an HN correlation to T55 in addition to the sequential residue K10. Also, at G38Cα (Fig. 5b), HN correlations are observed with the neighboring residues N37, V39, D40, and N35. Additionally, aliphatic correlations were detected for N37 and D40 alongside the expected correlations to G38. Finally, for V39Cα, the HN correlation is only to D40 and V39 (Fig. 5c, 6). A full list of manually assigned observed correlations is listed in Table S4. Notably, some of these correlations correspond to a distance greater than 6 Å, such as the G9Cα–T55HN and G38Cα–N35HN correlations, indicative of spin diffusion which will be discussed more later.
Fig. 5
15N–13Cα 2D planes of the 3D (H)NCAH spectrum. Each strip displays the assigned 13Cα–1H correlations, including amide and aliphatic correlations. Residue G38 shows more cross-peaks in the amide region compared to G9 and V39. Each plane contains cross-peaks for its own protons
The (H)NCAH experiment has only ~ 67% of the sensitivity of the (H)NCOH experiment (Fig. 6), a difference mainly due to lower N-CA CP efficiencies which we also observe in our assignment spectra at 105 kHz MAS. Both experiments yielded C-H correlations, with the (H)NCOH experiment producing CO–H correlations in both the amide and sidechain regions. In contrast, fewer Cα–HN contacts were observed in the (H)NCAH experiment, with most contacts localized in the intraresidue. Since this was a protonated sample, stronger correlations were observed across both experiments for the aliphatic spectral region. The observed correlations to Hα and methyl protons were sufficient to allow for the assignment of sidechain protons in GB1. Although sidechain proton assignments were established in a study by Stanek and co-workers (Stanek et al. 2016b), the value of this experiment lies in the additional correlations observed with other sidechain protons, providing structurally relevant contacts. This experiment could be used in conjunction with (H)CCH-type experiments, which provide comprehensive sidechain proton information (Stanek et al. 2016b).
Fig. 6
Structural representation of V39Cα contacts. Oxygen, Nitrogen and carbon atoms are represented in gray, blue and white respectively. V39Cα atom is depicted with a mauve sphere. Observed hydrogen atoms are depicted with red spheres. Tan spheres depict other neighboring protons not observed at 6 Å1H 1D overlay of (H)NCOH (red) and (H)NCAH (blue) spectra highlighting differences in sensitivity
As shown in Fig. 6, the 1D (HNC)H version of the experiment (the first row of the 3D) gives valuable information about the eventual content of the 3D experiments. As such, it was used extensively to optimize the final CP step. While, in general, spin lock power levels based on the optimal values from (H)CNH-type experiments were close to the final conditions used for the (H)NCH experiments, we would like to note an intriguing dependence on the position of the tangent ramp of the final CP. As the (H)NCAH experiment did not initially yield large numbers of long-range contacts, we systematically sampled a wide array of potential Cα-H cross polarization conditions. We have previously noted that for 2D (H)NH and (H)CH-type experiments, having a variable ramp on the 1H channel (i.e., the destination nucleus) during the return 15N–1H or 13C–1H CP step results in maximal signal for short, one-bond CP transfers (data not shown). This effect is small, often around 10%, but notable enough that we include this optimization beyond the symmetrical condition where the initial and return CP steps (H–N and N–H) are identical (Matsunaga et al. 2021). For the longer-range CP used in this study, we found that the position of the ramp in the final CP step affected which types of cross-peaks were observed in the experiment. Fig. S2 shows the results of optimizing the total signal intensity of the (HNCO)H 1D with the ramp on the 1H (green) and 13C (red). Here, we see an almost complete lack of 13CO–1Hα transfer with the ramp on the 1H. Larger cross-peak densities were observed when the ramp is on 13C compared to when placed on 1H. Given our desire to detect structurally relevant CO–HN correlations, we were hopeful that this “no Hα” condition might yield additional useful cross peaks in the HN region. However, as Fig. S2b shows, if anything, there were fewer long-range correlations in the 1H ramped spectrum. Given that our 1H carrier was on the water signal at 4.6 ppm, we imagine there could be some on resonance band selective 1H–1H mixing occurring with the 1H ramp (à la BASS-SD). However, given the high powers (160 kHz), a quick calculation confirms that the relative power for the CP match conditions should not be notably different due to the few kHz offset. In fact, arrays of the 13C power level without ramps (rectangle to rectangle) confirm the C–H selectivity is a 13C driven phenomenon, with the C–HN and C–Hα transfers happening at slightly different carbon spin lock fields.
Having thoroughly explored the parameter space for the long-range 13C–1H CP, we concluded that additional proton on the Cα was preventing longer range peaks from being observed. To support this hypothesis of ‘dipolar truncation’ we turned to spin physics simulations using the program Spinach (Hogben et al. 2011). We chose the V54-N8 hydrogen bond as observed in Fig. 2 and 3 as our test case. Fig. S5 shows the CP build ups for V54CO and T55Cα to N8 HN in the presence of T55Hα and HN. The build-up for the CO–HN peak is 10 × stronger than the Cα–HN cross peak, despite being less than 1 Å closer. The rapid transfer of magnetization from the Cα to the attached Hα (100 × stronger than the long-range HN at 1 ms) hinders the transfer of magnetization to the more interesting long-range peak, N8. While the long-range hydrogen bonding interaction simulated here had reasonable build up rates (Fig. S5a), it is also clear that the buildup is much faster for the nearby T55Hα and T55HN protons (Fig. S5b and c). This leads us to the second mechanism we propose for the appearance of long-distance cross peaks: spin diffusion. We are using the generic term spin diffusion to describe what might be an active (HORROR style) 1H–1H recoupling during the final CP step, or a passive 1H–1H mediated mixing during the time spent on the Z-axis during the MISSISSIPPI solvent suppression. Thus, for spin systems like V39 (Fig. 5c, 7) with strongly coupled proton networks, we observe the long-distance V39Cα-Hγ1/2 cross peaks as the strongest in the spectrum as well as V39Cα-D40Hβ2/3 and even V39Cα-E56Hγ, a distance of 8 Å, while no corresponding peaks to the neighboring G38, which lacks a large protonated sidechain, are seen. Others have shown that these tight aliphatic-aliphatic contacts could be useful in the context of protein structure determination, especially with the use of a 4th dimension to help resolve ambiguity in the second proton dimension (Huber et al. 2011).
Fig. 7
Structural representation of V39Cα contacts. Oxygen, Nitrogen and carbon atoms are represented in gray, blue and white respectively. V39Cα atom is depicted with a mauve sphere. Observed hydrogen atoms are depicted with red spheres. Tan spheres depict other neighboring protons not observed at 6 Å
Comments (0)