
Remember me


Fetal membranes were collected after elective cesarean deliveries (n = 5). Written patient consent and ethical approval were obtained before tissue collection, in accordance with the guidelines of the Ethics Committee of the National Institute of Perinatology, protocol 21081. Women with uncomplicated term pregnancies (37–40 weeks), who had not experience labor activation or premature rupture of membranes, were included in this study. No evidence of microbiological signs of chorioamnionitis or lower genital tract infection was found in the fetal membranes.
Mechanical isolation and sterile pre-processing of hAECThe human amniotic membrane (amnion) was mechanically detached from the chorion and placed in a container with 0.9% saline. Under aseptic conditions, the tissue was rinsed several times with saline solution to remove blood and clots. The amnion was then spread on a plastic table using forceps and wiped with gauze pads soaked in saline to clear any remaining debris.
Culture of hAECSubsequently, the tissue was processed following previously described methods (Avila-Gonzalez et al. 2019; Garcia-Castro et al. 2015; Garcia-Lopez et al. 2019; Romero-Reyes et al. 2021). Briefly, the amnion was placed in 10 ml of 0.5 mM ethylene glycol-bis(2-aminoethylether)-N,N,N′,N′-tetraacetic acid (EGTA; Sigma-Aldrich, Merck Group, Burlington, Massachusetts, USA; E3889) solution and shaken by inversion for 30 s, followed by incubation in 15 ml of 0.5 mM EGTA solution at 37 °C for 10 min (these two digestions were discarded).
The tissue was then incubated twice in 25 ml of the 0.05% trypsin–EDTA solution for 40 min at 37 °C. Trypsin activity from these two digestions was inactivated with two volumes of culture medium (DMEM medium (Gibco, Thermo Fischer Scientific, Grand Island, New York, USA; 12100046) supplemented with 10% Fetal Bovine Serum Certified (FBS, Gibco 16000-044). Both digestions were centrifuged at 200 × g at 4 °C for 10 min. hAEC were cultivated at a density of 3 × 10⁴ cells/cm2 in standard culture medium (DMEM supplemented with 10% FBS, 1% non-essentials amino acid 100× (Gibco 11140-050), 1% sodium pyruvate 100 mM (Gibco 11360-070), 1% antibiotic–antimycotic 100× (Gibco 15240062), and 500 μl β-mercaptoethanol 55 mM (Gibco 21985-023)) with 10 ng/ml human recombinant epidermal growth factor (EGF) and incubated at 37 °C in normoxic conditions (5% CO2, 95% air) in a humidified incubator. The medium was changed every three days and supplemented with 10 ng/ml EGF daily until 80% confluence was reached.
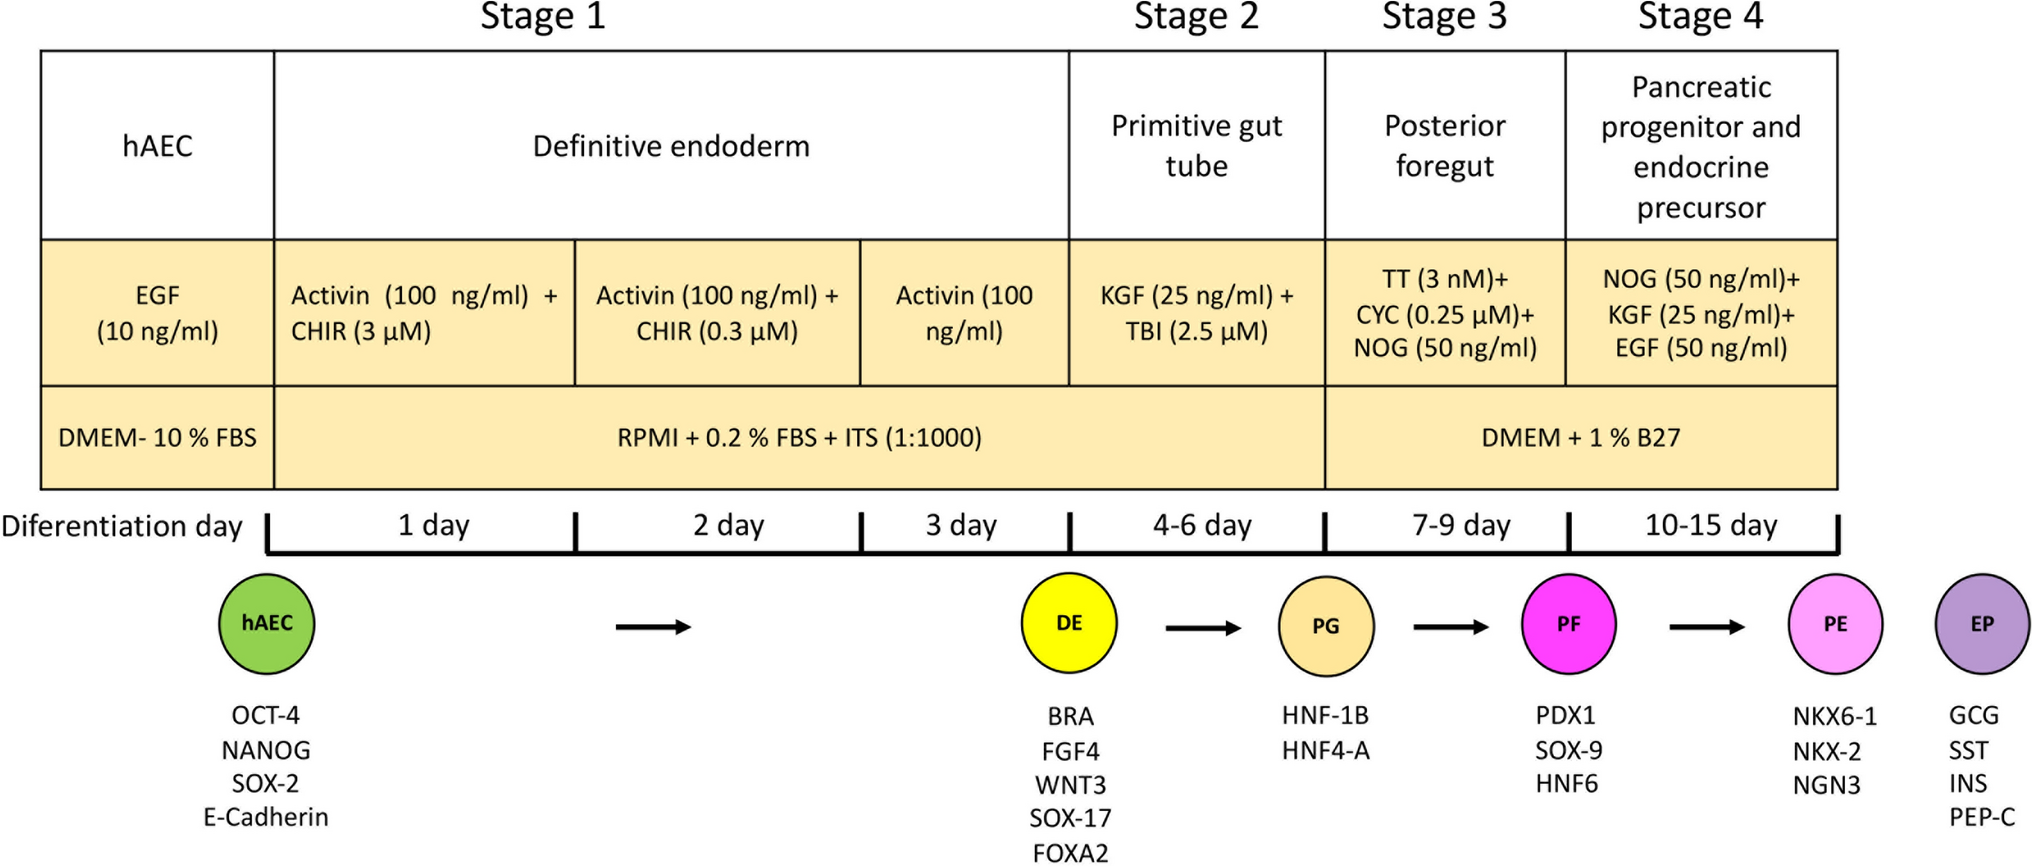
In vitro differentiation of hAEC to insulin-producing β-like cellsThe differentiation of hAEC into insulin-producing β-like cells was performed using a four-stage protocol adapted from the literature (D’Amour et al. 2006; Schulz et al. 2012).
Stage 1: To induce definitive endoderm, hAECs were cultured at a density of 3 × 10⁴ cells/cm2 in RPMI medium (Gibco 1640) supplemented with 0.2% FBS, ITS (1:1000; Gibco 41400-045), 100 ng/ml activin A (PeproTech, Thermo Fischer Scientific; 120-14E), and 3 μM CHIR99021 (R&D System; Minnesota, USA; 4423/50) for 1 day. The following day, the medium was replaced with fresh RPMI supplemented with 100 ng/ml activin A and 0.3 μM CHIR99021 for an additional day.
Stage 2: To induce primitive gut tube formation, the hAEC were cultured in RPMI medium supplemented with 25 ng/ml keratinocyte growth factor (KGF) (PeproTech 100-19) and 2.5 µM TGF-β RI kinase inhibitor IV (TBI). The medium was changed every 3 days, with fresh KGF and TBI added daily.
Stage 3: For posterior foregut induction, the cells were cultured in 1% B27 (Gibco 17504-044)/DMEM (Gibco 12100061) medium (1× GlutaMax 100× (Gibco 35050-061), 1% penicillin–streptomycin (Gibco 15140-148)) supplemented with 3 nM TTNPB (TT; TOCRIS bioscience 07-611-0), 0.25 µM cyclopamine (CYC; Sigma C4116), and 50 ng/ml Noggin (NOG; PeproTech 120-10C). The medium was changed every 3 days with TT, CYC, and NOG added daily.
Stage 4: To induce pancreatic progenitor and endocrine precursor cells, hAEC were cultured in 1% B27/DMEM medium supplemented with 50 ng/ml NOG, 25 ng/ml KGF, and 50 ng/ml EGF. The medium was changed every 3 days, with the addition of NOG, KGF, and EGF daily for 6 days (Fig. 1).
Fig. 1
Schematic of four-stage differentiation protocol from human amniotic epithelial cells (hAEC) into definitive endoderm, primitive gut tube, posterior foregut, and mixed population comprising pancreatic endoderm and endocrine precursor cells
At the end of each stage, hAECs were processed according to their subsequent use.
RNA extractionThe phenol–chloroform method was used for RNA extraction. Trizol (100 μl; Thermo Fischer Scientific) was added to hAEC at the end of each stage and kept at room temperature for 5 min. Then, 16.65 μl of chloroform was added, vortexed for 15 s, and incubated for 3 min at room temperature. Samples were centrifuged at 13,000 rpm for 10 min at 4 °C. The aqueous phase was extracted and transferred to a new tube. Isopropanol was added in a volume equal to that of the aqueous phase, mixed by inversion, incubated at − 20 °C for 5 min (to precipitate the RNA), and centrifuged at 13,000 rpm for 10 min at 4 °C. The supernatant was carefully removed and the pellet was dried for 10 min on sterile gauze. The pellet was resuspended in 40 μl of RNases-free water. RNA concentration and purity were measured by spectrophotometry (NanoDrop One; Thermo Fischer Scientific, 260 and 280 nm, path length 1 mm).
Purification of RNA with ethanolFor further RNA purification, 1 μl of sodium acetate (3 M, pH 5.2) was added to every 10 μl of RNA. Three volumes of chilled absolute ethanol were added, mixed by inversion 50 times, incubated at − 80 °C for 30 min, and centrifuged at 17,800 × g for 25 min at 4 °C. The supernatant was discarded and the pellet was washed with 1 ml of 70% ethanol, centrifuged at 17,800 × g for 5 min at room temperature, and dried for 10 min. The pellet was resuspended in 20 μl of RNases-free water. The RNA was quantified by spectrophotometry and stored at − 80 °C.
End-point RT-PCRComplementary DNA (cDNA) was synthesized using the reverse transcription system (Promega Corporation, Madison, Wisconsin, USA; A3500). A total of 800 ng of RNA was mixed with 5 mM MgCl2, 1× reverse transcription buffer (10 mM Tris-HCl, pH 9.0), 50 mM KCl, 1 mM dNTP, recombinant RNase inhibitor (1 u/μl), AMV reverse transcriptase (15 u/μg), oligo(dT) primer (0.5 μg). The reaction mixture was incubated at 42 °C for 60 min, then at 95 °C for 5 min, and finally at 4 °C for 5 min using a Mastercycler (Eppendorf Corporate, Hamburg, Germany).
Subsequent PCR was performed using the GoTaq system (Promega M8295) according to the manufacturer’s specifications. For this, 500 ng of cDNA was used in a reaction with a final volume of 50 μl (cDNA, 200 uM dNTPs, 2 mM MgCl2, 1× buffer, 50 pmol of specific forward and reverse primers, and 2.5 U of DNA polymerase). The sequences of the specific primer pairs for each gene are listed in Table 1. The amplification conditions were as follows: denaturalization 95 °C for 1 min, annealing at 55–61 °C (depending on gene) for 1 min, elongation at 72 °C for 1 min and final extension at 74 °C for 10 min, followed by cooling to 4 °C. For somatostatin, glucagon, and insulin, a pre-amplification of 15 cycles was performed. A total of 30–35 cycles were conducted and PCR products were analyzed by agarose gel electrophoresis. Products were stained with Gelred (Biotium, Fremont, California, USA; 41003) and size was determined by comparison with a molecular weight standard (100 bp DNA Ladder, Promega G210A). Negative controls without cDNA were included for PCR amplification.
Table 1 Primer sequences and RT-PCR amplification conditionsImmunofluorescencehAEC at each stage were fixed with 4% paraformaldehyde solution for 20 min and permeabilized with 0.3% Triton X-100/ PBS (Sigma-Aldrich, X100) for 45 min. Cells were then incubated with 5% bovine serum albumin (Sigma-Aldrich, A7906) to block non-specific epitopes for 45 min. Subsequently, hAEC were incubated with stage-specific primary antibodies.
Primary antibodies specific to BRACH, FGF4, WNT3, SOX-17, and FOXA2 were used to identify the formation of definitive endoderm in stage 1; HNF-1B and HNF-4A for primitive gut tube identification in stage 2; PDX-1 and SOX-9 for posterior foregut in stage 3; and NKX-6-1, NKX-2, glucagon (GCG), insulin (INS), and C-peptide (C-PEP) to identify pancreatic progenitor and endocrine precursor of stage 4 (Table 2).
Table 2 List of antibodiesPrimary antibodies were incubated overnight at 4 °C, followed by incubation with appropriate fluorescently labeled secondary antibodies; Alexa Fluor® 488 goat anti-rabbit IgG (H + L) (Invitrogen, Thermo Fischer Scientific; A11034) or Alexa Fluor® 568 goat anti-mouse IgG (H + L) (Invitrogen, Thermo Fischer Scientific; A11004) for 2 h at room temperature. Finally, cell nuclei were counterstained with 0.2 µg/ml−1 4′,6-diamidino-2-phenylindole (DAPI) (Invitrogen, Thermo Fischer Scientific; D1306). Secondary antibody background was assessed by primary antibody omission; no autofluorescence or non-specific signal was detected under the imaging conditions and as positive control for INS and C-PEP, human pancreas tissue was used (GeneTex, San Antonio, Texas, USA; GTX24611).
Microscopy and image acquisitionImages were collected on an epifluorescence microscope (Olympus IX-81, Olympus Corporation, Tokyo, Japan) equipped with a sCMOS camera (Hamamatsu, ORCA-Flash 2.8, Hamamatsu Photonics, Tokyo, Japan). Objective lens was LUCPlanFL 20X/0.45 NA Ph1 ∞/0–2/FN 22. Exposure time was 250 ms; camera gain was 1.2 e− ADU−1. All images were acquired at 1920 × 1440 pixels (0.18 μm pixel−1) and saved as 16-bit TIFF. Single band filter cubes were used: DAPI (exc 365 nm/10; em 445/50 nm), FITC/Alexa 488 (exc 470/40 nm; em 525/50 nm), and Cy3/Alexa 568 (exc 575/25 nm; em 610/60 nm). Multi-fluorescence images were acquired sequentially (channel-by-channel) with automatic filter-wheel switching to prevent spectral bleed-through. Lamp intensity was kept constant within each experiment.
Cell countingAt the end of each stage of the differentiation protocol, photomicrographs were captured and the number of cells positive for the stage-specific marker was assessed in nine randomly selected fields at ×200 magnification across five independent experiments. Merged images were generated using Adobe Photoshop 2024 software. The total cell count was determined by counting the DAPI-stained nuclei and the percentage of marker-positive cells was calculated using the following equation: % of positive cells = (number of single or double marker-positive cells × 100/(total number of DAPI-positive nuclei).
Comments (0)