
Remember me

Tpm4.2−/− mice were designed as a homozygous knock-out of exon 1b of Tpm4.2 using the C57BL/6 J mouse strain as described in [6]. Mice were genotyped by using isopropanol-precipitated DNA from tail biopsies as a template for polymerase chain reaction (PCR), using the following primers Tpm4.2 knock-out forward primer: 5′-GTGACCTCATGGGCCTGAC-3′ and Tpm4.2 knock-out reverse primer: 5′-GGACGAAAAGTGGGATCG-3′. Deletion of Tpm4.2 protein was further confirmed by Western blotting in previous studies [6] and in Fig. S8. All procedures involving animals were approved by the UNSW and Macquarie University Animal Care and Ethics Committees and conducted in accordance with national and international guidelines.
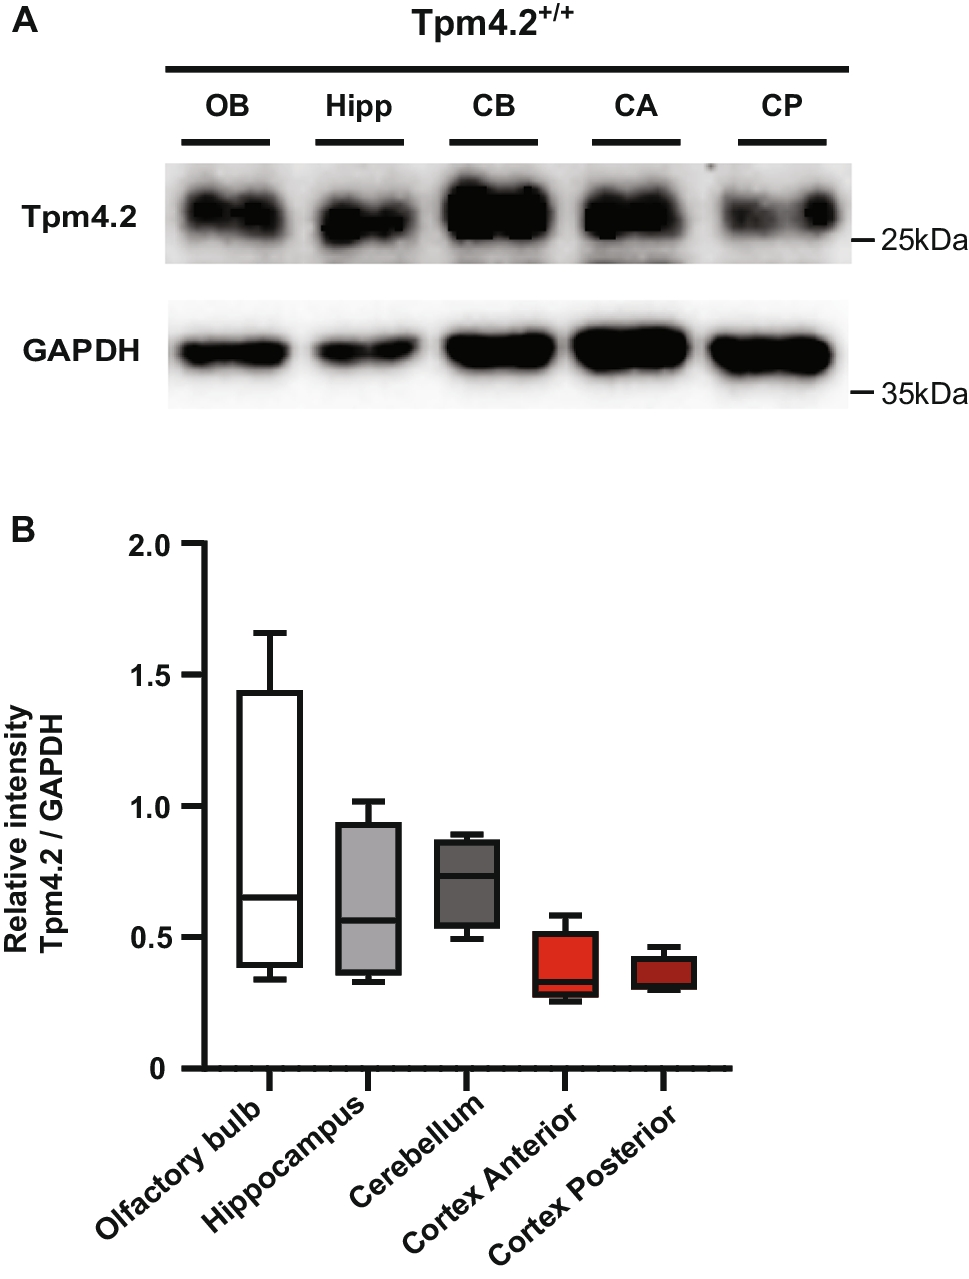
Characterization of Tpm4.2−/− MicePerfusion and Tissue CollectionTo confirm the complete knock-out of Tpm4.2, Tpm4.2−/− and Tpm4.2+/+ control mice were euthanized and transcardially perfused with 1 × phosphate buffered saline (PBS) and their brains harvested. Brains were sagittally sectioned into two halves along the midline, and one-half was immediately snap frozen in liquid nitrogen and later stored at − 80 °C for downstream molecular studies.
Western BlotSnap frozen half brain tissues were lysed with ice-cold radioimmunoprecipitation assay (RIPA) lysis and extraction buffer (20 mM Tris pH 8.0, 1% Nonidet P-40, 0.25% sodium deoxycholate, 0.1% sodium dodecyl sulfate, 150 mM sodium chloride, 5 mM ethylenediaminetetraacetic acid, 30 mM sodium fluoride, 60 mM β-glycerophosphate, 20 mM sodium pyrophosphate, 1 mM sodium orthovanadate, 1 mM dithiothreitol, 1 × protease inhibitor, and Milli-Q water). In brief, tissues were thawed upon addition of RIPA buffer followed by sonication at 1 pulse/s with 20% amp in a probe sonicator for 30 s and then centrifuged at 14,000 rpm for 10 min at 4 °C. The supernatants were collected, and bicinchoninic acid assay was performed for protein quantification using Pierce BCA Protein Assay Kit (Thermo Scientific, Cat No. 23225). 12.5 µg or 10 µg of total protein from brain tissue lysates was loaded onto 12.5% SDS–polyacrylamide gels for brain region–specific expression and Tpm isoform compensation analysis, respectively. Electrophoresis was run at 80 V for 20 min through the 4% stacking gel, before 120 V for 2.5 h through the 12.5% resolving gel. Resolved proteins were then transferred onto methanol activated polyvinylidene difluoride membrane (Merck Millpore) using a Bio-Rad Trans-blot Turbo transfer system and chilled transfer buffer containing 10% Tris–Glycine SDS buffer (10 ×), 20% methanol in Milli-Q water. Membranes were then blocked with 5% skim milk in Tris-buffered saline with 0.1% Tween 20 (TBST) on the rocker for 2 h at room temperature followed by incubation with primary antibodies diluted in blocking buffer (rabbit polyclonal anti-tropomyosin 4.2 (Gift from Peter Gunning, 1:2000) for 3 h in 2.5% blocking buffer at room temperature; mouse anti-Tpm3.1/2 (2G10.2, 1:250 Gift from Peter Gunning); mouse anti-total Tpm3 (CG3, 1:250); and mouse anti-Tpm1.10/12 (clone 5–54, 1:250) in 5% blocking buffer and overnight incubation at 4 °C on rocker) [45]. After four washes with TBST (5 min each at room temperature), the blots were incubated with the respective secondary antibodies (1:5000 in their respective blocking buffer) for 1.5 h at room temperature on rocker before washing again four times with TBST (5 min each). Next, the blots were developed with Crescendo substrate (Millipore) and visualized using ChemiDoc imaging system (Bio-Rad). All blots were subsequently probed with glyceraldehyde 3-phosphate dehydrogenase (GAPDH) housekeeping gene (Merck-Millipore; Cat No. MAB374) (1:5000 for Tpm4.2 blot and 1:1000 for all other blots) and imaged to obtain the corresponding loading controls. The western blots were quantified using ImageJ software (NIH). Uncropped Western blot images are provided in Figs. S8, S9 and S10.
All values are expressed as mean ± SEM (standard error of mean) and were subjected to unpaired t-test using GraphPad Prism (Version 8.3). Significance (if found) was indicated as p < 0.05.
Primary Culture of Mouse Hippocampal NeuronsMouse primary hippocampal neurons were cultured from embryonal day 16.5 (E16.5) from Tpm4.2+/+ and Tpm4.2−/− mice with C57BL/6 J background as previously described [46]. In brief, brains were removed from E16.5 mouse embryos and placed in Hanks buffered salt solution (HBSS; Sigma). Meninges were removed and hippocampi extracted using microclippers. A 1:100 dilution of Trypsin (Sigma-Aldrich) was then added to hippocampi and incubated at 37 °C for 20 min. Deoxyribonuclease I 1:100 final concentration of 0.1 mg/mL (Sigma) was added for 30 s before washing twice with 10 mL of DMEM (Life Technologies, Berkley, CA, USA) with 10% fetal bovine serum (FBS, Thermo Fisher Scientific) to remove DNAse I. Hippocampi were then dissociated by trituration with 1 mL DMEM/10% FBS using fire-polished, serum-coated Pasteur pipettes. Cells for receptor recycling assay and calcium imaging of live neurons were then plated on poly-D-lysine (PDL; Sigma)-coated 1.5-mm glass coverslips at a density of 70,000 cells per well in a 24-well plate and incubated at 37 °C and 5% CO2 for 2 h in DMEM/10% FBS. Media were then changed to Neurobasal medium (NBM; Neurobasal, Life Technologies; supplemented with 2% B27, Life Technologies, and 0.25% GlutaMAX, Invitrogen).
Receptor Internalization AssayNeuron TreatmentPrimary hippocampal neurons were seeded at 70,000 per well on 1.5 mm, PDL-coated glass coverslips and incubated in NBM at 37 °C with 5% CO2 for 18 days. An assay to induce receptor internalization was performed as previously described [47] with the following modifications—80% of culture media was removed and neurons either left untreated, incubated with extracellular solution (ECS; 150 mM NaCl, 2 mM CaCl2, 5 mM KCL, 10 mM HEPES (pH 7.4), and 30 mM glucose in dH2O), 25 μM NMDA in ECS, 100 M glycine in ECS, or 25 M bicuculline in ECS for 30 min at 37 °C with 5% CO2. Incubation solutions were then aspirated and replaced with original cell culture medium and re-incubated for 60 min before fixing for 5 min in 4% PFA.
Surface and Total GluA1 Receptor ProbingHalf of the neurons were then probed for surface GluA1 receptors only by blocking for 1 h at RT in blocking buffer (2% FBS (Sigma) in PBS) followed by incubation for 60 min with mouse N-terminal anti-GluA1 (1:250 in BB; Merck-Millipore MAB2263) diluted in blocking buffer. Surface-probed neurons are then washed in PBS and fixed with 4% PFA for 5 min, permeabilized with 0.1% Triton-X in PBS for 5 min at RT with PBS wash steps in between each. The remaining half of the neurons are probed for total GluA1 receptors by permeabilizing with 0.1% Triton-X in PBS for 5 min at RT, washing in PBS, blocking for 60 min in BB before incubation with 1:150 mouse anti-GluA1 at RT for 60 min. All neurons are then washed, blocked for 60 min in blocking solution, and incubated with Chicken anti-MAP2 (1:500 in blocking buffer; Abcam ab5392) for 4 °C overnight. All neurons are then washed and incubated for 60 min with donkey anti-mouse AlexaFluor-555 (1:500 Life Technologies in BB) for GluA1, goat anti-chicken AlexaFluor-647 (1:500; Life Technologies in BB) for MAP2. Secondary antibodies are then washed off in PBS before incubation with phalloidin 488 (1:100 in PBS, Thermo Fisher Scientific) and DAPI (1:1000, Life Technologies) for 20 min at RT. Neurons are then washed in PBS, dipped in H2O, and mounted onto glass slides with Fluoromount G (Thermo Fisher Scientific).
Imaging and Analysis Receptor InternalizationSlides were imaged on a Zeiss AxioImager, using a 63 × oil objective. Neurons were stitched, exported as uncompressed.Tif files, and analyzed on FIJI (ImageJ). Relative intensity was measured for three dendrites per neuron and ten neurons per condition, maintaining a consistent distance away from the soma (5 M) and measurement area (15 µM2) and normalized to background intensity. Ratios of surface to total GluA1 intensity were measured, and the ratio was compared between groups using GraphPad Prism software (version 10.2).
Plasmid Production and CloningFor calcium imaging of live neurons, we used a the green fluorescent protein (GFP)–based GCaMP sensor protein with fast kinetics jGCaMP7f as previously characterized [48] and inserted it into an AAV vector containing a PhP.B capsid, human synapsin promoter, and woodchuck hepatitis virus post-transcriptional regulatory element (WPRE), flanked by AAV inverted terminal repeats (ITRs). NEBuilder Hifi DNA Assembly Master Mix was used to clone plasmids (E2621L, New England Biolabs, MA, USA). DNA fragments were amplified by PCR, and 0.06 pmol was combined with 0.06 pmol of digested vector fragments, 5 µL of water, and 5 µL of NEBuilder DNA Assembly Master Mix. The mixture was incubated for 1 h at 50 °C before 5 µL was added into 50 µL of One Shot Stbl3 Chemically Competent E. coli (C737303, Thermo Fisher Scientific, MA, USA) and incubated on ice for 30 min, heat-shocked at 42 °C for 45 s, and then placed back on ice for a further 2 min. Transformed bacteria were then mixed with 200 µL of SOC Outgrowth Medium (B9035, New England Biolabs, MA, USA), incubated with 300-rpm shaking for 1 h at 37 °C, and plated on agar plates with 1:1000 ampicillin. Plates were then incubated at 37 °C overnight.
For each construct, a pipette tip was used to pick five distinct colonies from each agar plate and added to LB broth (0.5% yeast [Sigma-Aldrich, MO, USA], 1% tryptone [G-Biosciences, New Delhi, India] and 1% NaCl [Sigma-Aldrich, MO, USA]). DNA was then extracted from bacterial culture using Wizard Plus SV Miniprep Purification System (Promega, WI, USA), as per manufacturer’s protocol. In brief, the culture was pelleted for 5 min, before resuspension in 250 µL of cell resuspension solution. Ten microliters of alkaline protease solution was then added and the mixture incubated for 5 min at room temperature before neutralization with 350 µL of neutralization solution. The mixture was centrifuged (10 min at room temperature, 21,000 g) and the supernatant transferred to the spin column placed in a collection tube and centrifuged (21,000 g for 1 min at room temperature). Flowthrough was discarded, and the bound DNA was washed with 750 µL of wash solution spun (centrifuged for 1 min at room temperature, 21,000 g). The wash step was repeated with 250 µL of wash solution. The spin column was transferred to a sterile 1.5-mL microcentrifuge tube, and the DNA was eluted by incubating the spin column membrane with 50 µL of nuclease-free water for 2 min at room temperature, followed by centrifuging for 1 min at room temperature.
PureLink HiPure Plasmid Maxiprep Kit (Thermo Fisher Scientific, MA, USA) was used to obtain larger DNA amounts. Bacteria were grown in 4 mL of LB Broth (1:1000 ampicillin) for 8 h, before expansion to 250 mL LB Broth (1:1000 ampicillin) overnight. Overnight culture was spun at room temperature for 10 min at 4000 g and the pellet resuspended in 10 mL of resuspension buffer with RNase A. Ten milliliters of lysis buffer was then added to the cells, mixed by inversion, and incubated for 5 min at room temperature. Ten milliliters of precipitation buffer was then added, and the mixture centrifuged at 12,000 g for 30 min at room temperature. Supernatant was loaded onto the previously equilibrated column and drained by gravity flow. The column was washed with 60 mL of wash buffer and drained by gravity flow. Fifteen milliliters of elution buffer was then added to the column to elute DNA using gravity flow. The DNA was mixed well with 10.5 mL of isopropanol and centrifuged at 12,000 g for 30 min at 4 °C. Supernatant was removed, and the pellet resuspended in 5 mL of 70% ethanol, followed by centrifugation at 12,000 g for 10 min at 4 °C. Supernatant was discarded, and the pellet was left to air-dry for 10 min. The DNA was resuspended in 300 µL of nuclease-free water and used for adeno-associated virus production.
Production of Adeno-Associated Virus for Neuron TransductionGCamp7f-eGFP, Tpm4.2-mRuby2, and Tpm4.2-IRES-mRuby2 were packaged into PHP.B capsids, and adeno-associated viruses were produced as previously described [47]. In brief, HEK293T cells were grown to 70–80% confluency in DMEM/10% FBS before replacement with Iscove-modified Dulbecco medium (Sigma) + 5% FBS 3 h prior to transfection with polyethyleneimine-Max (PEI-max, Polysciences) containing pF0delta06 and AAV-PHP.B plasmid with rep and cap sequences.
Calcium Imaging of Live NeuronsPrimary hippocampal neurons for calcium imaging of live neurons were seeded at 70,000 on 1.5-mm PDL-coated glass coverslips. Neurons were transduced with 1 × 10¹² vg/coverslip of AAV-PHP.B jGCamp7f and incubated at 37 °C with 5% CO2 for 20 DIV. At each timepoint, cells were imaged at 37 °C with 5% CO2 on an Axio Observer 7 Live cell imager (Carl Zeiss, Germany) at 5 × magnification for 5 min with 500-ms intervals.
A somatic region of interest (ROI) was drawn for each active neuron in FIJI [49], and the fluorescent time series for each ROI within the field of view (FOV) was saved as a table. Time series were analyzed using custom MATLAB (version R2024b, MathWorks) routines adapted from previously published in vitro calcium image analysis pipelines [50, 51]. Normalized fluorescence intensity (DF/F) was extracted using the getDFF function in CaPTure [51] with tau [2 50]. Peaks and their locations were identified using the MATLAB findpeaks function (“MinPeakHeight” = 0.01 DF/F, “MinPeakDistance” = 4 timepoints). To quantify the synchronous activity, the normalized fluorescence intensity for each ROI within a FOV was averaged and the peaks of the average intensity timeseries were extracted as described above. For each cell, we quantified the average calcium event amplitude and event frequency. These values were then aggregated by FOV. To account for the hierarchical structure of the data (multiple cells nested within each FOV), we performed a nested t-test using GraphPad Prism (GraphPad Software, La Jolla, USA), treating FOVs as the unit of replication and cells as nested observations. This approach allowed us to assess group-level differences in calcium responses while accounting for the non-independence of cells within the same FOV.
ElectrophysiologyWhole Cell Patch Clamping of Primary Neurons in Dissociated CulturesPrimary hippocampal neurons were seeded at 70,000/well in a 24-well plate onto 1.5-mm PDL-coated coverslips and incubated in NBM at 37 °C and 5% CO2. At 17 and 18 DIV, coverslips were transferred to the recording bath on a Leica DM IL inverted microscope, which was perfused with extracellular solution (110 mM NaCl, 10 mM HEPES, 10 mM glucose, 2 mM CaCl2, 0.8 mM MgCl2, 5 mM KCl) at room temperature using a peristaltic pump (Minipuls 3, Gilson, France). After a cell was patched, the perfusion was switched to a separate 20-mL aliquot of 0.5 µM TTX and 100 µM picrotoxin. Patch electrodes were made from glass capillaries 1.2 mm OD, 0.94 ID, 100 length (Harvard Apparatus), pulled using a Narishige Model PC-10 microelectrode puller to a tip resistance of 3–5 MΩ. Electrodes were filled with internal solution (110 mM cesium methane sulfonate, 8 mM NaCl, 10 mM HEPES, 2 mM Mg2ATP, 0.3 mM Na3GTP, 0.1 mM spermine tetrahydrochloride, 7 mM phosphocreatine, 10 mM EGTA, 5 mM CsCl) with 50 µM Alexa Fluor 594, filtered through a 0.22-µm syringe-driven filter unit (Millex). Recordings of mEPSCs were made at a holding potential of − 70 mV with an Axopatch 200B amplifier, filtered at 2 kHz, digitized at 5 kHz with a Digidata 1440 A, and saved with Clampex 10.2 (Molecular Devices, USA).
mEPSC Analysis in Primary Neurons of Dissociated CulturesmEPSCs were detected and measured using Axograph (Sydney, Australia). A notch filter (49.9–50.1 Hz) was applied, and an event template (maximum 0.5-ms rise time, 3-ms minimum decay time) was used to detect mEPSC [52]. Events outside of 5–150 pA were excluded, and detected events were manually verified. Event amplitude and inter-event interval were measured. Either the first 1000 events or 5 min of activity were analyzed from each cell, as there was a large variability in activity frequency.
Changes of Field Potential Recording in Brain SlicesAll animal studies were carried out in accordance with the New South Wales Animal Research Act and Regulation and approved by the Animal Ethics Committee of UNSW Sydney under ethics protocol numbers 14/113A and 18/37B. Mice were housed in a temperature-controlled facility (22–24 °C) on a 12-h light–dark cycle. For all experiments, mice of both sexes were used at 6–8 weeks old. Data collection was performed blind to genotype and interspersed so no more than two animals of the same genotype were used on consecutive days.
Mice were anesthetized by open-drop exposure to isoflurane in an induction chamber before decapitation, and the brain was removed and placed in ice-cold modified artificial cerebrospinal fluid (ACSF; 124 mM sucrose, 62.6 mM NaCl, 2.5 mM KCl, 26 mM NaHCO3, 1.2 mM NaH2PO4, 10 mM glucose, 0.5 mM CaCl2, and 3.3 mM MgCl2). The brain was hemisected and immersed in cold modified ACSF. Horizontal slices (400 µm) were cut using a vibratome (model VT1200, Leica, Wetzlar, Germany) at room temperature. The solution containing the brain slices was continuously infused with 95% O2/5% CO2. Slices were left to recover for at least 1 h before recording. Slices were used within 7 h of cutting, corresponding to the optimal period of slice health [53].
Slices were transferred individually to the tissue recording system (Kerr Scientific Instruments, Christchurch, New Zealand) and continuously perfused with standard ACSF at room temperature. A bipolar, Teflon-coated tungsten stimulating electrode (Kerr Scientific Instruments) was placed in the stratum radiatum, aligned to the end of the dentate gyrus, and the recording electrode was placed approximately 800 µm from the stimulating electrode. Stimuli were delivered via an isolated stimulator (model DS2, Digitimer, Hertfordshire, England, or A-M Systems, Model 2200, WA, USA), triggered through a Powerlab (model 4/2ST, AD Instruments, Sydney, Australia) or multifunctional data acquisition card (National Instruments NI PCI-6221, USA or Data Translation DT9816; USA). Field potentials were amplified at 100 × using a KSI Tissue Recording System Amplifier (Kerr Scientific Instruments, Christchurch, New Zealand) and digitized with the Powerlab or multifunctional data acquisition card. Traces were acquired using Scope (AD Instruments, Sydney, Australia), AxoGraph X (Axograph Scientific) or custom software. To determine the optimal electrode positions, stimuli (15–20 V 100 µs) were delivered every 8–10 s, and electrodes were lowered until an extracellular field excitatory synaptic potential (fEPSP) was observed. The depth of the recording and stimulating electrodes was then adjusted to produce the largest response. After finding the optimal electrode position, the stimulus frequency was reduced to once every 30 s and left to stabilize for 10 min. A stimulus response curve was then conducted by varying the stimulus intensity from 5 to 70 V. Slices were discarded if the maximum fEPSP amplitude was below 0.6 mV, as the small response was considered to be a marker of poor health. The stimulus intensity eliciting 50% of the maximum amplitude was identified, and field potentials were evoked in pairs with a 50-ms interval at this stimulus intensity at 30-s intervals. After obtaining a stable baseline for 20–30 min, LTP was induced with two bursts of high-frequency stimulation (100 Hz 1 s). For LTD experiments, LTD was induced with 900 paired pulses (50-ms interval) at 1 Hz. Responses were then recorded for the following 60 min.
Electrophysiological data were analyzed offline using AxoGraph (Sydney, Australia). Measures included the fiber volley amplitude, the fEPSP slope, and the paired pulse ratio. Fiber volley amplitude was defined as the amplitude of the negative peak preceding the fEPSP. The fiber volley amplitude is indicative of the number of presynaptic axons activated by stimulation. The fEPSP slope was defined as the maximum slope during the initial 2.5 ms after the fiber volley. This was used to measure excitatory activity. Slope was measured instead of amplitude, as the amplitude can be contaminated by the population spike at higher stimulus amplitudes. The paired pulse ratio was calculated as the second fEPSP slope divided by the first, to give a measure of presynaptic transmitter release probability [54].
Statistical Analysis for ElectrophysiologyStatistical comparisons were performed using GraphPad Prism (GraphPad Software, La Jolla, USA). The D’Agostino and Pearson test was used to test data sets for normality. Differences between groups were tested using repeated measures ANOVA, paired t-test, unpaired t-test, Mann–Whitney test, or Kolmogorov–Smirnov test as indicated with α = 0.05. Data are presented as mean ± standard error of the mean. Data collection and analysis were performed blind to the genotype of the animals.
Neurite OutgrowthNeuron Plating and Transfection for Neurite Outgrowth AnalysisFor neurite growth experiments, primary hippocampal Tpm4.2+/+ and Tpm4.2−/− neurons were seeded at 70,000 cells/well in a 24-well plate containing PDL-coated 12-mm glass coverslips and cultured in 1 mL per well in complete NBM at 35 °C and 5% CO2.
For neurite tracing experiments, pEGFP-C1 plasmid (Clontech) was used for control neurons. Tpm4.2+/+ and Tpm4.2−/− neurons were transfected with pEGFP-C1 at 2 DIV with Lipofectamine 3000 (Thermo Fisher Scientific, MA, USA) by making a transfection mixture containing 0.5 µg of DNA and 1 µL of Lipofectamine 3000 in a total of 100-µL NBM per well of a 24-well plate. The transfection mixture was incubated with the cells for 90 min at 37 °C and 5% CO2 in 50% of the initial culture media volume (while the other 50% was collected before transfection procedure and kept at 37 °C). After incubation, the media was aspirated, and conditioned media were added to the cells.
Immunocytochemistry for Neurite Outgrowth AnalysisTwo days after transfection at 4 DIV, neurons were fixed with 4% paraformaldehyde (PFA) at room temperature for 15 min, washed in PBS, and permeabilized in 0.1% Triton-X (Sigma-Aldrich) for 5 min at room temperature. Neurons were then washed and blocked in BB (2% FBS in PBS) at room temperature for 1 h before incubation in the following primary antibodies diluted in BB-mouse anti-Tau1 (1:500 Millipore ab3420) and chicken anti-B3-tubulin (1:250, Millipore ab9354) overnight at 4°. The following day, primary antibody was washed off in PBS, and secondary antibodies donkey anti-mouse Alexa-555 and goat anti-chicken Alexa-647 (both 1:500, Life technologies) were diluted in BB and placed on neurons for 1 h at room temperature. Neurons were washed in PBS and mounted on glass microscope slides with Prolong Gold antifade reagent with DAPI (Life technologies).
Imaging of Neurite OutgrowthTpm4.2+/+ and Tpm4.2−/− mouse primary hippocampal neurons transfected with pEGFP-C1 were imaged using an Axio Imager upright fluorescent microscope fitted with a monochrome camera, with EC-Planachromatic Neofluar 40 × magnification objective (NA 0.75, WD 0.71 mm, Air immersion). Fluorescent illumination was obtained with a Xenon HXP lamp. The fluorescent filter sets used were BP450-490/BS495/BP500-550 (FS#38) for 488-nm channel, BP533-558/BS570/BP570-640 (FS#43) for 555-nm channel, and BP625-655/BS660/BP665-715 (FS#50) for 647-nm channel. At least 20 transfected neurons were imaged per single coverslip, and four coverslips per single experimental group were imaged per one biological replicate (80 imaged neurons per biological replicate in total—3 biological replicates). Images are representative of all three biological replicates.
Morphological and Statistical Analysis for Dendritic SpinesThe axonal compartment of Tpm4.2+/+ and Tpm4.2−/− neurons, transfected with pEGFP-C1 plasmid, was identified as tau1-positive/β3-tubulin-positive. The dendritic compartment was verified as tau1-negative/β3-tubulin-positive. For each experimental group, ~ 20 neurons (~ 5 neurons per coverslip) from 80 imaged neurons per biological replicate were chosen, using a random number generator (RNG). The images were processed in ImageJ (v.2.1.0). The morphological analysis of neurons was performed using the semiautomated approach in Neurolucida software (MBF Bioscience, VT, USA, v2019.1.1) to outline soma, axons, and dendrites. AutoNeuron workflow was used to initiate automatic tracing, followed by manual corrections, labeling, and branch ordering. To quantify traced axonal and dendritic compartments in Neurolucida, branched structure analysis and centrifugal Sholl analysis options in the Neurolucida Explorer package were used. Statistical analysis was performed in GraphPad Prism software (version 9.1.2). To determine if experimental groups have a normal Gaussian distribution, we performed Anderson–Darling, D’Agostino-Pearson, Shapiro–Wilk, and Kolmogorov–Smirnov normality tests. After these tests showed no Gaussian distribution within the experimental groups, the significance was determined with a non-parametric Mann–Whitney U test for Tpm4.2+/+ and Tpm4.2−/− neurons transfected with pEGFP-C1.
DiI Injection for Dendritic Spine AnalysisCells were fixed in 4% PFA for 15 min at room temperature and washed with PBS. The fixed coverslip was placed in a bath of PBS on a Leica DMIL microscope. A 1% solution of 1,1′-dioctadecyl-3,3,3′,3′-tetramethylindocarbocyanine perchlorate (DiI) in ethanol was loaded into a sharp microelectrode. The tip of the microelectrode was maneuvered into the target cell soma and left for 5 min to allow the dye to enter the cell. Sometimes, pressure was added to expel the DiI solution. Cells were randomly selected for injection.
Approximately ten cells per coverslip were injected. The coverslips were then left in 1 × PBS at 4 °C overnight, or at room temperature for 5 h to allow the DiI to diffuse into neuronal processes. The coverslips were then mounted with either Fluoromount or Prolong Gold and then sealed with nail polish the next morning before imaging.
Imaging of Dendritic Spine AnalysisImmunofluorescence images were taken using an LSM 710 confocal microscope (Zeiss) with a 63 × 1.4 NA oil immersion objective. DiI was excited with a 561-nm DPSS laser and emission captured at 519–673 nm. For dendritic spine morphology analysis, two 20-µm-length segments of secondary dendrites, 50–75 µm away from the cell soma, were selected from each transfected neuron. A Z-stack image with a 0.21-µm interval and 0.04 × 0.04 µm pixel size was acquired of each selected dendrite.
Deconvolution was performed on images using the DeconvolutionLab2 plugin in ImageJ [55]. Images were processed with five iterations of the Richardson-Lucy algorithm using a point spread function generated by Diffraction PSF 3D plugin (Optinav).
Spine QuantificationTo investigate whether Tpm4.2 deletion affects spine morphology, primary neuronal cultures were prepared from Tpm4.2+/+ and Tpm4.2−/− mice, fixed at 17–18 DIV, stained with DiI to assist labeling of entire cell membranes, and imaged. Fifty-one cells were analyzed for the Tpm4.2+/+ group, and 57 cells were analyzed for the Tpm4.2−/− group, from 3 separate culture preparations.
Spine morphology was analyzed according to Risher et al. [56]. Z-stack images were imported to RECONSTRUCT [57]. The length of the dendrite and the length and widths of spines were manually traced and measured. Measurements were copied to an Excel spreadsheet to calculate the spine density, average protrusion width, and average protrusion length for each cell that was imaged. Data were analyzed, and graphs were generated in GraphPad Prism. Data are given as mean ± SEM, unless otherwise indicated.
Mouse Housing for Behavioral AnalysisMale and female Tpm4.2−/− (n = 20) and Tpm+/+ mice (n = 25) littermates with C57BL/6 J background were transported at least 2 weeks prior to testing for habituation from Macquarie University and housed on arrival in the animal facility at the School of Medicine, Western Sydney University (Campbelltown Campus, Australia). Mice were housed in littermate groups separated for sex but not standardized for genotype to avoid the need to individually house test mice. Adult A/JArc mice were used in the social preference test to trigger explorative behavior of test mice. All animals were group housed (2–3/cage) in individually ventilated cages (Type Mouse Version 1; Airlaw, Smithfield, Australia; air change: 90–120 times per hour averaged; passive exhaust ventilation system), containing corn cob bedding, a mouse igloo (Bioserv, Frenchtown, USA), and a crinkle nest to provide nest building opportunities (Crink-l’Nest, Tecniplast, Australia). Mice were kept under 12:12 h (light phase: 0900–2100 h with white light at an illumination of 124 lx; dark phase: 2100–0900 h with red light at an illumination of less than 2 lx) and food and water ad libitum, with a temperature between 22 and 24 °C and humidity between 40 and 60 RH. Mice were 7 months old at the start of behavioral experiments. Research and animal care procedures were approved by the Western Sydney University Animal Care and Ethics Committee (approval number: A12918) and were in accordance with the Australian Code of Practice for the Care and Use of Animals for Scientific Purposes.
Behavioral PhenotypingFor habituation purposes, all test animals were transported to the testing room 30 min prior to behavioral testing, and all experiments were performed within the first 6 h of the light phase, with an inter-test interval of at least 48 h. All test equipment was cleaned after each trial with 80% ethanol solution. Tests were carried out in the following order: open field, novel object recognition, social preference test, elevated plus maze, prepulse inhibition, and fear conditioning. The sample size for each experimental test condition was n = 10–12.
Open field (OF)Locomotor activity, exploration, and anxiety-like behaviors were measured in the OF and were conducted as previously published from our laboratory [58, 59]. Mice were placed into the right corner of the OF chamber (43 × 43 cm; Activity Monitor, Med Associates Inc., Fairfax, USA) and allowed to explore the arena freely for 30 min. The arena was divided into a central and peripheral zone (MED software coordinates 3/3, 3/13, 13/3/, 13/13) with the central zone being a more aversive, anxiety-inducing zone of the open field [60]. Software settings for the detection of locomotion were box size, 3; ambulatory trigger, 2; resting delay, 1000 ms; and resolution, 100 ms. Time, horizontal (distance travelled), and vertical activity (rearing) in central and peripheral zones were measured by the chambers’ infrared photo beams. The ratio of central to total distance travelled (distance ratio) and time (time ratio) spent in the central area of the OF were taken as measures of anxiety.
Novel Object Recognition Test (NORT)The distinction between familiar and unfamiliar objects is an index of recognition memory and is measured by the innate preference of rodents for novel over familiar objects [61]. The protocol was adapted from a previous publication from our group [58]. The apparatus for NORT was a gray Perspex arena (35 × 35 × 30 cm), and the protocol ran over two consecutive days. On the first day, mice were habituated twice to the test chamber for 10 min and allowed to freely explore the empty arena, with an intertrial interval of 2 h. On the second day, mice were placed in the NORT arena with two identical objects (2 DUPLO® elephants or 2 blocks of DUPLO®) and allowed to explore the objects for 10 min. After a 15-min intertrial interval, mice were replaced in the arena with one familiar object and one novel object (LEGO® elephant + block of LEGO®) for 10 min. Object exploration was scored when mice exhibited nosing behavior towards the objects (i.e., when the mouse directed its snout towards an object at a distance of < 1 cm). Object recognition was reported as INDEX (time spent nosing the novel object expressed as a percentage of the time spent nosing the novel + familiar objects); the behavior was manually scored using ANY-maze™.
Social Preference Test (SPT)The SPT test was used to assess sociability and social novelty preference (i.e., social recognition memory) in test mice and was conducted as per a previous publication from our group [58]. The apparatus consists of three chambers, i.e., a central chamber (around 9 cm × 18 cm × 20 cm) and two outer chambers (around 16 cm × 18 cm × 20 cm). The dividing walls were made of clear Plexiglas, with square passages, 4 cm high and 4 cm wide. One circular cage (i.e., mouse enclosure) was placed into each outer chamber. The mouse enclosures were 15 cm in height with a diameter of 7 cm and bars spaced 0.5 cm apart to allow nose contact between mice but prevent fighting. The chambers and enclosures were cleaned in-between trials (intertrial interval of 2 min), and fresh bedding was added prior to each mouse. During the habituation trial, mice were placed individually in the central chamber and allowed to freely explore the apparatus and the two empty enclosures for 5 min. For the sociability test, an unfamiliar adult age-matched A/J mouse was placed in one of the two enclosures, while the experimental mouse was enclosed in the central chamber. Then, the test mouse was allowed to explore all three chambers for 10 min. Finally, test animals were observed in a 10-min social recognition test. For this, a second, unfamiliar A/J mouse was placed in the previously empty chamber so that the test mouse had the choice to explore either the familiar A/J mouse (from the previous trial) or the novel, unfamiliar mouse. AnyMazeTM tracking software was used to determine the time spent in the different chambers, number of entries, and distance travelled. In addition, time spent sniffing the opponent (i.e., A/J mouse) was recorded manually (i.e., snout of test mouse within the enclosure containing the opponent mouse or < 1 cm away from enclosure).
Elevated Plus Maze (EPM)The EPM represents the natural conflict between the tendency of mice to explore a novel environment and the tendency to avoid a brightly lit open areas [62]. The behavior is also influenced by thigmotaxis and the fear of heights. The EPM was in the shape of a “ + ”, with the four arms extending from a central platform and raised 1 m above the floor. Two alternate arms were dark and enclosed (30.5 cm × 6.5 cm, sidewall height 18.5 cm) while two alternate arms were open (30.5 cm × 6.5 cm, no sidewalls, illumination 40 lx) with a central platform connecting the arms (6 cm × 6 cm). The mouse was placed onto the center field of the EPM (faced to a closed arm) and was allowed to freely explore the maze for 5 min. AnyMazeTM tracking software was used to determine the time spent in open/closed arms, the number of entries, and the distance travelled by the test mice. Anxiety was measured by the time spent on open arms as well as the ratio of open arm entries and distance (compared to total number of entries/total distance travelled). These parameters are inversely related to anxiety. The number of total arm entries/total distance travelled reflects general motor activity (locomotion).
Fear Conditioning (FC)Fear conditioning (FC) is a type of associative learning task in which mice learn to associate a particular neutral conditional stimulus (CS) with an aversive unconditional stimulus (US) and show a conditional response [63]. The FC protocol used here evaluates both cued and contextual conditioning to assess amygdala-dependent and hippocampal-dependent fear-associated memory respectively. On day 1 (training), animals were placed into the test chamber (fear conditioning chambers from MED Associates Inc.) with vanilla scent cue presented in the chamber and lights on. For the first 2 min, mice were left undisturbed and could explore and habituate to the environment. After 2 min, the conditioned stimulus (CS: 30-s duration, 80-dB tone stimulus) was paired with a co-terminating unconditioned stimulus (US: electric foot shock of 0.4 mA for 2-s duration) twice with an inter-pairing interval of 120 s. The test mouse was returned to its home cage 120 s after the second CS–US pairing. On day 2 (context test), the mouse was returned to the testing chamber with the scent cue and light present, but no sound, for a total of 7 min. On day 3 (cue test), mice were placed in an altered context (e.g., no scent cue present, and a black wall in triangle was placed into the chamber, but lights are still on). Following the first 120 s, during which no auditory stimulus was presented (pre-CS), the CS was then presented continuously for 5 min. The experiment was then terminated after another 120 s without CS. In all trials, the percentage freezing response (the absence of all but respiratory movement) per 1-min block was automatically measured using SOF-843 video freeze (MED Associates Inc.), with a freezing threshold of 10. Total averages were calculated for each day, as well as the average freezing per minute in the cue test, during baseline testing in the first 2 min versus cue freezing in minutes 3 to 7.
Prepulse Inhibition (PPI)Prepulse inhibition (PPI), an operational measure of sensorimotor gating, is the attenuation of the startle response by a non-startling stimulus (prepulse) presented 30–500 ms before the startling stimulus (startle pulse). Startle reactivity can be measured using SR-LAB startle chambers (San Diego Instruments, San Diego, USA) where the startle response intensity of rodents (whole body flinch amplitude) can be measured using a piezoelectric accelerometer. As previously described, animals were habituated to the startle chambers and the test enclosures twice a day for 10 min on two consecutive days (with an intertrial interval of 2 h). On the third day, the PPI test was carried out and consisted of a 5-min acclimatization period to a 70-dB background noise, followed by 97 trials presented in a pseudorandom order to test the acoustic startle response (ASR) and PPI, 5 × 70 dB trials (background noise), 5 × 100 dB trials, 15 × 120 dB trials (for ASR), and 72 PPI trials comprising six sets of a prepulse of either 74, 82, or 86 dB presented 32, 64, 128, or 256 ms (variable interstimulus interval; ISI) prior to a startle pulse of 120 dB. The intertrial interval varied randomly between 10 and 20 s. Responses to each trial were calculated as the average mean amplitude detected by the accelerometer. The startle response was calculated as the mean amplitude across all 15 startle trials, and percentage PPI (% PPI) was calculated as [(mean startle response (120 dB) – PPI response)/mean startle response (120 dB)] × 100. For acoustic startle habituation, blocks of the acoustic response to 120-dB startle pulses presented at the beginning, in the middle, and at the end of the PPI protocol (i.e., averaged across five trials each) were used to determine the effect of “startle block” [14].
Statistical AnalysisBehavioral data were analyzed using GraphPad PRISM 9.4.0. Three-way repeated measures (RM) or two-way analysis of variance (ANOVA) were conducted for the within-subjects factors “time” (OF, FC), “chamber” (SPT), and “object” (NORT) and the between-subjects factors “sex” and “genotype.” If ANOVA interactions were detected, data were split for the corresponding factor and paired t-tests were used to follow these up and identify differences between individual groups. In addition, single-sample t-tests against chance levels (i.e., 50%) were used for the SPT and NORT exploration index to test for preference of mice for mouse/novel mouse /novel object. Data is presented as mean ± standard error of the mean (SEM), and F-values and degrees of freedom are presented for ANOVAs. Differences were regarded as statistically significant if p < 0.05; trends were mentioned where p = 0.05–0.06. Significant “genotype” effects are indicated by “#” (# p < 0.05, ## p < 0.01, and ### p < 0.001), “sex” effects by “ + ” (+ p < 0.05, + + p < 0.01, and + + + p < 0.001), “repeated measures” effects by “&” (& p < 0.001), and significant interactions by “^” (^ p < 0.05, ^^ p < 0.01, and ^^^ p < 0.001). Significant t-test results against chance level (i.e., 50%, NORT/SPT) and paired t-test results are indicated by “*” (*p < 0.05).
Comments (0)