
Remember me

Bone marrow aspirates were obtained from pediatric B-ALL patients in conjunction with routine clinical sampling after obtaining informed consent from parents and/or legal guardians in accordance with institutional review board approval at the Princess Máxima Center (application number PMCLAB2022.305). Bone marrow mononuclear cells (BM-MNCs) were isolated from fresh bone marrow aspirates using density gradient centrifugation and cryopreserved in liquid nitrogen. Healthy donor-derived bone marrow mononuclear cells used in the single-cell RNA-seq analysis were purchased from Stem Cell Technologies (Catalogue 70001). Patient characteristics, including age, gender, genetic risk factors, and disease stage, can be found in Supplementary Table 1.
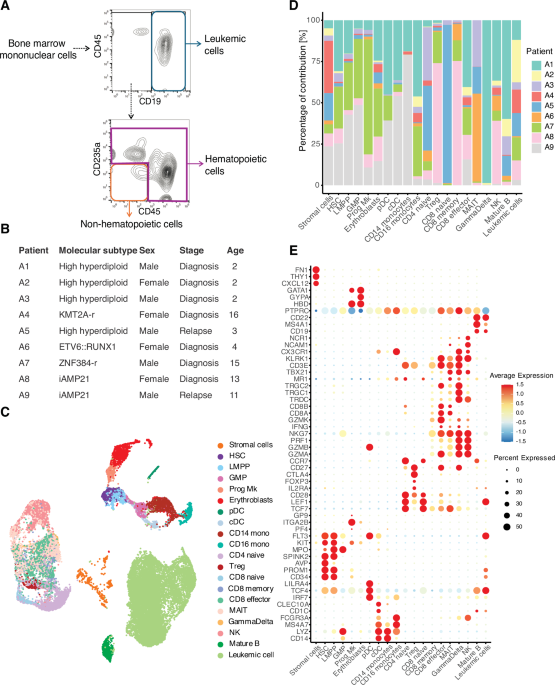
FACs enrichment of stromal, hematopoietic and leukemic cells for scRNAseqCryopreserved bone marrow mononuclear cells were thawed and resuspended in RPMI 1640 medium containing 5% FBS and 1 mM EDTA. The cell suspension was passed through a 70 μm mesh and stained for 20 min at 4 degrees with an antibody cocktail containing CD19-PE (Catalogue 302207, Clone HIB19, 1:100), CD235a-FITC (Catalogue 349103, Clone HI264, 1:100), CD45-PE-Cy7 (Catalogue 304015, Clone HI30, 1:100), all from Biolegend. Cells were washed twice with medium followed by 7AAD staining (Catalogue 420404, 1:100) to exclude dead cells before sorting on a Sony SH800S instrument (Sony Biotechnology). Leukemic cells, hematopoietic, and non-hematopoietic cells were sorted in RPMI 1640 medium containing 5% FBS. Samples were kept during the whole procedure at 4 °C. Following enrichment, each of the three cell fractions (leukemic, hematopoietic, non-hematopoietic) were resuspended at a concentration of 1000 cells/μL in PBS + 0.04% BSA. Cells were pooled in a 1:1:1 ratio and the cell suspension was subsequently mixed with a cell suspension from another patient with a different gender (multiplexed boy/girl samples). Subsequently, the cell suspension was loaded into the 10x Genomics Chip as described in ‘Single-cell RNA library generation’.
Single-cell RNA-seq library generationIn total, 20,000 cells were loaded for each (multiplexed) sample onto a 10x Genomics Chip G. We used Chromium Next GEM Single Cell 3’ GEM, Library & Gel Bead Kit and followed the protocol as provided by 10x Genomics. Sequencing was performed on Illumina NovaSeq 6000 sequencer and parameters were set according to 10x Genomics recommendations. A healthy donor sample was included in the scRNA-seq analysis to provide a baseline for comparison. Only the non-hematopoietic compartment from this sample was sorted and sequenced.
Data processing and filteringReads from the sequencing were aligned to the human reference genome (GRCh38) using Cell Ranger v7.1.0. Samples were demultiplexed using souporcell based on Single Nucleotide Polymorphisms (SNPs) identified within the reads. Patient identities were assigned based on specific sex chromosome genes. Further analysis was performed using R v4.0.2 (https://www.r-project.org/) including several packages which are mentioned in the according section. As an initial step, we filtered out low-quality cells. Cells with less than 200 expressed features were removed. Additionally, cells with greater than 10% of reads mapping to mitochondrial genes were excluded. Doublets/multiplets, which can arise during library preparation, were identified and removed using the scDblFinder package with default parameters [38].
Data integrationAll patient scRNAseq datasets were merged into one Seurat object after prefiltering (see section: “Data processing and filtering”). Based on this object, the data was normalized using the SCTransform function from Seurat with default parameters. Principal component analysis (PCA) was performed using the RunPCA function from Seurat, with the number of principal components (npcs) set to 30, a value determined empirically to capture the major sources of variation in the data. The IntegrateLayers function was run with the RPCA integration method and default settings to integrate the data across different patients and account for batch effects.
AnnotationCluster annotation for the full integration of all samples was performed at a low-resolution to identify major cell types. Cell types were annotated based on information from literature, functional information from gene sets based on the marker genes of a cluster and unbiased cell type recognition using the Human Primary Cell Atlas and bone marrow scRNAseq references [14, 15] in SingleR with default parameters [39]. The cell type annotation of the stromal cluster relied primarily on the dataset by Bandyopadhyay et al. as a reference in SingleR using default parameters. Unsupervised clustering of the stromal cluster using the FindClusters function in Seurat identified 5 subclusters. However, the biological relevance and distinct cell identities of these subclusters could not be elucidated based on their top markers. Furthermore, the transcriptome of 4 of these subclusters exhibited greater similarity to each other compared to the fifth cluster. To further investigate the stromal cell populations, single-cell RNA-seq data from the manuscript of Bandyopadhyay et al., Cell 2024 [14], was downloaded from NCBI Gene Expression Omnibus (GSE253355) and loaded into Seurat. This comparative analysis predominantly identified two stromal populations: early mesenchymal progenitors (fibro-MSCs) and adipogenic progenitors (adipo-MSCs).
Marker gene identificationMarker genes per cluster were calculated by the Seurat function FindAllMarkers, using the method “Model-based Analysis of Single-cell Transcriptomics” (MAST) with a log fold change threshold of 0.3 and min-pct set to 0.3. Enriched gene sets per set of marker genes were analyzed as described in the Gene Set Enrichment Analysis section.
Gene set enrichment analysis (GSEA)The gprofiler2 package was used to perform GSEA based on marker genes and differentially expressed genes [40]. The gost function was run with default settings. Ribosomal genes were excluded from the gene lists beforehand to focus on biologically relevant processes and only gene lists with more than 5 remaining genes sorted by adjusted p value were tested. Before plotting, the identified gene sets were filtered for terms with less than 1000 genes to exclude overly broad terms. Only terms from GO, Reactome and KEGG were plotted.
Signal pathway activityTo investigate signaling pathway activity across stromal cell populations, we utilized the R package PROGENy [41]. The integrated Seurat object was used to annotate stromal subpopulations and compute pathway activity scores using the top 500 genes relevant for human signaling pathways. PROGENy scores were added to the Seurat object as a new assay and scaled using Seurat’s ScaleData function. Pathway scores were extracted and aggregated by cell type to compute average activity levels per population. Visualization of global and selected pathway activities was performed using heatmaps (pheatmap package), displaying the average pathway activity per cell type.
Transcription factor activity inference using SCENICTo infer transcription factor (TF) activity across stromal populations in B-ALL, we applied the SCENIC (Single-Cell rEgulatory Network Inference and Clustering) pipeline [18]. Raw gene expression counts were extracted from an integrated Seurat object containing stromal cells. SCENIC was executed in R using the GENIE3, RcisTarget, and AUCell packages with human motif annotations and cisTarget databases (hg19) for regulatory network inference. Regulon activity was summarized per stromal cluster and visualized using heatmaps to identify cell type-specific TF programs.
Differentiation state predictionTo infer the differentiation potential of stromal cells, we employed CytoTRACE v0.3.3, a computational tool that estimates developmental states based on gene expression profiles and transcriptional entropy [42]. We began by extracting the raw count matrix from the RNA assay of the Seurat object. This count matrix was converted into a data frame suitable for input into the CytoTRACE algorithm. CytoTRACE was then run using default parameters, returning a differentiation score for each cell, where higher scores reflect a more progenitor-like state and lower scores indicate greater differentiation. The CytoTRACE scores were subsequently added to the Seurat object as metadata. Ridge plots were created to characterize the density of differentiation states across cell types.
Cell-cell communication analysisThe CellChat algorithm was applied to perform an unbiased ligand-receptor interaction analysis [43]. CellChat’s human ligand-receptor database was employed to infer potential cell-cell interactions. Overexpressed genes and interactions were identified, followed by projection onto a human protein-protein interaction network. Communication probabilities were computed using a tri-mean method, and signaling pathways were aggregated and filtered to include interactions supported by at least 10 cells per group. Network centrality metrics were calculated, and interaction patterns were visualized via circle plots and bubble plots (targeted to key populations such as adipogenic and early mesenchymal progenitors, and leukemic cells).
A leukemic cell interaction score was calculated per cell cluster as the average expression of signaling factors (cytokines, integrins, extracellular membrane components) that were inferred to interact with leukemic cells based on the CellChat inferred interactions, using a curated gene set of 45 nourishing ligands (e.g., CXCL12, FN1, VEGFA, GDF15). Module scores were calculated per cell, and statistical differences across non-leukemic cell types were evaluated using Kruskal-Wallis and post-hoc Bonferroni-adjusted Wilcoxon tests.
To identify dominant modes of outgoing intercellular communication, non-negative matrix factorization (NMF) was applied to the signaling networks. The optimal number of outgoing signaling patterns was determined using the selectK() function, which evaluates cophenetic and silhouette coefficients; both metrics indicated an elbow at k = 5, suggesting five distinct communication programs. These five communication patterns represent core signaling strategies employed by different cell types across the microenvironment. Each pattern groups cell populations that exhibit similar outgoing signaling behaviors, highlighting functional convergence or specialization.
Inference of copy number variationTo distinguish leukemic cells from non-malignant populations in pediatric B-ALL samples, we performed copy number alteration (CNA) analysis on individual patients using the SCEVAN (Single-Cell Evolutionary Variational Autoencoder for CNAs) R package [44]. For each patient, we extracted single-cell gene expression data from an integrated Seurat object. To define a set of reference “normal” cells for CNA inference, clusters corresponding to T cells and monocytes were identified based on expression of canonical markers such as CD3G, CD8A, CD14, and FCGR3A, using DotPlot() visualization. Cells from clusters expressing these markers were selected as the normal reference population. Gene expression matrices were extracted from the RNA assay for each sample and converted to matrix format for input into the pipelineCNA() function from the SCEVAN package. SCEVAN output classified cells based on inferred CNA profiles into likely malignant or normal categories.
Spatial transcriptomic analysisWe analyzed a publicly available spatial transcriptomics dataset generated using the Xenium In Situ platform (10x Genomics) from a formalin-fixed paraffin-embedded (FFPE) trephine bone marrow biopsy sample obtained from a patient diagnosed with B-cell acute lymphoblastic leukemia (B-ALL) [25]. Patient metadata, including age, sex, and molecular subtype, were not provided with the dataset. The dataset consisted of a total of 225,906 spatially resolved cells. The median number of transcripts per cell was 27, and a total of 6,933,297 high-quality decoded transcripts were detected across the tissue section. The total imaged region area was 26,288,545.2 µm². Gene expression profiling was performed using a panel of 477 RNA targets, which included 377 predesigned genes from the standard Xenium Human Multi-Tissue Panel and 100 custom-selected genes relevant to bone marrow.
Cell segmentation was performed using the Xenium onboard pipeline. Nuclear boundaries were identified based on DAPI staining, and a heuristic expansion was applied to approximate full cell boundaries, enabling transcript assignment to individual cells. Xenium data was analyzed using the Seurat (v5) R packages. Xenium raw data were imported with LoadXenium() and filtered to retain cells with >10 UMIs and >3 detected genes. Quality control metrics were visualized using violin plots. Selected regions of interest were cropped for high-resolution spatial inspection using the Crop() function. Normalization was performed using SCTransform. Principal component analysis (PCA), uniform manifold approximation and projection (UMAP), and shared nearest neighbor-based clustering were used for dimensionality reduction and cell clustering (RunPCA(), RunUMAP(), FindNeighbors(), FindClusters()), with clustering resolution set to 0.2 for the full dataset. Marker genes for each cluster were identified via differential expression analysis using the MAST test (FindAllMarkers()), applying a threshold of log2FC > 0.1 and adjusted p-value < 0.05. To identify and map specialized cellular microenvironments, spatial niches were inferred using the BuildNiche()function from Seurat with standard settings, which detects spatially enriched co-localized cell populations. For spatial visualization, annotated cell identities were exported and visualized using Xenium Explorer 3.0.
Generation of single-cell reference matrixA single-cell RNA-seq reference was constructed using our integrated dataset encompassing all cellular populations within the B-ALL niche. A reference expression matrix was generated by extracting raw count data from the RNA assay using GetAssayData() with the “counts” layer. The resulting matrix was converted to a data.frame and matched with corresponding cell-type annotations. The column names of the expression matrix were relabeled with their respective “Annotation_L2” identities to ensure compatibility with CIBERSORT, which requires labeled expression profiles as input. The final reference matrix was saved as a tab-delimited text file (.txt) for use in downstream deconvolution of bulk RNA-seq data.
Cell type deconvolution Analysis in Bulk RNA-seq DataBulk RNA-seq data generated for routine diagnostics were obtained from the Princess Máxima Center Biobank (application number PMCLAB2021.258), containing a cohort of 245 B-ALL bone marrow patient samples. Furthermore, we obtain a publicly available dataset downloaded from the St. Jude Cloud Platform via DNAnexus [45]. For RNA-seq deconvolution, we employed CIBERSORTx with the Impute Cell Fractions job type, with batch correction S-mode, in absolute mode and 100 permutations. Clinical metadata including age, sex, molecular subtype, and sample type (diagnosis vs. relapse) were imported into R for further analysis. Samples were grouped into risk categories (High vs. Not High Risk) based on the molecular subtype according to criteria described in the literature [46], and annotated accordingly. Samples were categorized as High Risk if they harbored one of the following subtypes: BCR-ABL, BCR-ABL-like, KMT2A rearranged (KMT2Ar), hypodiploid, near-haploid, MEF2D rearranged (MEF2Dr), MYC, iAMP21, TCF3-HLF, or ABL-class fusions. Samples were categorized as Not High Risk if they exhibited one of the following subtypes: ETV6-RUNX1, ETV6-RUNX1-like, hyperdiploid, TCF3-PBX1, DUX4 rearranged (DUX4r), CRLF2 rearranged (CRLF2r), CEBP rearranged (CEBPr), KMT2A-like, ZNF384-like (ZNF384r-like), PAX5, ZNF384 rearranged (ZNF384r), IGF2BP1 rearranged (IGF2BP1r), IKZF1, or other. Outlier detection was performed on the adipogenic progenitor scores using visual inspection of histograms and Grubbs’ test. One extreme outlier (value > 300) was identified and excluded from downstream analyses.
Stromal populations cell sortingMSC subtypes were isolated from BM-MNCs using fluorescence-activated cell sorting (FACS) on a Sony SH800S instrument (Sony Biotechnology) based on surface marker expression identified from the single-cell RNA sequencing data. In addition to the analysis of well-known stromal CD markers, we performed an unbiased approach using the sc2marker package with default settings [47].
To exclude hematopoietic and leukemic cells, we used a dump gate strategy at 421 nm emission composed of CD19-BV421 (Catalogue 302233, clone HIB19, 1:100), CD22-BV421 (Catalogue 302523, clone HIB22, 1:100), CD45-BV421 (Catalogue 304031, clone HI30, 1:100), CD235a-BV421 (Catalogue 349131, clone, HI264 1:100). Live/dead exclusion was performed using Zombie green (Catalogue 423111, 1:100). Adipogenic progenitors were sorted as positive for CD106-PE (Catalogue 305805, clone STA, 1:100) and Cadherin 11-APC (Catalogue 368705, clone 16G5, 1:100), while early mesenchymal progenitors were negative for these markers and positive for CD81-PE-Cy7 (Catalogue 349511, clone 5A6, 1:100) and CD90-AF700 (Catalogue 328119, clone 5E10, 1:100). Stromal populations were sorted in MSC medium (DMEM-low glucose supplemented with 10% FBS, 1% Primocin solution and 1 ng/mL bFGF).
scRNA seq analysis of early mesenchymal progenitors and adipogenic progenitorsSorted MSC subtypes were cultured in MSC medium (DMEM-low glucose supplemented with 10% FBS, 1% Primocin solution and 1 ng/mL bFGF) and incubated at 37 °C with 5% CO2. Cells were expanded to passage 3 and scRNAseq analysis was performed as described in ‘Single-cell RNA library generation’.
Projection of sorted stromal populations into the unsorted stromal scRNAseq datasetThe two stromal populations were isolated via FACS from leukemic donor samples and sequenced independently. To control for sampling bias, each sorted population was downsampled to 2300 cells. Each dataset was normalized using the SCTransform function, regressing out mitochondrial content. Following normalization, the datasets were merged and dimensionality reduction was performed using PCA (30 components), followed by UMAP. The merged dataset of sorted stromal cells was projected onto the UMAP embedding of the reference stromal dataset using the RunKNNMap function from the SCP package. The projection utilized 3000 integration features identified via SelectIntegrationFeatures, and both query and reference datasets used the SCT assay. Following projection, cells from the sorted populations were classified according to the nearest neighbors in the reference using RunKNNPredict. Cells were assigned to predicted stromal subtypes with a low-frequency filter set at 20 cells per type. To quantify enrichment of predicted stromal subtypes within each sorted population, classification outcomes were tabulated and expressed as proportions. A contingency table comparing the frequencies of adipogenic versus early mesenchymal progenitors across the two sorted populations was constructed. A chi-square test of independence was used to evaluate differences in predicted subtype distributions between sorted populations. Proportional distributions of predicted stromal subtypes were visualized using stacked bar plots in ggplot2, with custom color palettes for clarity.
Flow cytometry analysis of sorted early mesenchymal progenitors and adipogenic progenitorsSorted MSC subtypes were cultured in MSC medium (DMEM-low glucose supplemented with 10% FBS, 1% Primocin solution and 1 ng/mL bFGF) and incubated at 37 °C with 5% CO2. Cells were expanded to passage 3, trypsinized and prepared for flow cytometry analysis. The cell suspension was stained with Viakrome 808 (Catalogue #C36628, 1:100, Beckman Coulter) for 15 min at 4 degrees to exclude dead cells. After staining, 1 mL of MSC medium was added to the suspension, which was then centrifuged. The supernatant was discarded, and the cell pellet was resuspended in a single marker antibody solution. All antibodies were obtained from Biolegend. Following antibody staining, cells were washed with PBS containing 1% FBS, centrifuged and the supernatant was discarded. The final cell pellet was resuspended in 100 microliters of PBS containing 1% FBS fow flow cytometry analysis on a Cytoflex LX instrument (Beckman Coulter). Data were analyzed using FlowJo software (BD Biosciences).
Colony-forming unit fibroblast (CFU-F) assaysSorted cells were seeded in 6-well plates at a density of 475 cells per well (50 cells/cm2) containing culture medium (DMEM-low glucose supplemented with 10% FBS, 1% Penicillin/Streptomycin solution and 1 ng/mL bFGF) and incubated at 37 °C with 5% CO2. Medium was changed every 3–4 days. At day 10, cells were fixed with methanol and stained with 0,5% crystal violet staining solution. Adherent colonies with more than 50 cells were quantified.
Multipotency assaysAdipogenic and osteogenic differentiation assays were performed in cells at passage three to five. For adipogenic differentiation, cells were seeded at a density of 21,000 cells/ cm2 and cultured in DMEM-low glucose (Gibco, Catalogue 21885-025) supplemented with 10% FBS, 1% Penicillin/Streptomycin, 0.5 μM isobutylmethylxanthine (Sigma, I5879), 60 μM indomethacin (Sigma, 17378), 5 μg/mL insulin (Sigma, I9278) and 1 μM dexamethasone (Sigma, D2915) for 15 days (medium was changed every 3–4 days). To measure adipogenic differentiation, cells were fixed with 4% PFA and stained using 0.5% Oil Red O (Sigma, 00625) in isopropyl alcohol diluted with distilled water in 3:2 ratio and the lipid-filled cells across the whole well of a 96-well plate were counted. Images of stained cells from corresponding samples in 12-well plates were captured for visualization.
For osteogenic differentiation, cells were seeded at a density of 3000 cells/cm2 in osteogenic medium for 15 days (medium was changed every 3–4 days). The osteogenic differentiation medium contained DMEM supplemented with 10% FBS, 1% Penicillin/Streptomycin, 1% glutamine, 50 μg/mL L-ascorbate acid (Sigma, A8960), 10 mM β-glycerophosphate (Sigma, G6376) and 100 nM dexamethasone. Osteogenic differentiation was verified by alizarin red S staining (Sigma, A5533) by visualization of mineralized deposits.
Leukemic cell viability in co-culture with stromal populationsEarly mesenchymal progenitors and adipogenic progenitors between passages 5–7 were seeded at a cell density of 15,000 cells/cm2 in 96 well plate in MSC medium and incubated at 37 °C with 5% CO2. The next day, 200,000 patient-derived bone marrow mononuclear cells and sorted MSC subtypes were co-cultured in SFEM medium containing 1% Penicillin/Streptomycin solution and incubated at 37 °C with 5% CO2. After 7 days, all cells per well were harvested by aspirating the supernatant and trypsinizing attached cells using TrypLE Express (Gibco, 12605). Both cell suspensions were combined, per well. After washing the cells with PBS, FBS 5%, cells were stained with CD19-BV421 (Biolegend, Catalogue 302233, clone HIB19, 1:100) and Zombie NIR (Biolegend, Catalogue 423106, 1:200) for live/dead exclusion.
Cell viability was assessed using a flow cytometry Cytoflex S (Beckman Coulter), recording all events with a fixed volume of 80 microliters per well.
Evaluation of small molecules and blocking antibodies in co-culture of B-ALL cells with stromal populationsEarly mesenchymal progenitors and adipogenic progenitors between passages 5 and 7 were seeded at a cell density of 15,000 cells/cm2 in 96 well plate in MSC medium and incubated at 37 °C with 5% CO2. The next day, 200,000 patient-derived bone marrow mononuclear cells were added per well in 200ul SFEM containing 1% Penicillin/Streptomycin. Where indicated, cultures were treated with varying dexamethasone (Sigma, D4902) concentrations (1 nM, 3 nM, 5 nM, 10 nM, 30 nM, 50 nM, 100 nM), mouse IgG1 kappa Isotype control (1 ug/mL, MedChemExpress, Catalogue HY-P99977), anti-mouse/human IL-7 (1 ug/mL, BioCell, Clone M25, Catalogue BE0048), Plerixafor (1 nM, MedChemExpress, Catalogue HY-10046), anti-Osteopontin (1 ug/mL, BE0382, BioCell), BIO-1211 (50 uM, MedChemExpress, Catalogue HY-14126), anti-hVCAM1 mouse monoclonal IgG (2 ug/mL, R&D Systems, Clone BBIG-V1, Catalogue BBA5), and anti-Integrin Beta1 (2 ug/mL, Merk, Clone AIIB2, Catalogue MABT409). After 7 days of incubation, all cells per well were harvested by aspirating the supernatant and trypsinizing attached cells using TrypLE Express (Gibco, 12605). Both cell suspensions were combined, per well. After washing the cells with PBS, FBS 5%, cells were stained with CD19-PE (Biolegend, Catalogue 302208, Clone HIB19, 1:100) and Zombie Violet Fixable Viablity Kit (BioLegend, Catalogue 423113/423114, 1:100) for live/dead exclusion. The flow cytometry analysis on a Cytoflex LS instrument (Beckman Coulter) was used to measure absolute number of viable CD19+ leukemic cells per well. Data was analyzed with FlowJo software (BD Biosciences).
Isolation of pediatric bone marrow stromal cells from healthy and leukemic patientsHealthy donor-derived stromal cells were isolated from surplus iliac crest bone chip material harvested from pediatric patients undergoing alveolar bone graft surgery. All human samples were obtained with the approval of the Erasmus MC, University Medical Center Medical Research Ethics Committee (MEC-2014-16). Iliac crest bone chips were washed with expansion medium composed of Minimum Essential Medium (MEM)-α (containing nucleosides) supplemented with heat inactivated 10% v/v fetal bovine serum (FBS) (both Thermo Fisher Scientific, Waltham, MA, USA), 1.5 µg/ml fungizone (Gibco), 50 µg/ml gentamicin (Gibco), 25 µg/ml L-ascorbic acid 2-phosphate (Sigma-Aldrich, St. Louis, MO, USA), and 1 ng/ml fibroblast growth factor-2 (Instruchemie, Delfzijl, The Netherlands), and the resulting cell suspension was seeded in T75 flasks. Cells were washed twice with phosphate buffered saline (Thermo Fisher Scientific) supplemented with 2% v/v heat inactivated FBS 24 h following seeding to remove non-adherent cells. Stromal cells were cultured at 37 °C and 5% carbon dioxide under humidified conditions, with expansion medium refreshed every 3–4 days. A similar approach was used to isolate stromal cells from bone marrow aspirates from B-ALL patients (application number PMCLAB2022.305). 24 h after seeding, the non-attached cells were removed and adherent cells were cultured at 37 °C and 5% carbon dioxide under humidified conditions, with expansion medium refreshed every 3–4 days.
Stromal cells were sub-cultured upon reaching 80–90% confluency using 0.25% w/v trypsin-EDTA (Thermo Fisher Scientific) and reseeded at a cell density of 2,300 cells/cm2.
Adipogenic differentiation was performed with leukemic and healthy donor-derived stromal cells at passage 5 as described in the section ‘Multipotency assays’.
Analysis of adipogenic differentiation skewing by leukemic cellsHealthy donor -derived stromal cells were co-cultured with patient-derived xenografts in SFEM medium containing 1% Penicillin/Streptomycin solution and incubated at 37 °C with 5% CO2. After 24 h, leukemic cells were removed by aspirating the supernatant. After washing the cells with PBS, FBS 5%, adipogenic differentiation was induced and quantified as described in the section ‘Multipotency assays’.
In the same manner, 12-well hanging cell culture inserts, PET membrane, with a pore size of 0.4 μm (cellQART, 9310402) were used for the transwell assay. Three days later, leukemic cells were removed, and the remaining cells were cultured in adipogenic differentiation media for 12 days to match 15 days of adipogenic differentiation period. Five pictures per well were taken at 2X magnification and based on that the average number of lipid containing cells/well was calculated.
Multiplex cytokine analysisHarvested supernatant (25 μL) was used for cytokine quantification using a bead-based immunoassay according to the manufacturer’s instructions (LEGENDplex, BioLegend, Catalogue 741362 and 740611). Specific antibody coated beads were incubated with supernatant from each condition, in triplicate, forming an analyte-antibody complex. After washing, a biotinylated detection antibody cocktail was added which bound to the specific analyte-antibody complexes. Streptavidin-phycoerythrin was subsequently added which bound to the biotinylated detection antibodies, providing fluorescent signal intensities in proportion to the bound analyte amount. Fluorescent signals were measured using Cytoflex LX and analysed using LEGENDplex data analysis software where concentrations of each analyte were determined using a standard curve generated from the same assay.
Statistical analysisUnless otherwise stated, statistical significance was assessed by a two-tailed Student’s t-test for comparison between two groups or two-way ANOVA with Bonferroni’s multiple comparison for comparisons among multiple groups. A p-value < 0.05 was considered statistically significant. Statistical analyses were performed using GraphPad Prism 9.0.1 and R. GSEA is performed with the hypergeometric test for overrepresentation (one-sided), followed by multiple comparison correction using the Benjamini-Hochberg method. The individual method of correction for specific R packages are described in the corresponding publications. A formal power calculation was not performed. The single-cell study was exploratory in nature. For ex vivo co-culture experiments, all conditions were performed in triplicates. The investigator was not blinded to experimental samples.
Comments (0)