
Remember me
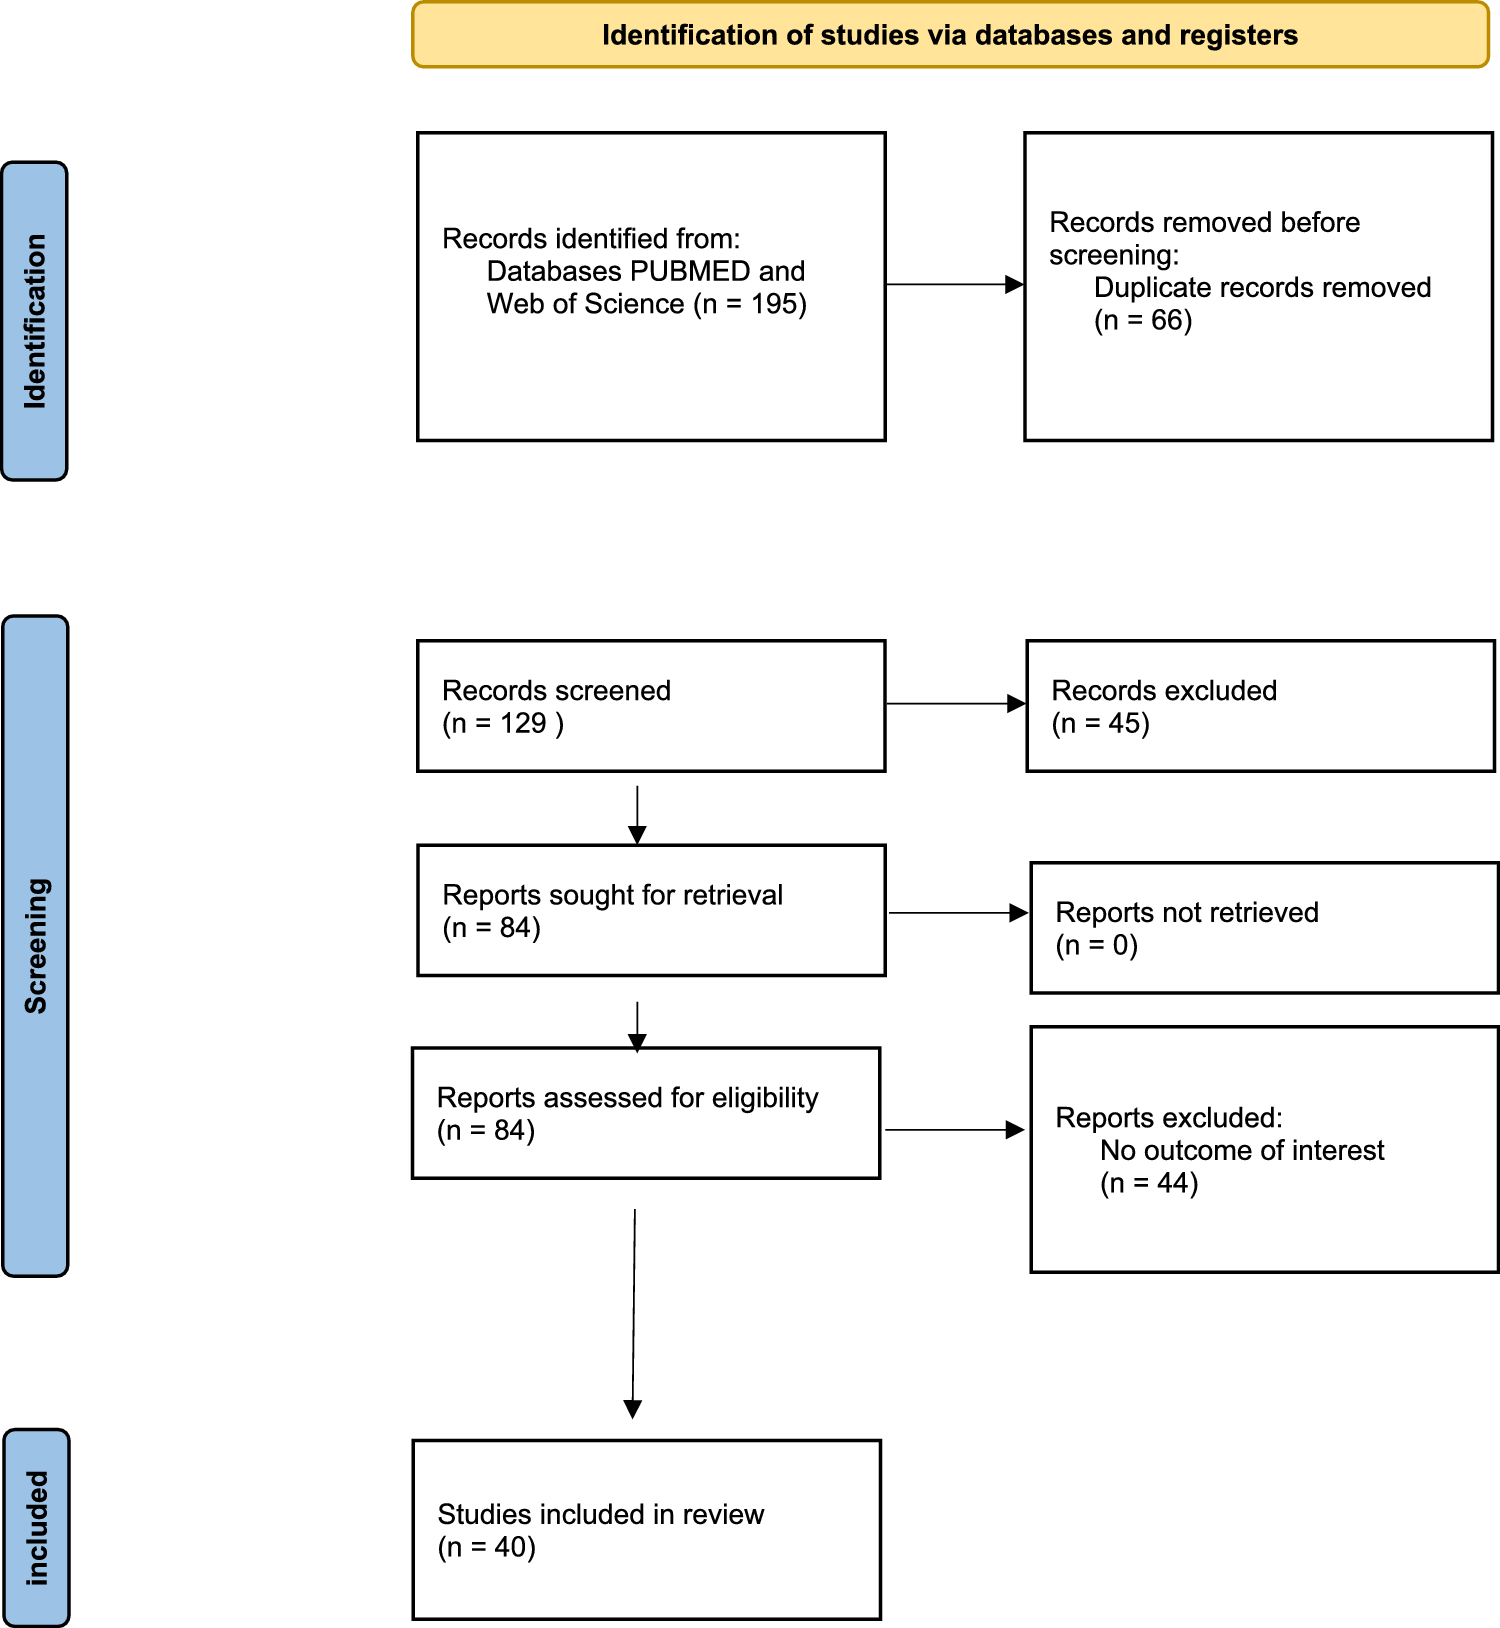
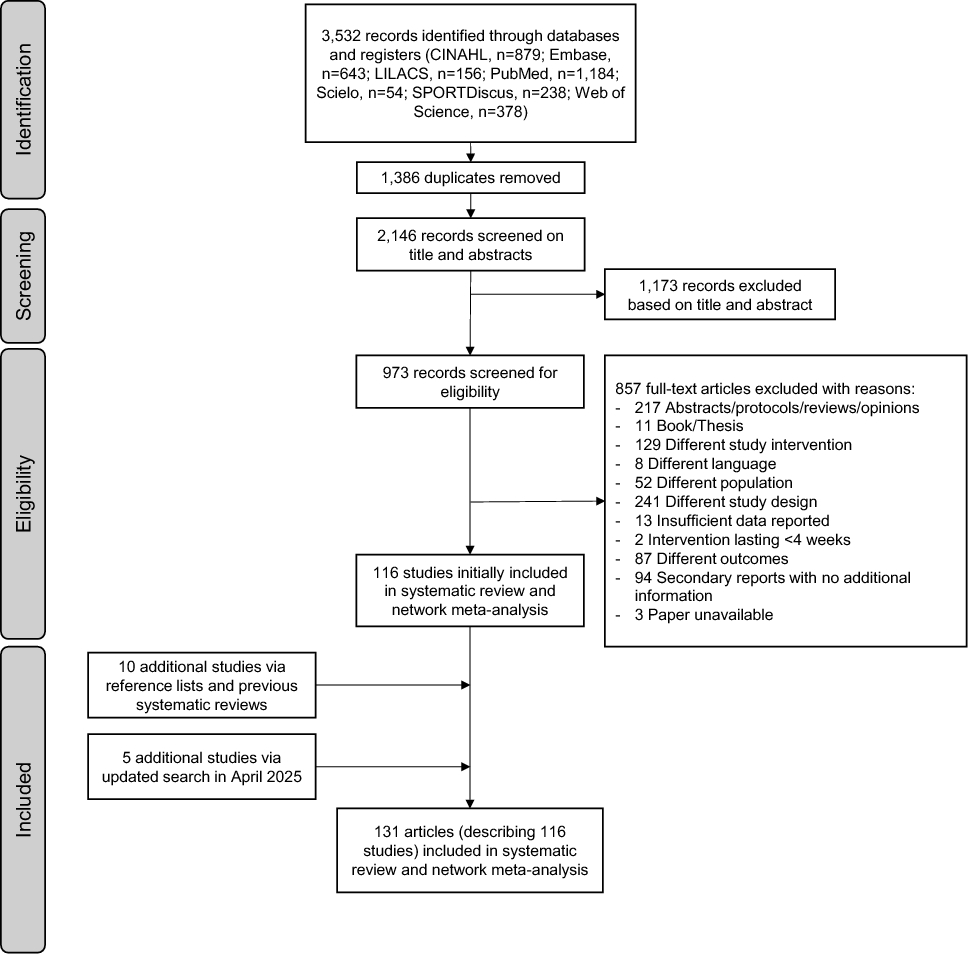
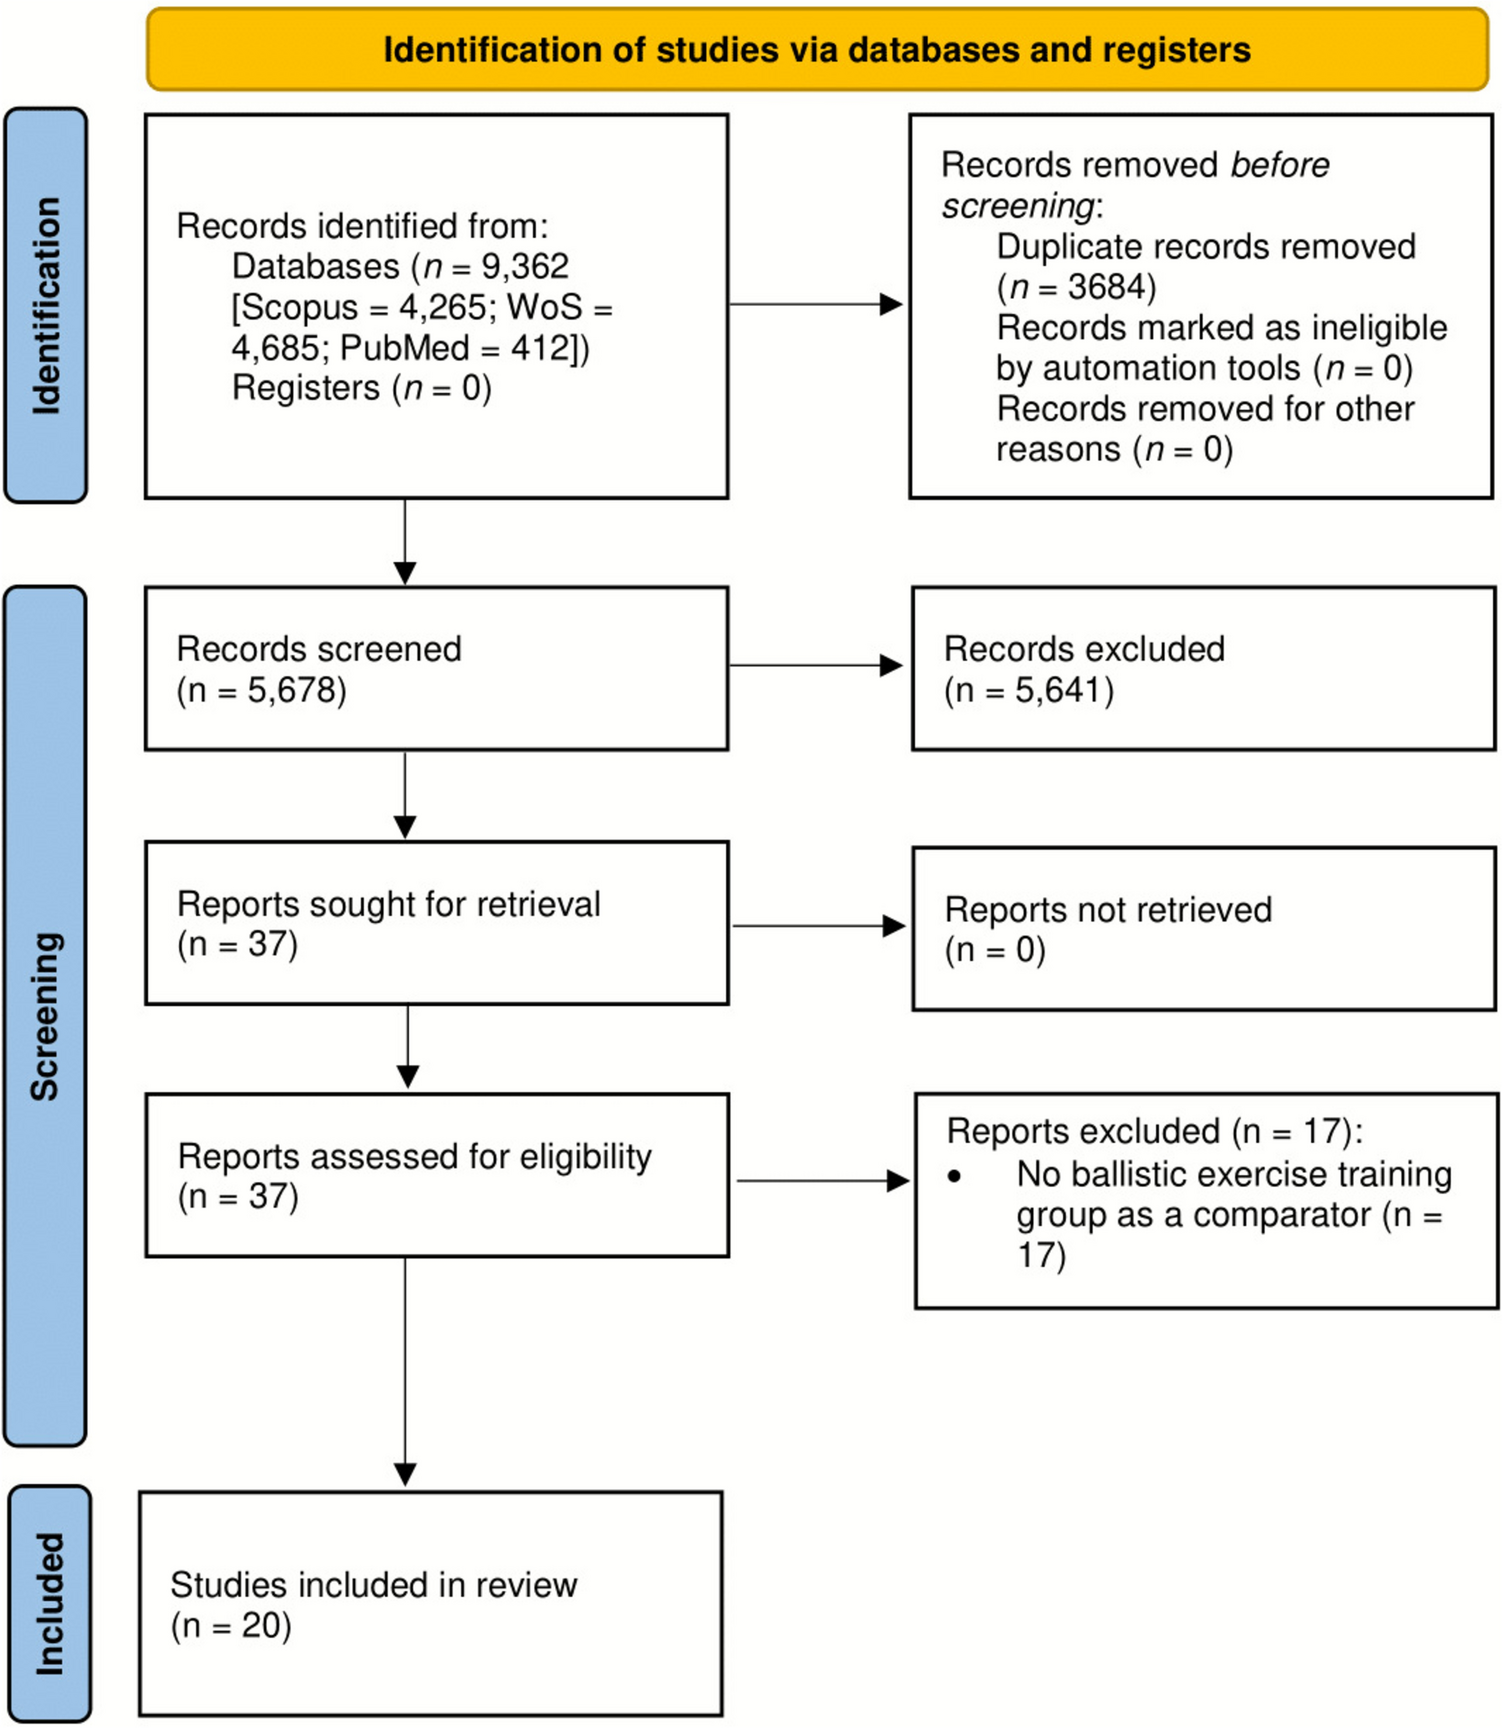
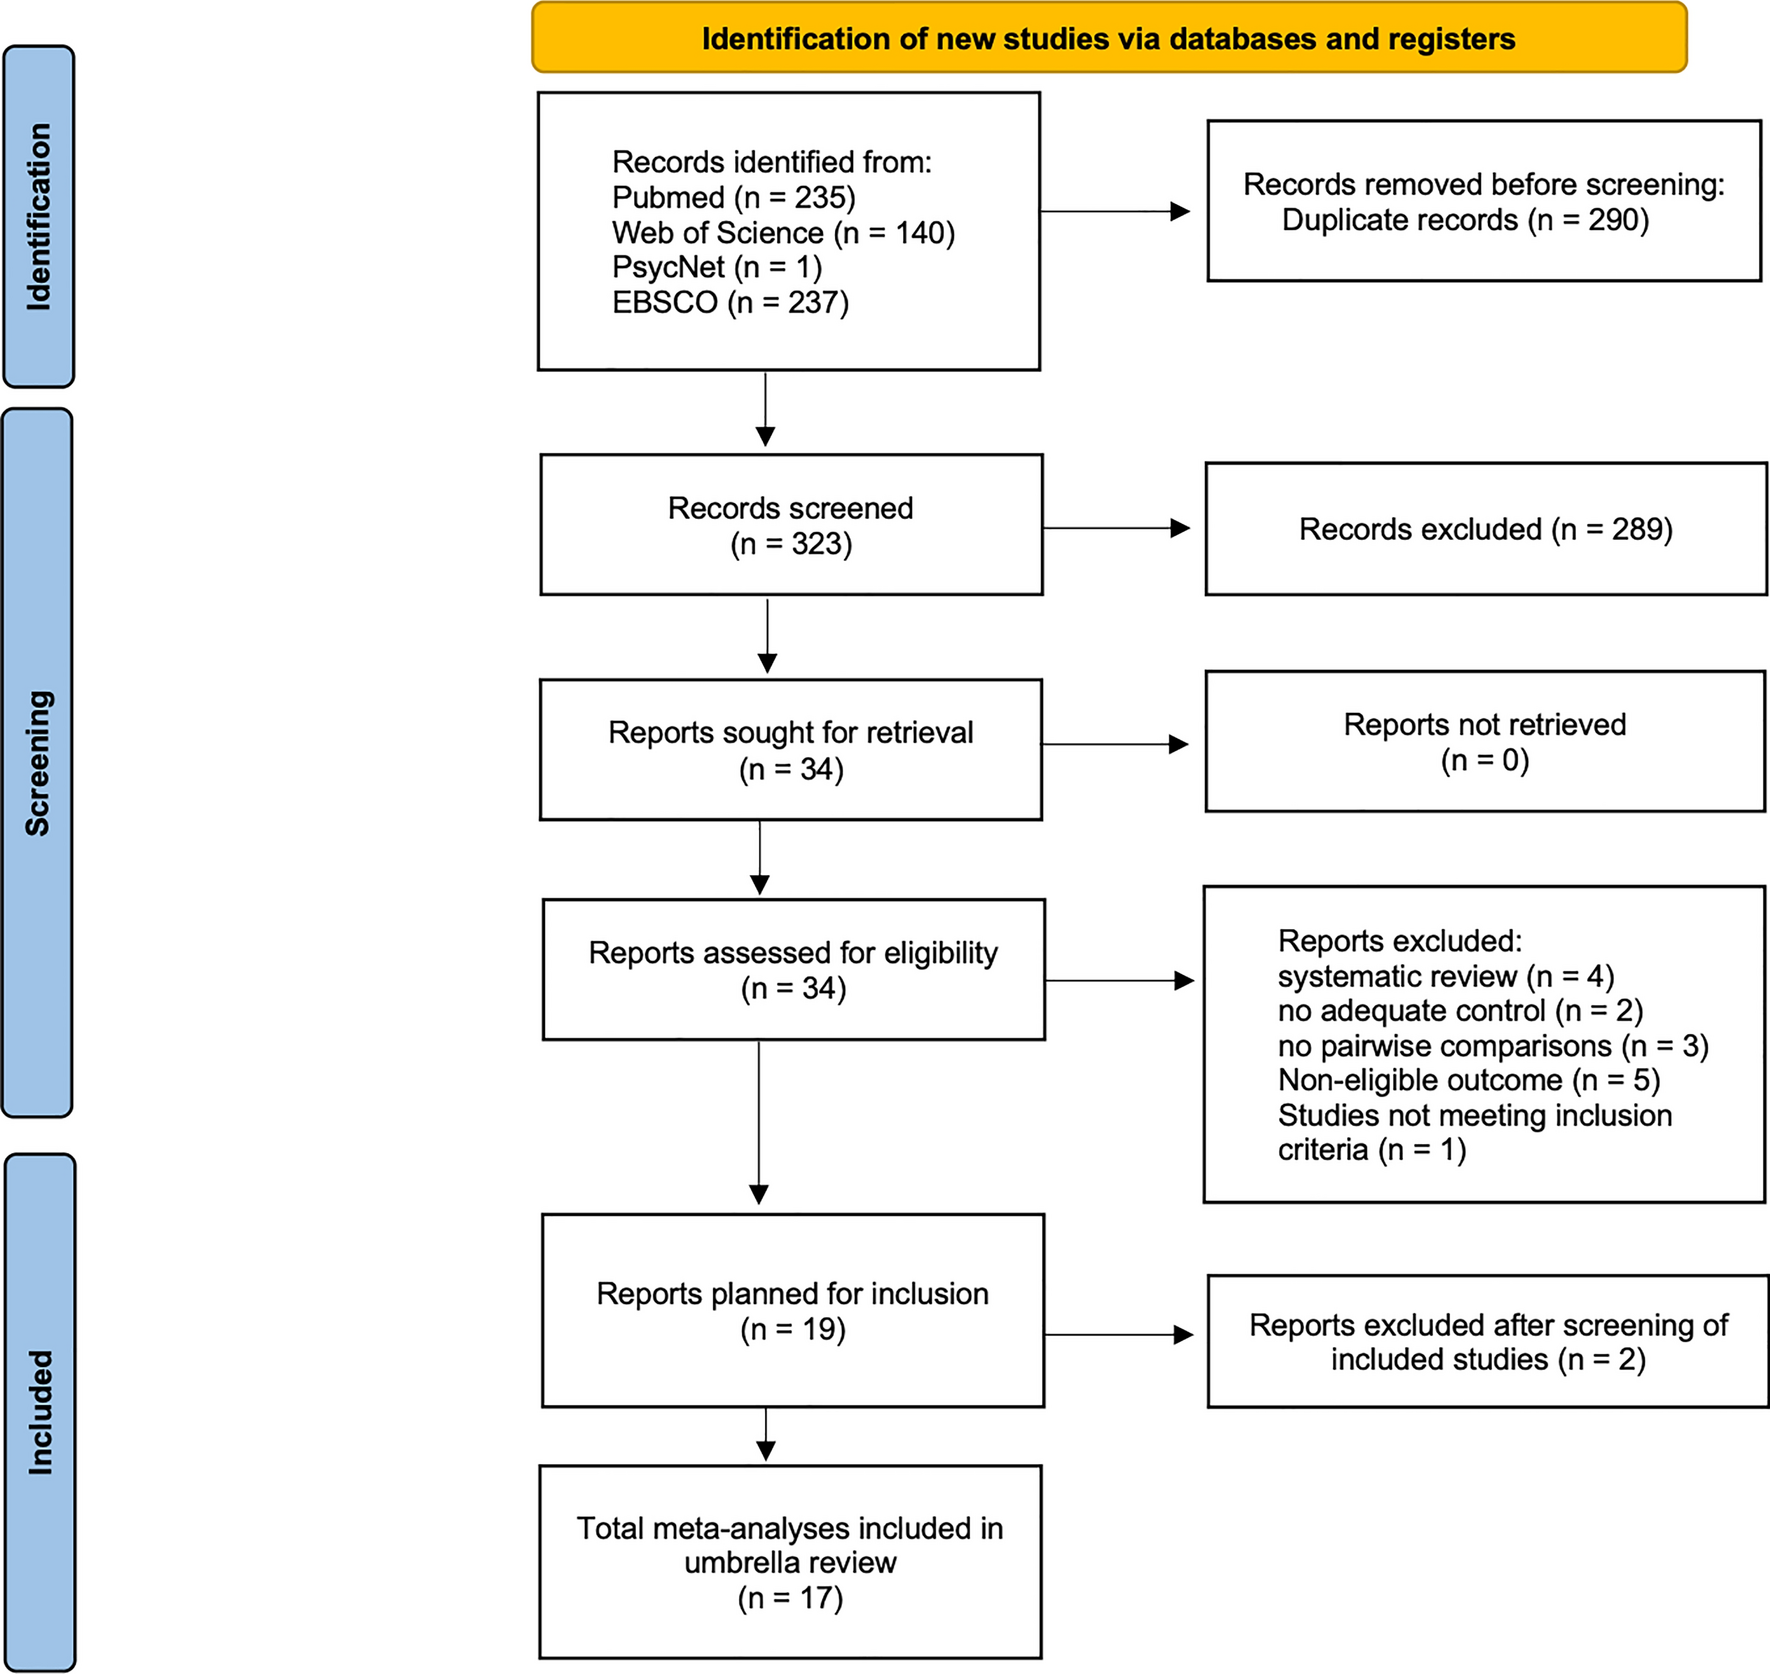
Of the 2062 total studies retrieved from the systematic search, 38 met the criteria for inclusion in the review. With the addition of 6 eligible studies identified via manual searching of reference lists, a final 44 studies were included (Fig. 1). Two studies appeared to meet the criteria for inclusion in the systematic review but were excluded after being identified as plagiarising the results (and other aspects) of included studies. Two studies reported exercise classification for two different technologies and a combination of the technologies [10, 55], and another study reported exercise classification models in two separate samples [19], resulting in 49 prediction models in total.
Fig. 1
Flow diagram of screening and selection process
3.2 Study CharacteristicsOf the 44 included studies, two were validation studies and the remaining 42 were both development and validation studies (Supplementary Material S2). The number of participants enrolled in the studies ranged from 1 to 159, although only seven of the reviewed studies collected data from more than 30 participants. Studies often included male and female participants aged between 18 and 65 years, with training experience ranging from no experience to highly trained individuals. Most studies did not report training experience or gave a broad description of trained and untrained; the specific descriptors of training experience for each study are provided in Supplementary Material S2. Of the 49 models, most used IMUs (24/49), followed by accelerometers (6/49), then a range of other technologies (11/49) (Fig. 2). In addition, some models used a combination of technologies in their methodology (8/49).
Fig. 2
Overview of the technologies utilised in the reviewed models. *The number of models that used each of the technologies, including if used in combination with other technologies. ECG electrocardiogram, EMG electromyography, FSR force-sensitive resistor, IMU inertial measurement unit, RFID radio frequency identification, RGB red, green, blue
3.3 Risk of Bias and Applicability AssessmentAll the included models presented with a high risk of bias and most presented with an unclear concern regarding the applicability to the review (n = 36) (Fig. 3; Supplementary Material S2). Briefly, a lack of transparent reporting was evident in many of the reviewed models. Factors contributing to risk of bias included inadequate reporting of sample characteristics (21/49), failure to report sample eligibility criteria (39/49), inadequate reporting of missing data (41/49), failure to report predictors (12/49), inappropriate evaluation of model performance measures (i.e. no evaluation of discrimination and calibration) (48/49), and no internal validation or only split-sample internal validation performed (11/49). Additionally, 24 models were determined to have a small sample size (EPV < 10), and sample size could not be assessed for 25 models owing to inadequate reporting.
Fig. 3
Summary of the overall and domain risk of bias (a) and applicability (b) assessments. Domain one (participants) covers potential sources of bias and concerns related to the applicability of the selected participants and/or sources of data; domain 2 (predictors) covers potential sources of bias and concerns related to the applicability of the definition and measurement of predictors; domain 3 (outcome) covers potential sources of bias and concerns related to the applicability of the definition and measurement of the outcome classified by the model; and domain 4 (analysis) covers potential sources of bias related to the analysis of the outcome [16]. RoB risk of bias
3.4 Inertial Measurement Units (IMUs)3.4.1 SpecificationsInertial measurement units were the most frequently used technology for classifying resistance training exercises (24/49). Studies that used IMUs opted for stand-alone IMUs or built-in sensors, such as those found in modern smartwatches. Sampling rates in the reviewed studies ranged from 10 to 512 Hz. Smaller sampling rates were seen in studies where a good trade-off between accuracy and energy optimisation was a priority (e.g. IMUs sampled at 40 Hz [34]). Collectively, sampling rate did not appear to be related to model performance, but it is worth noting that studies with models that performed the best captured data between 100 and 128 Hz. Of the 24 models that utilised IMU data, individual sensor data consisted of accelerometer data only (n = 6), accelerometer and gyroscope data (n = 8), accelerometer and magnetometer data (n = 2), and accelerometer, gyroscope and magnetometer data (n = 8) (Table 1). Broadly speaking, models that used data from all three sensors appeared to perform best. The number of IMUs that were utilised in these studies ranged between one and five, and were affixed to segments of the upper body (n = 15), upper and lower body (n = 4), or were mounted on an object that was used during exercise (e.g. mounted on a dumbbell [36]) (n = 5). The number of IMUs used appeared to have no effect on model performance. However, some studies showed that utilising sensors on both the upper and lower body (e.g. wrist and ankle [7]) performed better than when devices were worn only on the upper body (Fig. 4). That said, a single IMU on the wrist was the most common location and appeared to offer excellent accuracy, even when lower body exercises were included in the classification problem.
Table 1 Summary of studies that investigated inertial measurement units (IMUs) for the prediction of exercise during resistance training (n = 24)Fig. 4
Overview of reported accuracy measures for inertial measurement unit (IMU)-based models according to the placement of devices and exercises included in the classification problem
3.4.2 Data AcquisitionData acquisition typically took place in a gym facility, although most studies did not report the study setting. In many studies, participants were given specific instructions regarding proper execution (e.g. form and range of motion [33, 34]) of the pre-selected exercises. A less common approach involved unconstrained workouts, where participants performed exercises as usual [21]. The IMU-based models tended to classify small sets of commonly performed free-weight (e.g. dumbbell biceps curl, dumbbell shoulder press), machine-resisted (e.g. lat pulldown, pec dec) and/or bodyweight (e.g. push-up, bodyweight squat) resistance training exercises, with the number of exercises ranging from 3 to 30, with only seven models including more than 10 exercises. Two models classified rehabilitation exercise [9, 56]. The number of exercises in the classification problem did not seem to influence model performance. Similarly, the exercise modality did not appear to influence model performance, as models seemed to perform better or worse regardless of whether exercises were performed using free-weights or machines (or a combination of both), or no external load. The selection of exercise appeared to determine sensor location(s), and this generally allowed for improved model performance when sensors were located on the body segment with the greatest movement during the exercise. However, this was not true for all models. For example, Wu et al. [31], Guo et al. [32] and Burns et al. [9] all positioned IMUs on the upper body and classified exercises targeting the upper body but achieved accuracies of 98.96%, 95.00% and 92.10%, respectively (Fig. 4). The most notable difference between these models is the observed discernability of the classified exercises. The exercises that were included in Wu et al. [31] had movement patterns that would be much easier to differentiate (e.g. biceps curl and shoulder press) than those included in Guo et al. [32] (e.g. barbell bench press and dumbbell bench press) and Burns et al. [9] (e.g. shoulder internal rotation and shoulder external rotation; Table 1), and this finding was consistent across many of the IMU-based models.
3.4.3 Model Development and EvaluationThe algorithms used to build and train predictive models were diverse (Fig. 5). Convolutional neural networks (CNN) were most common for model development, followed by random forest (RF) and dynamic time warping (DTW). Significant variations were noted in the accuracies of models that were reported using the same algorithms. For instance, Burns et al. [9], Jeong et al. [23] and Soro et al. [7] each used CNN, but the accuracies of these models were found to be distinctly different (Fig. 6).
Fig. 5
Overview of the algorithms used to produce predictive models. Bar colour corresponds to the predictive algorithm approach employed in the study: neural networks (green), tree-based (rose), support vector machines (blue), discriminant analysis (yellow), similarity (plum), boosting (grey), k-nearest neighbour (orange), combined methods (black), no information on the classification algorithm used in the study (red)
Fig. 6
Overview of reported accuracy measures according to the technology and algorithm used to produce predictive models. Some models did not report classification accuracy. Bar colour corresponds to the predictive algorithm approach employed in the study: neural networks (green), tree-based (rose), support vector machines (blue), discriminant analysis (yellow), similarity (plum), boosting (grey), k-nearest neighbour (orange), combined methods (black), no information on the classification algorithm used in the study (red). CNN convolution neural networks, DT decision tree, DTW dynamic time warping, IMU inertial measurement unit, k-NN k-nearest neighbour, LDA linear discriminant analysis, LSTM long short-term memory, NN neural networks, NI no information, PNN probabilistic neural network, QDA quadratic discriminant analysis, RF random forest, SVM support vector machines
Models were typically evaluated by splitting the pre-processed dataset into training and test sets. Split-sample internal validation only, or split-sample with k-fold or leave-one-out cross-validation were most common. The predictive performance of the IMU-based models was described using classification accuracy in all but four models, and this was the only measure of model performance calculated in 11 models (Table 1). Only one of the IMU-based models’ performance was quantified using an assessment of discrimination [21]. Other models used measures derived from confusion matrices (12/24), enabling an understanding of prediction accuracy on an individual exercise level. Overall, the IMU-based models reported excellent classification accuracies, typically above 95%.
3.4.4 Other ModelsIn addition to addressing the exercise classification problem, nine studies reported models to predict the number of repetitions completed [7, 21, 26, 28,29,30,31,32, 34], five studies reported models to analyse the users’ exercise form [19, 21, 32, 34, 36] and four studies reported models for other performance metrics, such as weight detection [19, 26], one repetition maximum (1RM) prediction [51], range of motion [34] and repetition time [34]. Of those reporting repetition counting, the mean counting error varied between 0.0 and 0.59 per repetition.
3.5 Accelerometers3.5.1 SpecificationsSome of the reviewed studies used stand-alone accelerometers (6/49). Of these, two were validation only: Oberhofer et al. [37] validated a smartwatch-based exercise analysis app for exercise classification, and Steeves et al. [41] validated a commercially available wrist-worn wearable for exercise classification. Most studies that used accelerometers developed and/or validated models on the basis of built-in accelerometers, such as in wrist or chest straps, and few used independent accelerometers. Sampling rates in the reviewed studies ranged from 30 to 100 Hz, although only four studies reported a sampling rate. On the basis of the available data, it is unlikely that the sampling rate would have a significant impact on model performance; however, this cannot be determined with any certainty. A single accelerometer affixed to the wrist or chest was used in all of the reviewed studies, except one, where five accelerometers were positioned in various locations on the upper body. The number and position of the devices did not appear to influence the performance of the models.
3.5.2 Data AcquisitionData acquisition typically took place in a gym facility or controlled laboratory setting, although only two studies reported the study setting. In all studies, participants were given specific instructions regarding proper execution of the pre-selected exercises. The accelerometer-based models tended to classify small sets (3–14 exercises) of free-weight, machine-resisted, and/or bodyweight resistance training exercises. Two models classified a large set of 42 and 44 free-weight, machine-resisted, and bodyweight exercises, respectively [38, 57]. The number of exercises may have affected model performance with a trend towards poorer accuracy as the number of exercises increased (Fig. 7). Similarly, the models that predicted free-weight exercises appeared to perform better compared with the models that predicted a combination of modalities. When machine-resisted exercises that involve little or no movement in the upper body were included in Hussain et al. [38] (e.g. leg press and leg extension), the model appeared to perform worse than most of the other studies (Table 2).
Fig. 7
Overview of reported accuracy measures for accelerometer-based models according to the number of predicted exercises and exercise modalities
Table 2 Summary of studies that investigated accelerometers for prediction of exercise during resistance training (n = 6)3.5.3 Model Development and EvaluationThe algorithms used to build and train predictive models differed across the studies (Fig. 5). Two studies did not report the algorithm used to produce predictions [37, 41]. Of the studies that developed models, cosine similarity appeared to be the top performing algorithm for classifying resistance training exercise with accelerometers (Fig. 6).
The two validation-only studies externally validated commercially available models, and these were completely independent. The remaining models were evaluated by splitting the pre-processed dataset into training and test sets. Split-sample internal validation-only, or split-sample with leave-one-out or grid search cross-validation were most common. The predictive performance of the accelerometer-based models was described using classification accuracy in all models, and this was the only measure of performance in three models. One model’s performance was assessed using measures derived from confusion matrices [38]. Other measures (Cohen’s kappa, repeated measures analysis of variance (ANOVA), and detection error) were used in two models [40, 41]. Overall, the accelerometer-based models reported good-to-moderate classification accuracies.
3.5.4 Other ModelsIn addition to addressing the exercise classification problem, three studies reported models to predict the number of repetitions completed [37, 40, 41], and one study reported a model for 1RM prediction [37]. Of those reporting repetition counting, the mean counting error varied between 0.008 and 0.25 per repetition.
3.6 Other TechnologiesOther technologies included electromyography (EMG) (n = 3); force-sensitive resistors (FSRs) (n = 2); two-dimensional (2D) red, green, blue (RGB) camera (n = 1); stretch sensor (n = 1); capacitive proximity sensor (n = 1); cellular signal receiver (n = 1); active sonar system (n = 1); and passive radio frequency identification (RFID) tags (n = 1) (Table 3). Owing to the small sample of studies that used these technologies, it is difficult to determine the methodology that may or may not have influenced model performance. However, some differences were noted. Most of the studies that used other technologies reported using custom-built devices, including a smart glove, textile sensor, sensing mat, and signal receiver. Devices were free standing, mounted to an object used during exercise, or were worn on the participant’s upper or lower body. When devices were affixed to the body segment with the most movement during the exercise or were not positioned on the participant, models appeared to perform better (Fig. 8). The models tended to classify small sets (3–13 exercises) of free-weight, machine-resisted, and/or bodyweight resistance training exercises. Two models classified a large set of 30 free-weight, machine-resisted, and bodyweight exercises [10, 55]. The algorithms employed across studies that used other technologies were diverse, with most using a different algorithm (Fig. 5). Of these, the SVM algorithm using input data obtained from a 2D RGB camera had the best performance among the studies that utilised other technologies (Fig. 6). The predictive performance of the models was described using classification accuracy in all but two of the models. Measures derived from confusion matrices were also commonly used to evaluate the models’ performance (6/10).
Table 3 Summary of studies that investigated other technologies for prediction of exercise during resistance training (n = 11)Fig. 8
Overview of reported accuracy measures for other technologies according to the placement of technologies and exercising body segment. EMG electromyography, FSR force-sensitive resistor, RGB red, green, blue, RFID radio frequency identification, 2D two-dimensional
3.6.1 Other ModelsIn addition to addressing the exercise classification problem, five studies reported models to predict the number of repetitions completed [8, 43,44,45, 48], and three studies reported models for other performance metrics, such as repetition time [
Comments (0)