
Remember me
With the advent of biologics, early detection of synovitis and tenosynovitis in peripheral arthritis, such as rheumatoid arthritis and psoriatic arthritis, has become increasingly important [20]. By the detection of subclinical inflammation and early treatment initiation, the development of irreversible structural changes can be prevented [21]. However, imaging standardization and reliable exclusion of differential diagnoses are required.
CT provides high spatial resolution and thin-slice multiplanar reconstructions, making it well suited for evaluating small, distal structures such as the DIP joints, nailbeds, and their ligamentous and enthesial complexes—common sites of involvement in psoriatic arthritis [6]. This rationale underpins our inclusion of periungual soft tissues in the analysis. Inflammation in PsA primarily targets the synovio-entheseal complex, including the extensor tendon insertion at the nailbed, where it is linked to psoriatic nail changes—often the first or only sign of the disease [22,23,24]. Because this inflammation frequently extends into adjacent soft tissues, periungual regions are important to assess [25]. CT also provides more detailed information about bones and calcified tissues. CT is considerably more sensitive than MRI and ultrasound when it comes to the detection of early erosions, a hallmark of disease progression in erosive arthritis [20].
Spectral CT is an advanced imaging technique that is gaining increasing prominence in musculoskeletal imaging. Spectral data can be acquired using dual-energy CT (DE-CT) or multienergy photon-counting detector CT systems. Using this spectral data, iodine maps can be constructed, which provide much better iodine contrast resolution compared to conventional contrast-enhanced CT images at higher spatial resolutions. They quantitatively reveal the presence of iodine in synovial and tenosynovial tissues, serving as a marker of hypervascularization often associated with inflammatory activity (Fig. 4).
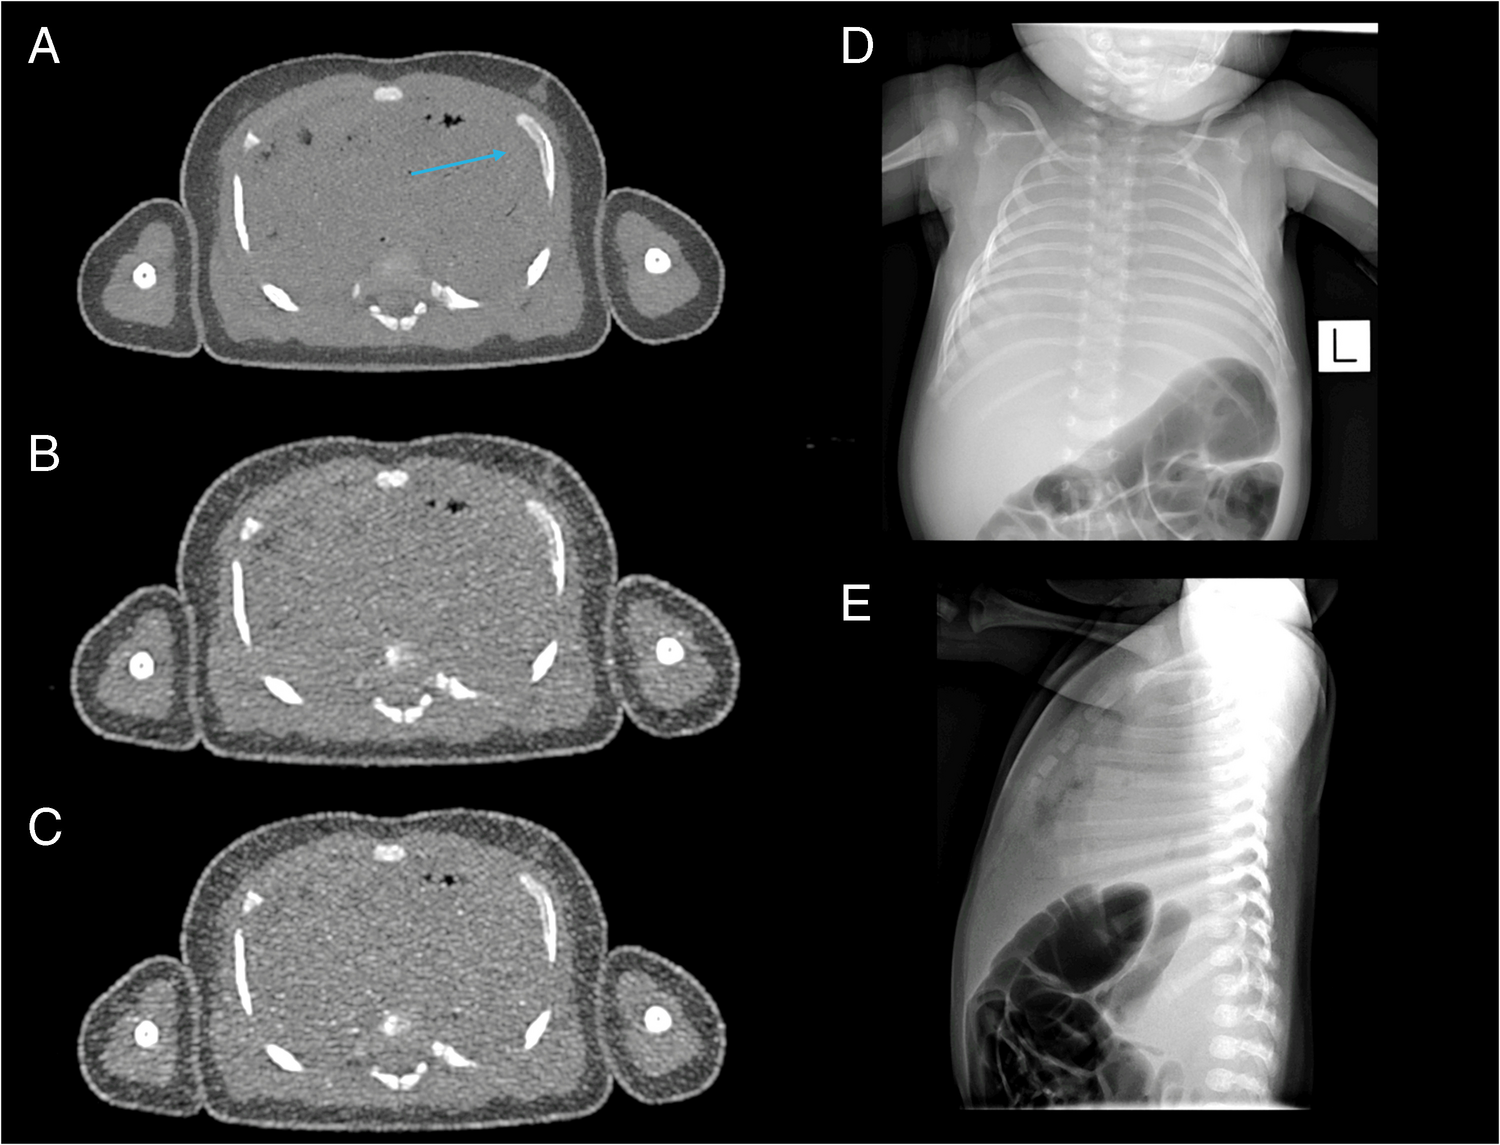
Fig. 4
Typical findings in inflammatory peripheral arthritis seen on our PCD-CT images. PCD-CT iodine maps provide high iodine contrast, accurately delineating inflammation, while also displaying bones with high resolution. Synovitis appears as areas of high iodine concentration, represented in red, reflecting thickened and hypervascular synovium, as demonstrated in images A1–A4. This thickening is often nodular due to pannus formation, as seen in A3 (right arrow). Tenosynovitis exhibits similar imaging characteristics to synovitis, with high iodine concentration indicating inflammation, as shown in B1–B5. Periungual soft tissue inflammation, characteristic of psoriatic arthritis, is evident on PCD-CT iodine maps, as demonstrated in C1. In this particular case, the inflammation was detected exclusively on PCD-CT, as neither ultrasound nor MRI identified it. Periostitis, appearing as juxtaarticular new bone formation, also characteristic of psoriatic arthritis, is visible on PCD-CT images (C2), and this finding was also uniquely detected with PCD-CT. Cortical bony erosions of varying shapes and sizes, indicative of longstanding arthritis, are well demonstrated in C3 and C4. CT remains the most sensitive imaging modality for detecting erosions, which serve as a critical marker of disease progression. MRI, magnetic resonance imaging; PCD-CT, photon-counting detector CT
Ulas et al. demonstrated that iodine mapping has similar sensitivity and specificity to contrast-enhanced MRI in the detection of synovitis and tenosynovitis in arthritis of the hand [26]. Paired with high spatial resolution, DE-CT can differentiate between various inflammatory patterns in different arthritis, aiding in the early selection of the appropriate treatment [6]. Additionally, through material decomposition techniques, DE-CT can detect gouty tophi and bone marrow edema, further supporting accurate diagnosis [27, 28]. CT has also been shown to have a greater capacity at identifying differential diagnoses than MRI in the context of peripheral arthritis [29].
Previous studies have highlighted the utility of iodine maps in detecting soft tissue inflammation in peripheral arthritis. However, they have not established a recommended post-contrast scan timing. Ulas et al. described that contrast-enhanced DE-CT techniques and MRI perform equally well in arthritis imaging; they utilized a 180-s scan after contrast administration [26]. Diekhoff et al. also applied a 180-s model and concluded that ultra-low-dose CT imaging allows for the detection of soft tissue inflammation [29]. Fukuda et al. used a shorter 120-s protocol to prove that DE-CT is suitable to detect inflammatory activity in PsA patients [7]. Kayama et al., who demonstrated that the DE-CT iodine map is a valuable tool for quantitative assessment of therapeutic response in PsA, also utilized 120-s post-contrast measurements [30].
Here, we analyzed for the first time the optimal time point for post-contrast spectral PCD-CT scanning to visualize inflammatory activity in arthritis patients. We found no significant difference (p > 0.05) in the enhancement values of inflamed synovial, tenosynovial, and periungual soft tissues across the investigated (120, 180, 240 s) phases after intravenous iodine contrast administration (Fig. 3A, Supplementary Table 1). Inflamed tissues appeared equally enhancing on all post-contrast phases (Fig. 5A–C rows). The apparent differences in enhancement noticeable in Fig. 5 were due to the normalization of iodine maps to blood vessels, which showed a gradual decrease in contrast concentration with each subsequent phase. This effect could be eliminated by adjusting the windowing of the color map.
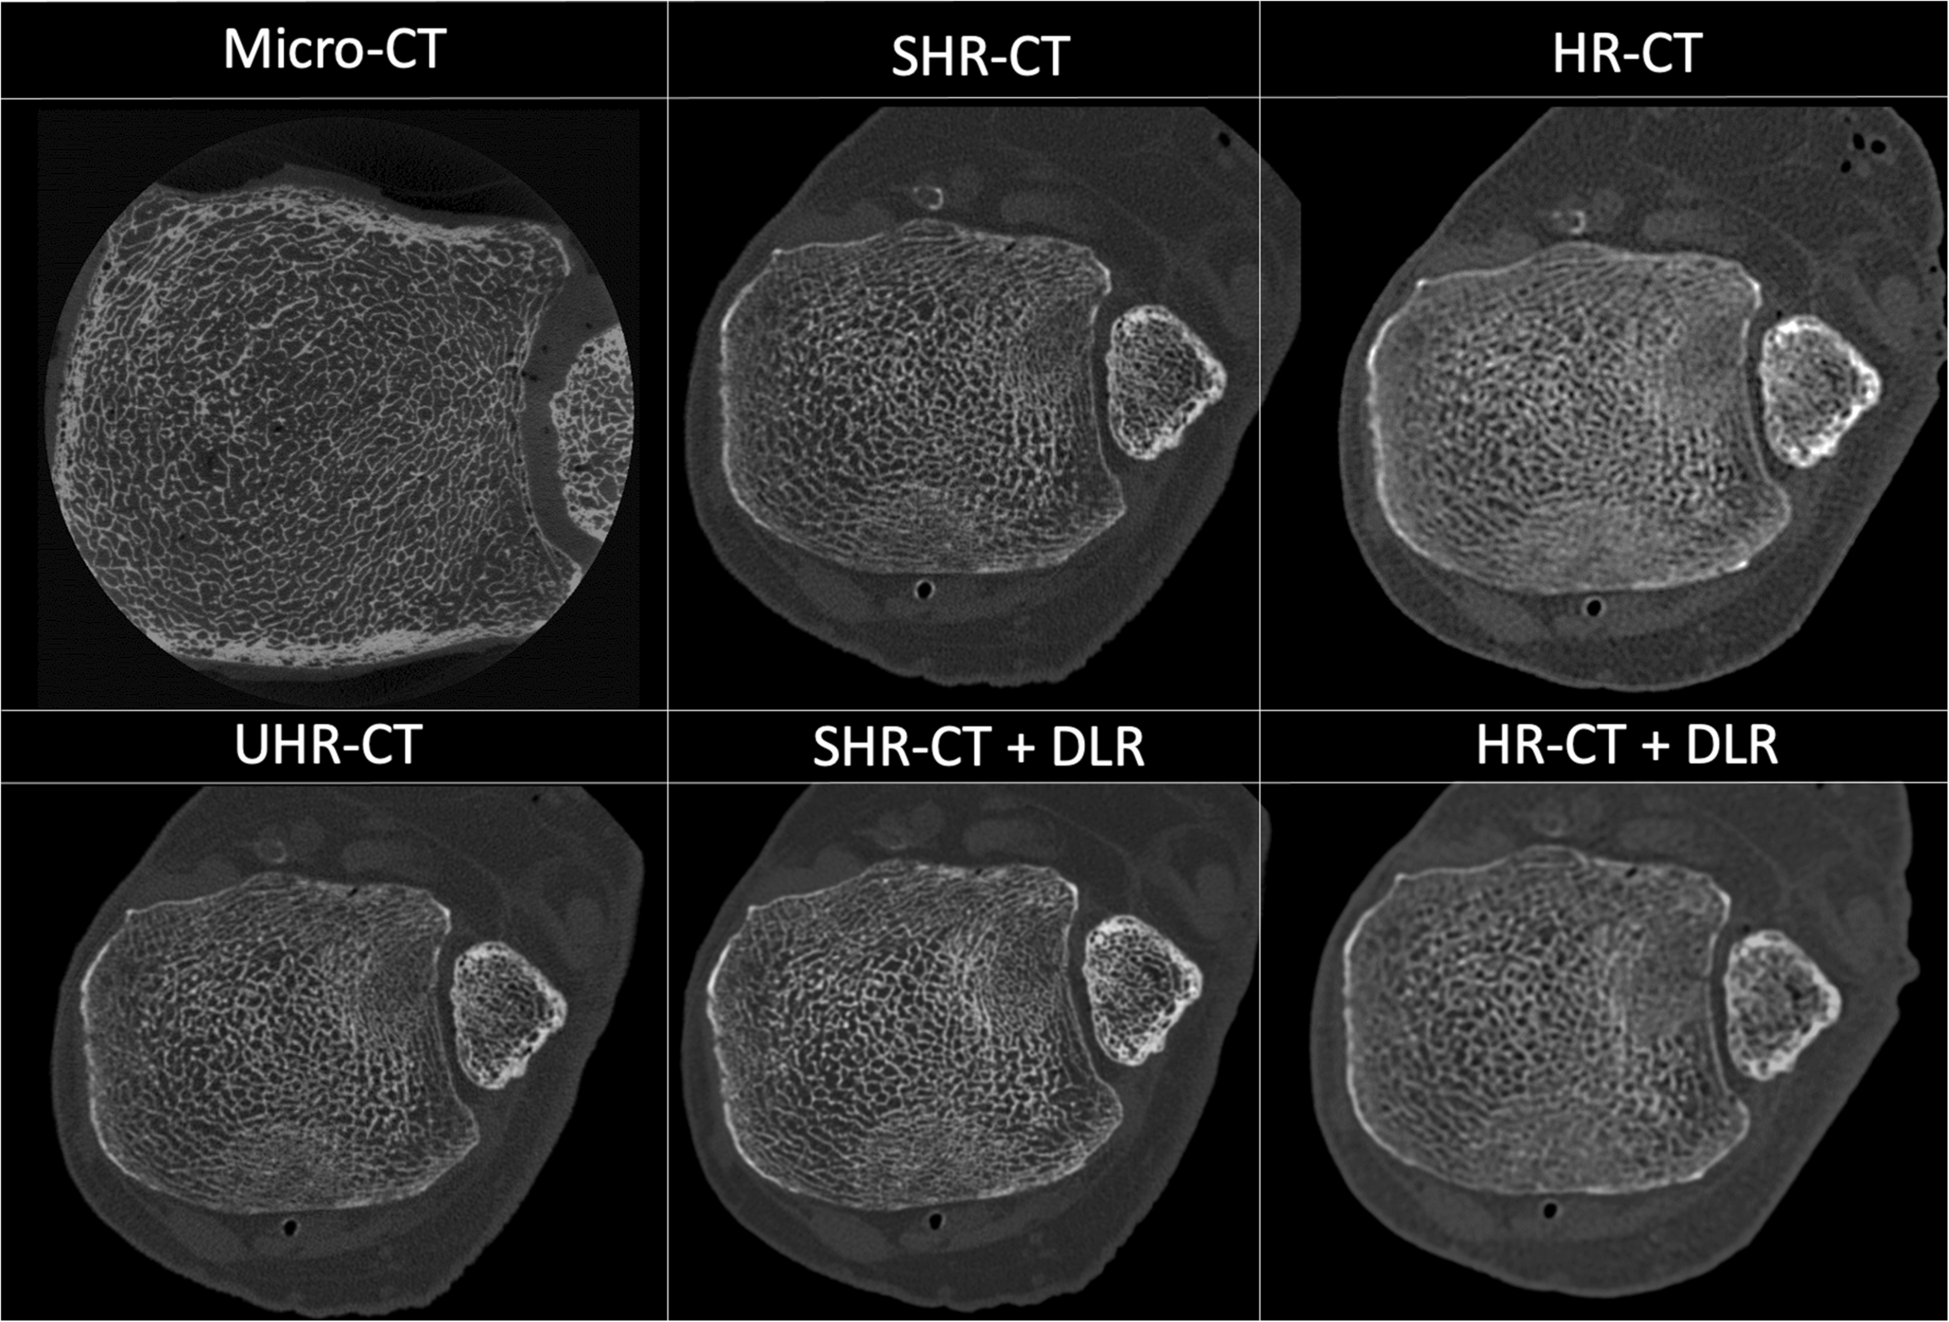
Fig. 5
Appearances of enhancing inflamed synovial and tenosynovial structures, as well as contrast in enhancement between vessels and inflamed tissues across native and investigated post-contrast phases seen on PCD-CT iodine maps. In the native phase, inflamed synovial and tenosynovial structures show no enhancement (A1, B1, C1). As for the post-contrast phases, they display very similar enhancement intensities and spatial distributions of inflammation across each phase. The apparent differences in enhancement observed between the 240-s phases and the earlier ones are due to the normalization of the iodine map’s color coding to an enhancing vessel, which gradually washes out. This effect can be corrected by manually adjusting the windowing, enabling more or less color to be attributed to the same iodine concentration values. The greatest contrast between enhancing vessels and inflamed tissues was seen in the 120-s phase, as demonstrated by rows D and E. CMC, carpometacarpal; PCD-CT, photon-counting detector CT; sec, second
Synovial neoangiogenesis can be observed in immune-mediated arthritis. Because of the enhanced, abnormal type of vascularization, vasopermeability increases [31, 32]. Potentially, this phenomenon contributes to the increased diffusion and slow washout of contrast agent into the inflamed synovial tissues. No specific studies were published about this phenomenon before. Based on CE MRI measurements, synovial enhancement reached its maximum 12 min after intravenous contrast administration [33].
When comparing the enhancement of interest structures to that of control structures, the 120-s post-contrast phase provided the greatest contrast between enhancing blood vessels and inflamed structures (Fig. 5D and E rows). This can be explained by the observation that while enhancement values in inflamed structures remained stable, vascular enhancement gradually decreased, approaching that of inflamed tissues. In our experience, this phenomenon may aid the evaluation of subtle inflammation, where distinguishing inflamed synovium from adjacent small arteries can be challenging. It could enhance diagnostic confidence in early disease and support more objective assessment of treatment response, particularly in small distal joints. Muscle tissue and fat exhibited the same differentiation from interest structures across all post-contrast phases.
All interest and control structures maintained the same mean density across the native and the three post-contrast phases. This suggests that our measurement points were consistently positioned in the same locations across all phases (Fig. 3B).
The anatomical distribution of inflamed structures in our patients aligned with their diagnoses. Our work affirms previous studies that iodine mapping is a useful tool in detecting inflammatory activity in arthritis patients [6, 7, 29, 30].
The most important concern when using CT is radiation exposure. With low-dose CT protocols, the effective dose is often comparable to conventional radiography. PCD-CT allows for the simultaneous acquisition of both regular and spectral CT data, enabling detailed assessment of osseous structures and iodine mapping. This technique offers reduced effective dose values compared to conventional energy-integrating detector (EID) CT. An added value of the investigated PCD-CT technique is that it significantly reduces the impact of beam hardening artifacts compared to conventional CT, and high- or even ultra-high-resolution imaging is also available. In addition, low-energy photons contribute more to the image contrast in PCD-CT, upgrading the image contrast-to-noise ratio of iodine-based contrast materials. The effective dose value in our study was 0.028 mSv for each post-contrast phase. If just one post-contrast phase is utilized, like we concluded, further dose reduction could be achieved.
All in all, CT is a quick, standardized procedure that enables high-resolution 3D imaging. It could serve as a good alternative for those who cannot bear the lengthy examination times or who are contraindicated for MRI and is generally the preferred modality by patients [34]. Figure 6 compares the appearances of common pathologies in peripheral arthritis across PCD-CT iodine maps, MRI, and ultrasound, as observed in our patients.
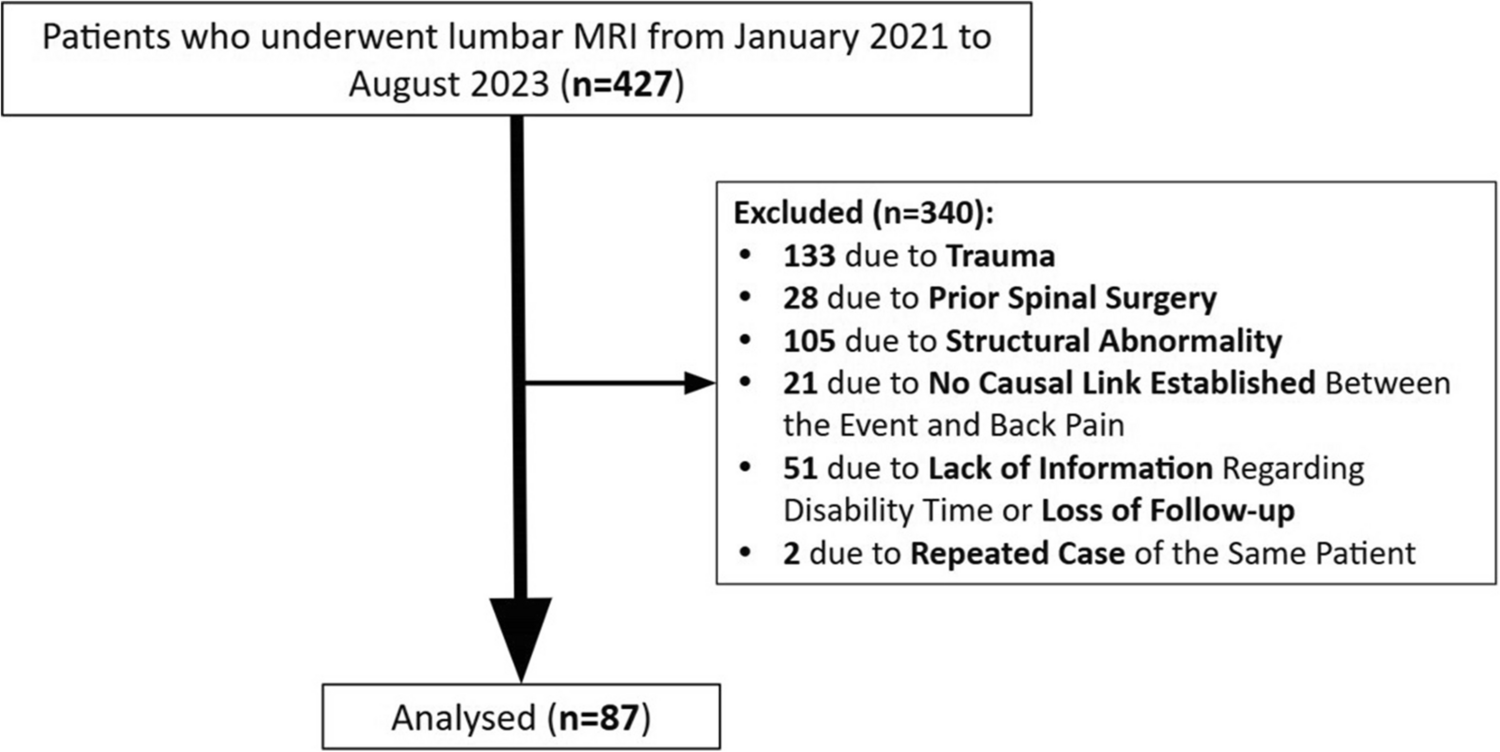
Fig. 6
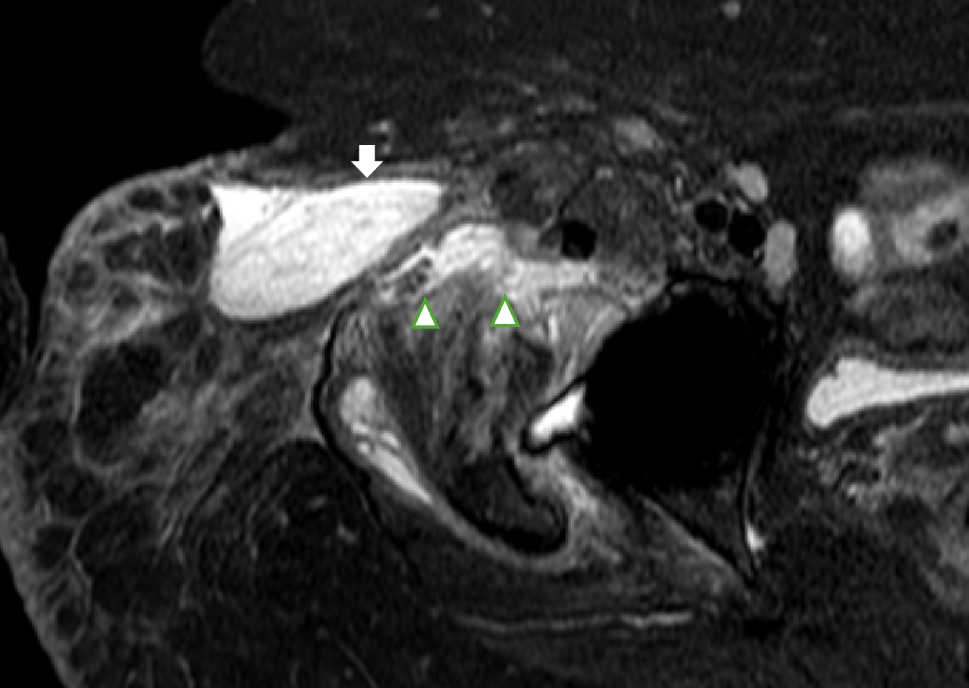
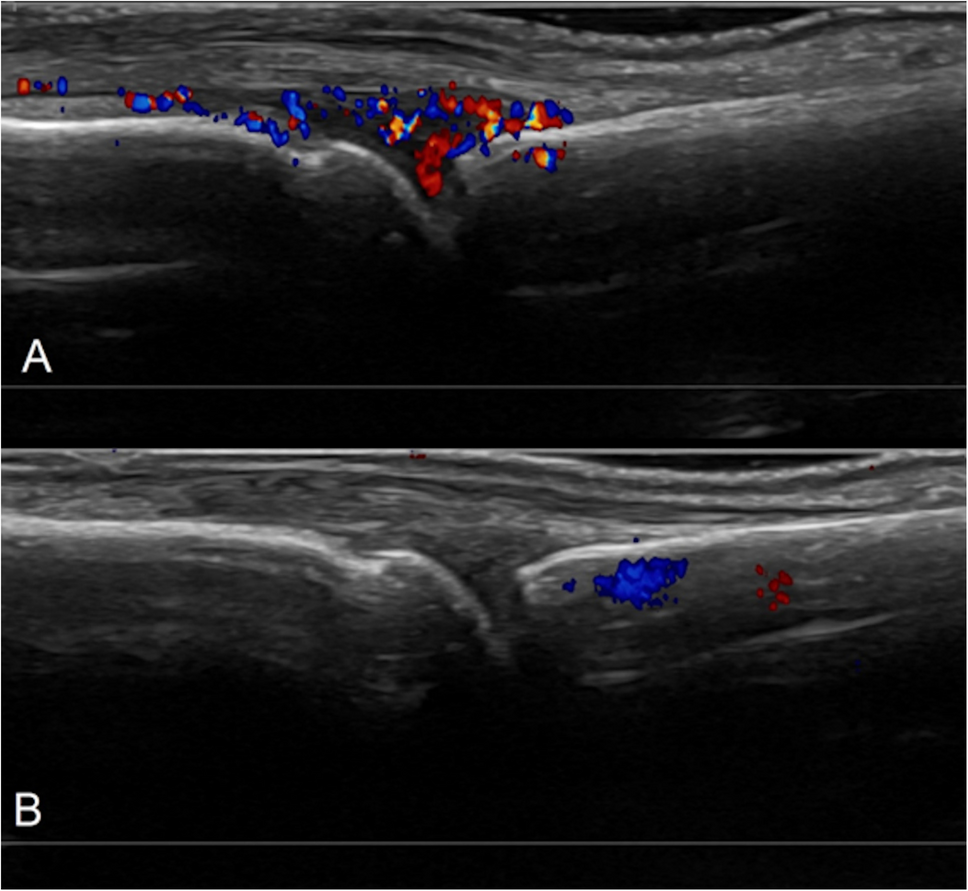
Comparisons of common pathologies in the same patients across different modalities used in the investigation of peripheral arthritis. On PCD-CT iodine maps, synovitis and tenosynovitis appear as areas of thickened synovium and tenosynovium with high iodine concentration, represented in red on the color map. On PD MRI sequences (A2, B2, C2), these pathologies present as high-signal fluid within the joint capsule or around the tendon, thickened synovium with intermediate signal intensity, and enhanced contrast uptake on post-contrast sequences (D2). In some cases, inflammation is more conspicuous on iodine maps than on contrast-enhanced MRI, particularly in distal digital structures, due to higher spatial resolution, improved contrast, and reduced motion artifacts (D1 and D2). Ultrasound reveals intraarticular and peritendineal fluid accumulation, thickened synovium, and hypervascularity, which is highlighted on Doppler imaging. PCD-CT iodine maps provide a comprehensive and standardized overview of the affected hand while delineating inflammation with great contrast and high resolution, minimizing study duration and artifacts and allowing for the sensitive detection of bony changes at the same time. CMC, carpometacarpal; ECU, extensor carpi ulnaris; IP, interphalangeal; MCP, metacarpophalangeal; MRI, magnetic resonance imaging; PCD-CT, photon-counting detector CT; PD, proton density; US, ultrasound
The limitations of our study were the size of the cohort, the single-center study design, and the lack of a histopathologic reference standard, as well as a healthy control group. Also, no contrast-enhanced MRI and CT comparisons were made. To extend our observations, the comparison of different DE-CT and PCD-CT protocols could serve valuable information. Also, the comparison of asymptomatic volunteers to symptomatic rheumatological patients could provide substantial data but raise ethical questions. A follow-up study would also yield valuable results.
To conclude, spectral PCD-CT imaging is a fast and comprehensive imaging method to analyze peripheral inflammatory activity in immune-mediated arthritis, while radiation exposure remains low when peripheral joints are imaged. CE PCD-CT measurements could help clinical decision-making—such as improving early diagnosis, guiding treatment selection, or reducing unnecessary follow-up imaging.
Our study found that the enhancement of inflamed joints, tendons, and periungual soft tissues in peripheral arthritis remains stable between the 120- and 240-s delay phases, indicating the need for broader time points to further characterize the dynamics of inflammatory enhancement. However, the 120-s delay phase provided the greatest contrast between inflammation and surrounding vascular structures, which may enhance diagnostic confidence in more subtle cases. Evaluating later phases may reveal greater contrast between inflamed tissues and muscle, potentially further improving diagnostic certainty.
Comments (0)