Participants
The sample for this study was the same as that used in validating the Spanish NEL [19]. All participants were adults (≥ 18 years old) and users of community mental health services (n = 406); that is, individuals diagnosed with severe mental disorders who receive daily or weekly professional support through individual and group activities to promote personal and functional recovery, but who are not experiencing an acute or subacute mental health crisis. The exclusion criteria were the presence of relevant cognitive impairments, comprehension difficulties, or severe and decompensated somatic disease.
Instruments
Spanish version of the Netherlands Empowerment List (Spanish NEL) [19]. This scale is an adaptation of the NEL [11] and comprises 40 items rated on a 5-point Likert-type scale (1 = Completely disagree; 5 = Completely agree). The original NEL had a six-factor structure encompassing the following domains: confidence and purpose, self-management, connectedness, social support, caring community, and professional help. It demonstrated excellent internal consistency (Cronbach’s α = 0.94), good test-retest reliability (ICC = 0.79), correlation with other variables in the expected direction and magnitude, and good responsiveness [11]. The Spanish NEL displayed an excellent fit to both the original six-factor structure and a one-factor second-order model comprising six first-order factors and one second-order general factor. Its total score showed excellent internal consistency (McDonald’s ω = 0.98, Cronbach’s α = 0.96), high temporal stability (ICC = 0.86), and strong positive correlations with scores on the Empowerment Scale [14], the Maryland Assessment of Recovery Scale [23], the Dispositional Hope Scale [24], and the Multidimensional Scale of Perceived Social Support [25, 26].
Maryland Assessment of Recovery Scale (MARS-12) [23]. This is a 12-item scale designed to measure recovery across six factors: self-direction/empowerment, holistic, non-linear, strengths-based, responsibility, and hope. Each item is rated using a 5-point Likert-type scale (1 = Not at all; 5 = Very much). The recently validated Spanish version demonstrated adequate psychometric properties [27]. In our sample, the MARS-12 total score exhibited excellent internal consistency (McDonald’s ω = 0.95; Cronbach’s α = 0.95).
Dispositional Hope Scale (DHS) [24]. This scale comprises 12 items (four of which are fillers) distributed across two factors: pathway and agency (four items each). Items are rated using a 4-point Likert-type scale (1 = Definitely false; 4 = Definitely true). The validated Spanish version showed appropriate psychometric properties [28], and in the present sample, the DHS total score displayed excellent internal consistency (McDonald’s ω = 0.92; Cronbach’s α = 0.93).
Multidimensional Scale of Perceived Social Support (MSPSS) [25, 26]. This 12-item scale assesses perceived social support across three factors: family, friends, and significant others. The MSPSS employs a 7-point Likert-type scale (1 = Very strongly disagree; 7 = Very strongly agree), and good reliability and validity were reported for the Spanish adaptation [29]. In our sample, the MSPSS total score likewise showed excellent internal consistency (McDonald’s ω = 0.98; Cronbach’s α = 0.94).
For all the above scales, total scores are calculated by summing the scores of all items (with the exception of the DHS filler items), and a higher score indicates a higher level of the variable being assessed.
Procedure
All users of 17 community mental health services who met the inclusion criteria were invited to participate, and all those who provided informed consent were included in the study.
This study was conducted in two phases. Phase 1 was aimed at developing a shortened version of the Spanish NEL based on the factor loadings of its items, while Phase 2 involved evaluating the psychometric properties of this short form.
To this end, we split the sample into a development subsample and a validation subsample. The former consisted of 200 participants with a mean age of 47.29 years (SD = 10.02; range 20–68), while the latter comprised 206 participants with a mean age of 48.34 years (SD = 9.65; range 20–71).
All participants were invited to attend a retest session one or two weeks after the first data collection to assess temporal stability. Of these, 66 attended the second session, completed the Spanish NEL again, and were directly assigned to the validation subsample. All other participants for both subsamples were randomly selected until the pre-established sample size was reached. The sociodemographic characteristics of both subsamples are presented in Table 1.
Table 1 Sociodemographic characteristics of the development and validation subsamples and the total sampleParticipants did not receive any financial compensation. All procedures adhered to the ethical standards of the Declaration of Helsinki and its subsequent amendments The study was approved by the Bioethics Committee of the University of Barcelona (Institutional Review Board Number: IRB00003099).
Statistical analysis
All data analyses were conducted using R 4.2.2, specifically with the packages lavaan [30] for CFA, lordif [31] for DIF analysis, irr for calculating ICC [32], and psych [33] for the remaining analyses.
In developing the short form, we used the development subsample (n = 200) to analyze data distribution at the item level, including median, skewness, and kurtosis. We also calculated the mean, standard deviation, and Shapiro-Wilk normality test for the total score.
To determine the adequacy of data for dimensionality analysis, we calculated the Kaiser-Meyer-Olkin (KMO) index and applied Bartlett’s test of sphericity. The KMO results were interpreted according to the criterion proposed by Howard [34] considering values above 0.70 as an acceptable range of variance. We then performed a one-factor exploratory factor analysis (EFA) using unweighted least squares (ULS) analysis for factor extraction. We used the ULS estimator for the EFA based on the polychoric correlation matrix, which has shown to provide more accurate and stable parameter estimates, and more precise standard errors than diagonally weighted least squares (DWLS), even under challenging conditions such as moderate to high skewness, low factor loadings, and a small number of indicators per factor [35]. Following the recommendations of Hair et al. [36] all items with a factor loading ≥ 0.70 were retained.
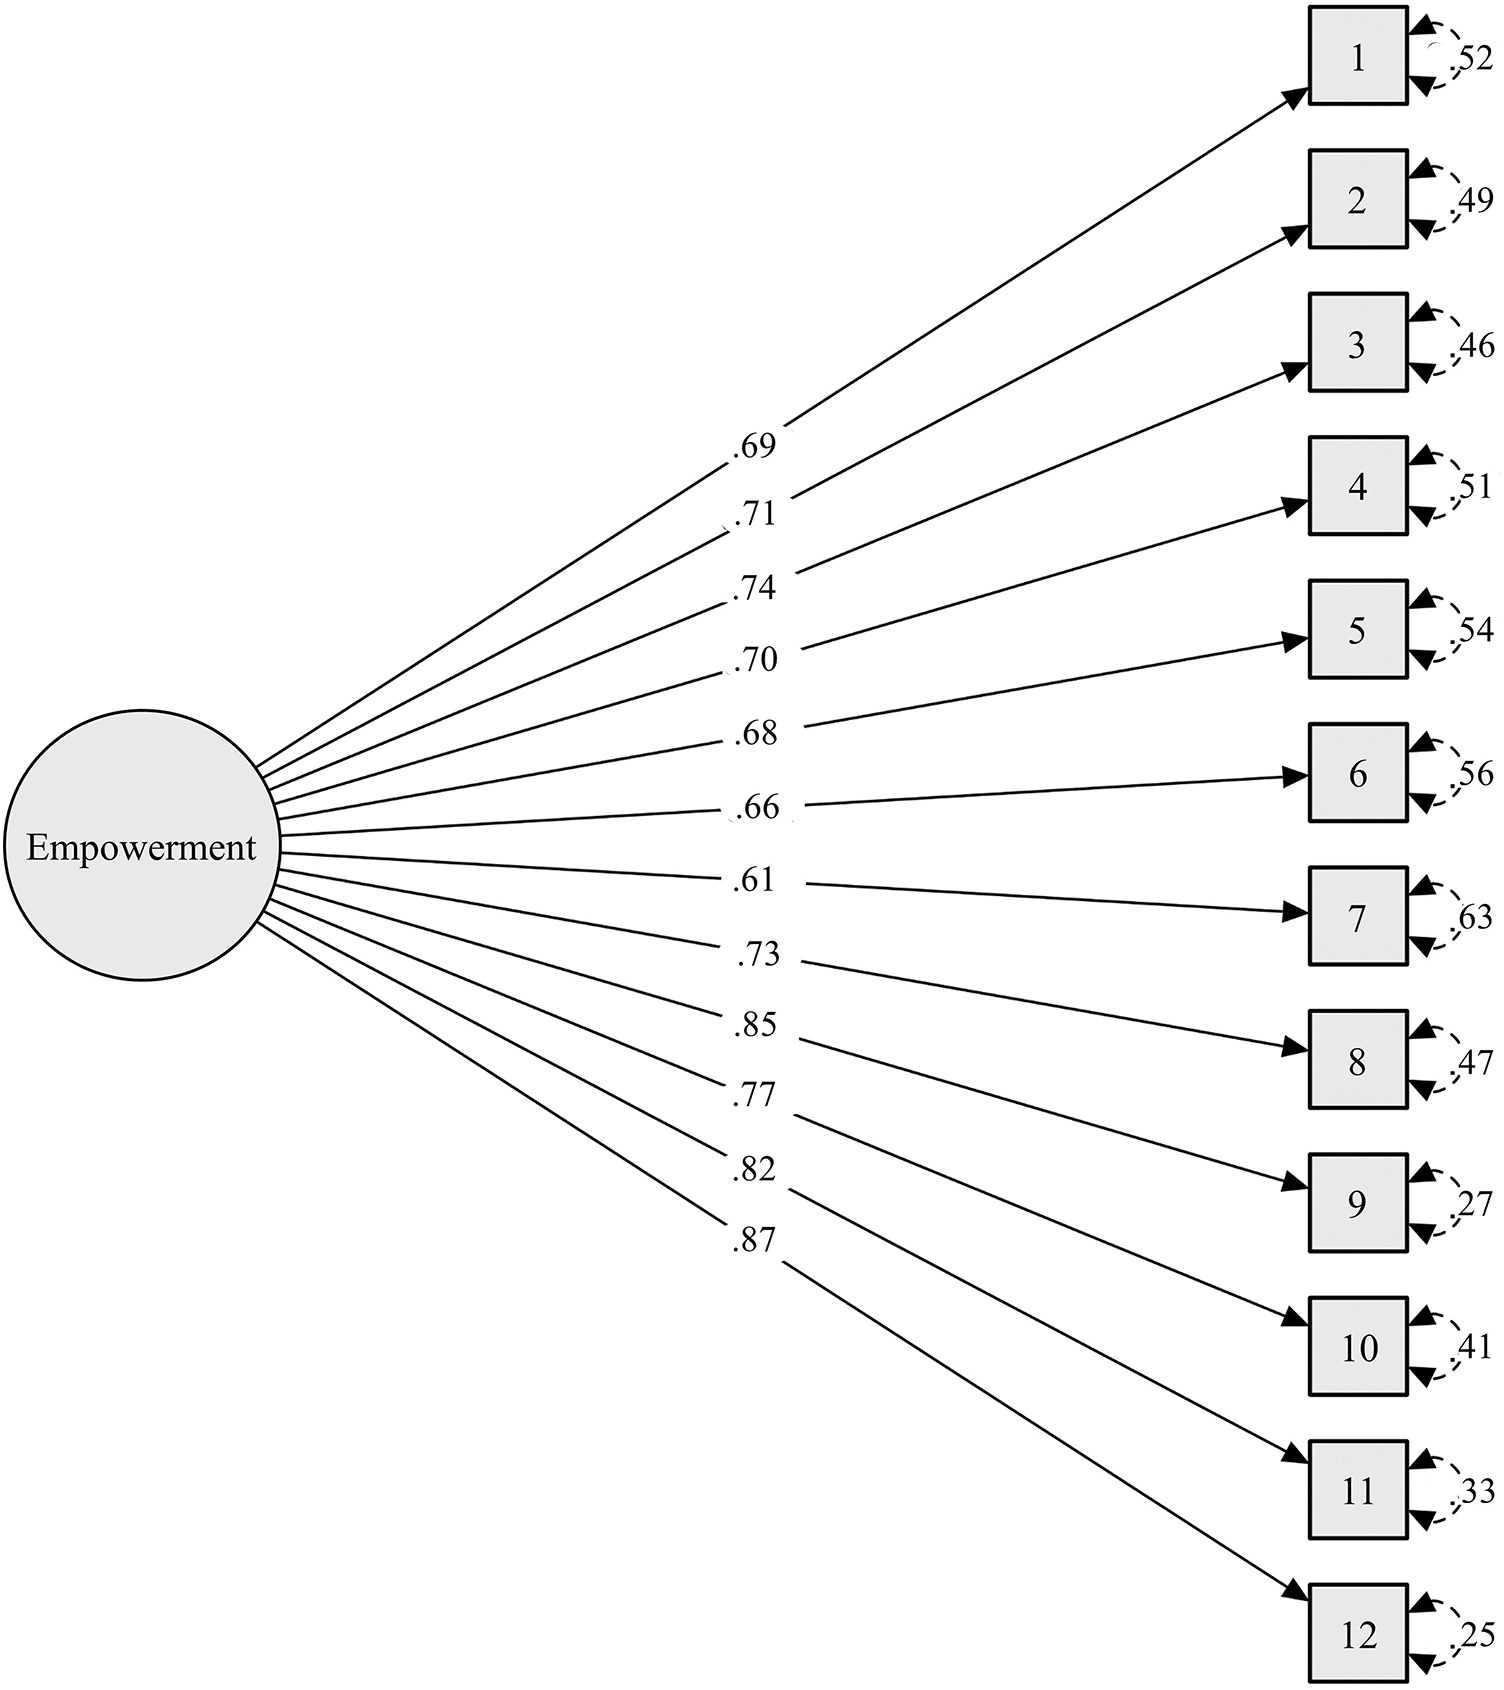
With the validation subsample (n = 206), we again analysed data distribution at the item level, including response frequency for each category, skewness, and kurtosis. We also calculated the mean, standard deviation, and the Shapiro-Wilk normality test for total scores on the short form of the Spanish NEL. A confirmatory factor analysis (CFA) was performed to confirm the unidimensional structure of the scale, using the weighted least squares mean and variance adjusted (WLSMV) estimator. Model fit was assessed using the chi-square test, the comparative fit index (CFI), the Tucker-Lewis index (TLI), and the standardized root mean squared residual (SRMR). According to Hu and Bentler [37], a CFI value ≥ 0.95, TLI ≥ 0.96, and SRMR ≤ 0.09 are indicative of adequate fit. We also report the chi-square/degrees of freedom ratio (χ2/df), with a ratio less than 3 being interpreted as indicating an acceptable fit of the data to the model [38].
Differential item functioning (DIF) by gender was explored using the ordinal logistic regression method [31]. For interpreting the effect size, which aids in understanding the magnitude and direction of DIF, we adhered to the recommendations of Jodoin and Gierl [39], whereby an effect size less than 0.035 indicates negligible DIF.
We also assessed the overall impact of DIF at the test level through differential test functioning (DTF) analysis, in this case using the approach proposed by Chalmers et al. [40], which involves calculating both signed DTF (sDTF) and unsigned DTF (uDTF). sDTF measures the direction and magnitude of DTF, indicating whether there is a systematic advantage or disadvantage for one group over another, while uDTF provides a measure of the total magnitude of DTF, regardless of direction. In both cases, we considered a value above 1 as a non-negligible difference.
Internal consistency for the total score on the short form of the Spanish NEL was assessed by calculating both McDonald’s omega (ω) and Cronbach’s alpha (α) for ordinal variables. Kline’s [41] recommendations were followed for interpreting internal consistency values, with coefficients over 0.90 considered excellent, 0.80 to 0.89 very good, and 0.70 to 0.79 adequate.
Temporal stability for the total score was estimated using the intraclass correlation coefficient (ICC), using the two-way mixed effects with absolute agreement, and interpreted according to the criteria of Koo and Li [42]: excellent if above 0.90, good from 0.75 to 0.89, moderate from 0.50 to 0.74, and poor if below 0.49.
To provide evidence of convergent validity, Spearman correlation coefficients were calculated to assess the relationship between scores on the short form of the Spanish NEL and other variables, by correlating its total score with the total scores on the MARS-12, DHS, and MSPSS. Given that empowerment, hope, and social support (connectedness) are key components of recovery according to CHIME framework [5] we expected positive correlations between the Spanish NEL scores and these measures: strong correlation with MARS-12 (i.e., recovery) and DHS (i.e., hope), and moderate correlation with MSPSS (i.e., social support) [43, 44]. Moreover, the total score on the Spanish NEL and its factors was compared with the total score on the short form of the same instrument.
Finally, to provide a preliminary guide for interpreting the Spanish NEL short-form scores for users of community mental health services, we calculated the percentile rank corresponding to each raw score using the total sample. We followed the standard procedure for transforming raw scores into percentile ranks [45], as well as the interpretation guidelines suggested by Cohen et al. [46]; that is, percentiles lower than 16 are indicative of below-average levels of empowerment, while percentiles greater than 84 indicate above-average levels.

Comments (0)