
Remember me
The change of refractive index of films from liquid to solid is shown in Fig. 2. During the drying process, the transition from liquid to solid can lead to the formation of small air bubbles within the material. These microbubbles can cause local variations in the refractive index, thereby reducing the accuracy and reliability of the measurements. Bubbles are particularly problematic in optical measurements, as they scatter and distort light, which can affect the refractive index values obtained with a refractometer. To minimize the impact of bubbles on the measurements, the samples were carefully prepared and leveled before testing. The refractive index of Unica Akva lacquer, Unica Super 90 lacquer, Color C46 Clear varnish, Loctite 60 s glue, and Loctite Super glue changed from 1.382 to 1.484, from 1.473 to 1.519, from 1.438 to 1.482, from 1.443 to 1.452, and from 1.444 to 1.446, respectively. It is evident that an increased refractive index positively influences the material’s reflective properties. The refractive index of a material is fundamentally influenced by its chemical composition [16]. Different functional groups impact the refractive index in unique ways. In addition, even with identical chemical compositions, atoms can have various energetic arrangements, meaning that they can exhibit different coordination patterns. At certain density levels, the type of chemical bonding—whether ionic or covalent—markedly impacts on the material’s refractive index [17]. A 0.1-unit change in a material’s refractive index indicates a subtle but distinguishable alternation in its light-refracting capability, affecting optical qualities like transparency, reflectivity, and light transmission efficiency. Such a slight change can substantially impact on the material’s functional and the aesthetic quality, underscoring the importance of precise adjustment of refractive index for optimizing material’s performance and achieving the desired outcome and its application.
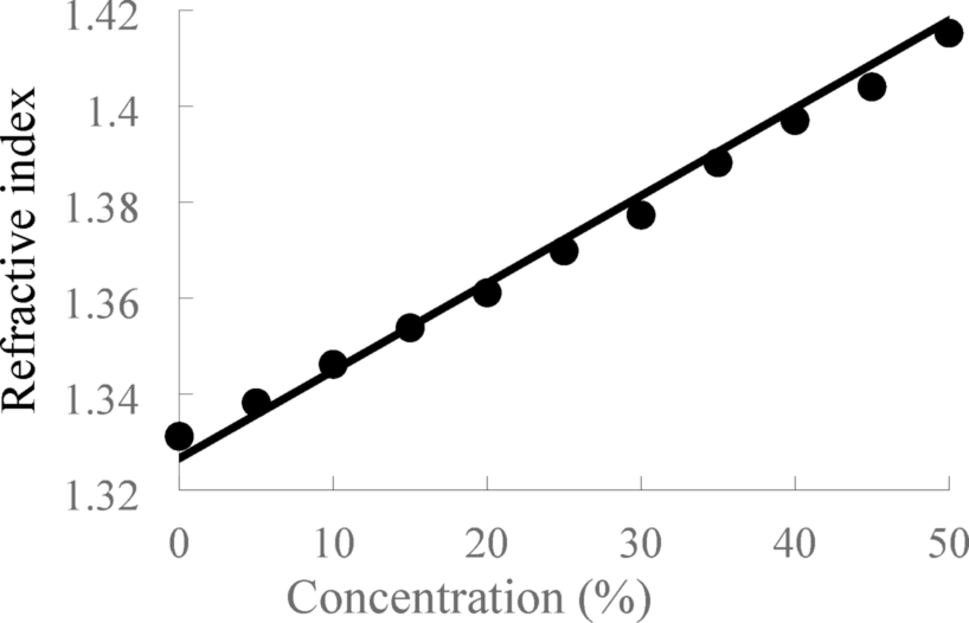
Fig. 2
Refractive indices of the films as a function of drying process time as measured by the Krüss DR6100-T refractometer at 589 nm
It can be seen from Fig. 2 that Unica Akva Lacquer and Unica Super 90 Lacquer exhibit a gradual increase in refractive index over time, suggesting an increase in density or changes in composition as they dry. However, the relationship between refractive index and drying time for these lacquers is not linear. According to research by Brun et al. [3] and Yokota et al. [18], the drying process of lacquers typically progresses through two distinct phases: the constant rate period and the falling rate period. During the constant rate period, the weight of the lacquer film decreases linearly due to solvent evaporation from the surface.
As the drying process continues, the surface of the film begins to solidify, leading to a slow evaporation rate and a nonlinear change in optical properties as the varnish cures.
Refractive indices of Loctite 60 Sec Glue and Loctite Super Glue remain fairly constant throughout the drying process. This stability indicates that their optical properties do not significantly change during the rapid setting process, highlighting their suitability for applications requiring quick and stable optical performance. The refractive index of Color C46 Clear Varnish increases steadily over time, which can be attributed to the formation of a denser and more structured material as it dries. This increase in refractive index reflects the varnish’s transition from a less-ordered to a more-ordered state, enhancing its durability and optical clarity. Unfortunately, the literature contains limited information on the precise values of the true refractive index of adhesives and varnishes as they transition from a liquid to a solid state. Despite the significance of these changes, the literature provides limited data on the precise refractive index values of adhesives and varnishes during their transition from a liquid to a solid state. However, there are notable studies that have investigated this aspect. For instance, Kyriazis et al. have studied an epoxy whose refractive index changes significantly during curing [19]. Similarly, Niskanen et al. have examined the refractive index of varnish (Mr. Color C46 Clear) during the drying process where the refractive index change was from 1.4381 to 1.4834 at 589 nm [20]. These findings reinforce the notion that the refractive index of adhesives and varnishes is a crucial parameter that undergoes significant transformations during the curing process, influenced by both chemical and physical changes in the material.
These observations also highlight the complexity of drying dynamics, where surface and internal drying may progress at different rates. While surface measurements of refractive index provide valuable real-time insights into the drying state of the exposed layer, differences may exist between surface and internal drying, particularly in thicker films or coatings with slower solvent evaporation rates. The drying process typically moves from the surface inward, meaning that surface measurements might indicate full drying, even though internal layers remain partially wet or structurally unstable. This effect becomes particularly pronounced during the transition from the constant rate period to the falling rate period, where solvent evaporation slows, and internal diffusion becomes the primary drying mechanism.
In this study, refractive index measurements primarily reflect surface drying conditions. Future research should complement these findings by integrating internal characterization techniques, such as ultrasound reflection, nuclear magnetic resonance (NMR), or cross-sectional microscopy, to assess the drying state throughout the entire thickness of coatings. Combining these methods would enhance the understanding of the interplay between surface and internal drying, improving the reliability of refractive index-based drying assessments in industrial applications.
4.2 The imaginary part of complex refractive indexThe imaginary part of the complex refractive index was measured only after the coatings had fully dried and transitioned into the solid state. Consequently, the present study does not directly provide dynamic data on the imaginary component throughout the drying process.
The transmission spectrum ranging from 350 to 700 nm was measured at 2 nm intervals using the OL Series 750 spectrophotometer with an HSD 300 detector. The transmission data were used to calculate the absorption coefficient spectrum using Eq. (6), with the results plotted in Fig. 3.
Fig. 3
Absorption coefficient results for samples as a function of wavelength
It can be observed in Fig. 3 that Unica Akva Lacquer and Unica Super 90 lacquers consistently show higher absorption coefficient values across the entire measurement range. This suggests that it has a dense pigment concentration or other components that strongly absorb light, which could be beneficial for applications requiring robust coloration or UV protection. Color C46 Clear Varnish demonstrates the lowest absorption coefficient values throughout the spectrum among all the samples, consistent with its clear nature. This is typical for a varnish intended to provide protection without altering the appearance of the underlying material significantly. Loctite 60 Sec Glue exhibits moderate absorbance, which less prominent dependency on wavelength compared to the lacquers. This indicates that it might contain some colored components or additives that absorb light, though less than the lacquers. Loctite Super Glue has the low absorption coefficients, indicating very few absorbing components, which aligns well with its intended use where transparency and minimal interference with light are desired.
The extinction coefficient, which is the imaginary part of the refractive index (k), can be calculated from the absorption coefficient using Eq. (5). Results are presented in Table 2. The extinction coefficient values of various samples range from 0.00002 to 0.00037 at a wavelength of 589 nm. These values are relatively low, which is typical for substances used to minimize visual impact or maximize transparency. Generally, for films, extinction coefficients below 0.0001 are considered negligible. Thus, low values in the imaginary component of the complex refractive index indicate high optical transparency. Values of k above 0.0003 result in a slight color tint.
Table 2 Comprehensive complex refractive index for samples in liquid and solid states during the drying process at 589 nmIn summary, the observed shift in the refractive index reflects a gradual increase in material density as the drying proceeds, consistent with the expected physical transformation from a solvent-rich liquid phase to a solid polymer network. This transformation is not merely a passive loss of solvent, but a complex interaction of diffusion, evaporation, and molecular reorganization. Understanding how these microscopic events influence macroscopic optical properties can inform the design of coatings with tailored refractive properties—for instance, anti-reflective films, optically clear adhesives, or high-gloss lacquers. In addition, temporal refractive index profiles may serve as indicators of in-process anomalies—such as non-uniform curing or premature surface hardening. While this study used consistent drying conditions, future work should explore how varied drying environments affect refractive index development and final optical performance.
Comments (0)