
Remember me
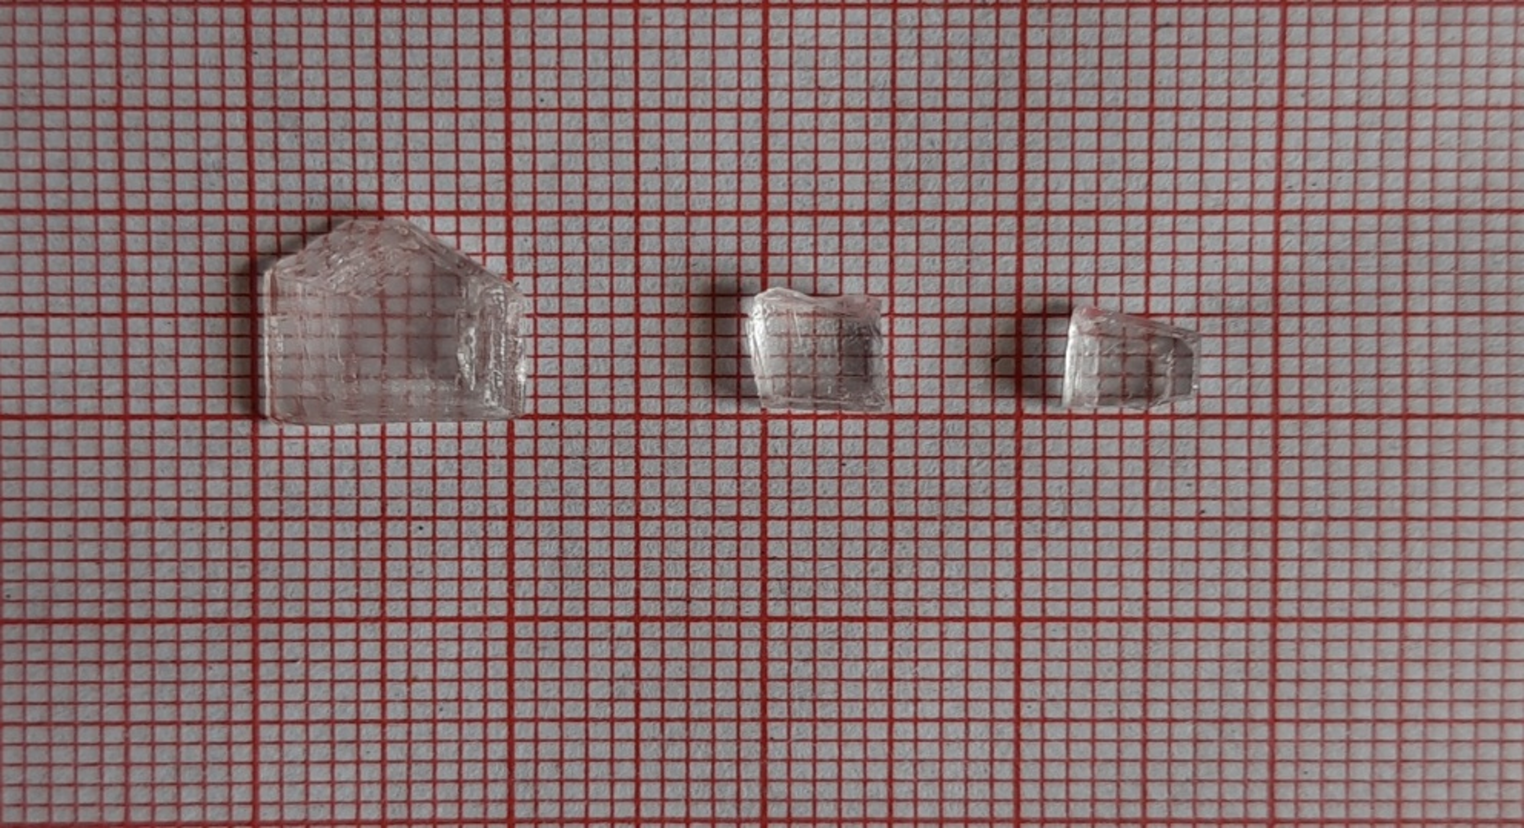
To prepare the nano-scale artifact samples, the first pillar array of the photoresist was fabricated using an electron-beam lithography system (JEOL JBX-9300FS) with an acceleration voltage of 100 kV. Each pillar had a cross-section of 50 nm \(\times\) 50 nm and a height of 100 nm; they were positioned on a 100 nm \(\times\) 100 nm square grid that filled a 100 \(\mu\)m \(\times\) 100 \(\mu\)m square area. As shown above, the rinsing step induced the random collapse of the resist pillars. We prepared 100 unique samples using the pillar-array collapse process. Subsequently, the sample was etched with an HBr-based gas using inductively coupled plasma-type reactive-ion etching, and the resist was stripped by oxygen ashing. In addition, a larger marker structure was fabricated next to each nanostructure for alignment during observation.
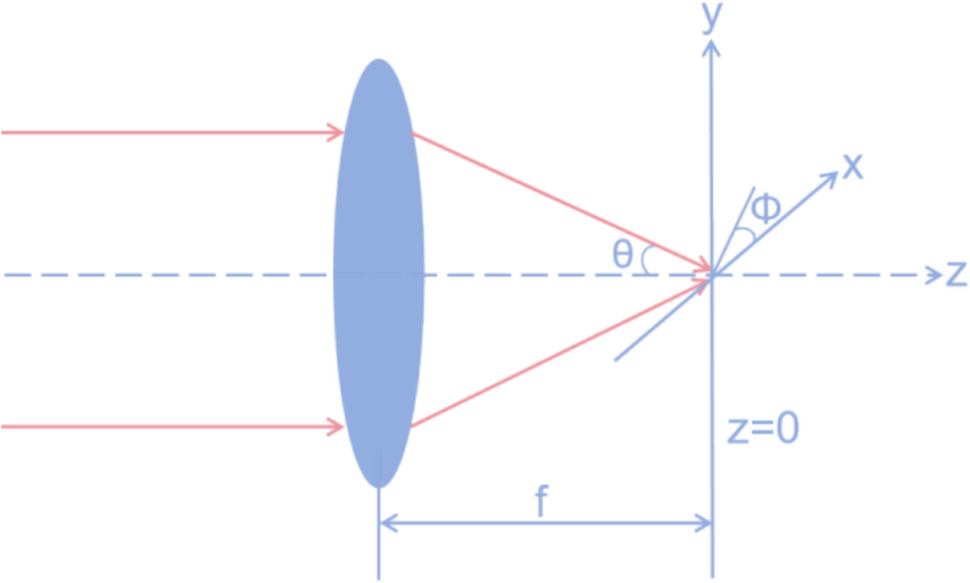
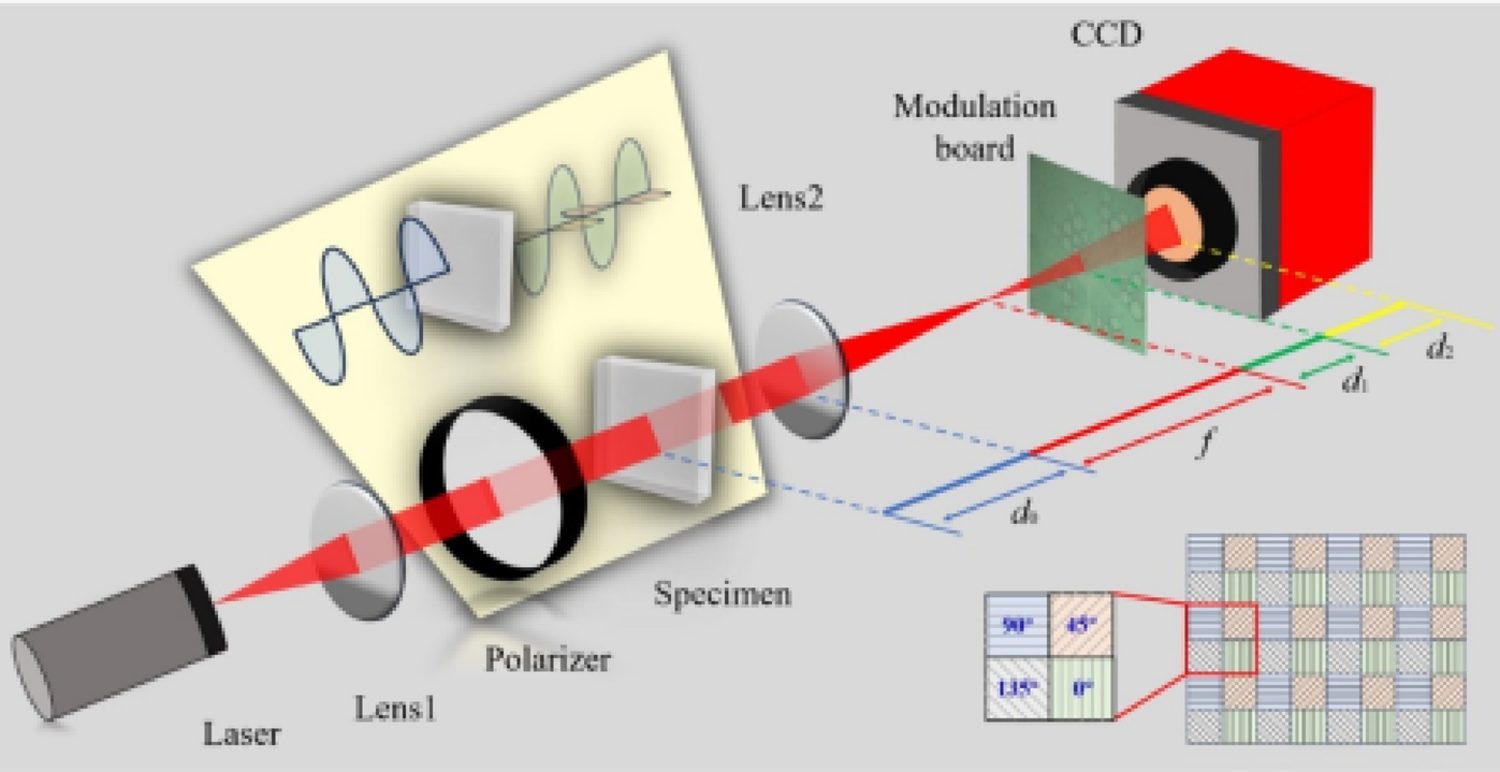
Figure 2(a) shows the experimental setup, which was built following the concept of NAM, as shown in Fig. 1. A z-scanning actuator (THK Precision, PFVW2025-200U-N) was connected to the interference objective lens at a 10\(\times\) magnification rate (Nikon, CF IC EPI Plan DI), and it was scanned in the height direction with a 5 nm resolution under a white light source (Sigma Koki, SLA-100B). Furthermore, image interference via the objective lens was obtained using an image sensor (Imaging Source, DMK33UP1300). The illumination and detection setups were connected using a coaxial unit (Sigma Koki, OUCI-3). A sample stage consists of xy-, z-, and \(\theta\)-axis, and goniometer stage to appropriately adjust position of a sample during the observation. In this experiment, the pitch of the height-direction scanning was set to 1 mV/step, and 301 images were obtained for each single scanning stroke with a sample. An example of an interference image obtained using a nano-scale artifact and a line profile of the image are shown in Fig. 2(b). Because it was obtained using our lower resolution setup, a precise hieght distribution data cannot be obtained; however, it is expected to indicate their own identity of samples.
Fig. 2
a Photograph of the experimental setup. b An interference image of a nano-scale artifact sample obtained with a 10\(\times\) interference objective lens and the line profile of a part of the image (inset)
As the result of the observation process by the setup described above, the target data under authentication, denoted by A(i, j), is obtained. For the authentication, the correlations between A(i, j) and the reference data stored in the database of the NAM system, denoted by B(i, j), are calculated by considering the Pearson correlation coefficient as follows:
$$\begin R=\frac[A(i,j)-\bar][B(i,j)-\bar]}[A(i,j)-\bar]^2}\sqrt[B(i,j)-\bar]^2}}, \end$$
(1)
where \(\bar\) and \(\bar\) are the average values of A(i, j) and B(i, j), respectively. Moreover, to modify the minute misalignment of the lateral position, the image was shifted between one and three pixels to the upper, lower, left, and right sides to correct the positional shifts of each obtained image, and R was calculated for each shifted position. The maximum value of R from these positions is used to quantify the similarity between A(i, j) and B(i, j). R values were calculated for several image pairs. Then each R is checked whether higher or lower than a value of authentication threshold. In case R is higher than an authentication threshold, corresponding A(i, j) is accepted, and in the case of lower, corresponding A(i, j) is declined.
Generally, two error rates, FMR and FNMR, were evaluated as indicators of individuality and readout stability of authentication, respectively. Both FMR and FNMR are calculated with several threshold value from 0 to 1.0. In this study, all 80 samples were used to calculate the FMR. The correlation coefficients between all 80 data were mutually calculated using Eq. (1). In this case, if the value is higher than a specified threshold, corresponding correlation is determined as error, because it means that different data from a reference data are mistakenly accepted. Then among all correlations, count the number of errors and calculate error rate. Namely, FMR becomes higher by smaller threshold and becomes lower by larger threshold. On the other hand, to calculate the FNMR, each of the 14 samples was measured 15 times for each. The correlation coefficients between 15 data of each sample were calculated. In this case, if the value is lower than a specified threshold, corresponding correlation is determined as error, because it means that the same data with a reference data is mistakenly declined. Then among all correlations, count the number of errors and calculate error rate. Namely, FNMR becomes lower by smaller threshold and becomes higher by larger threshold.
Two solid curves in Fig. 3 show the FMR and the FNMR with several thresholds from 0 to 1.0. In addition, the dashed lines are the approximation curves of the respective experimental results obtained using the estimation algorithm of the minimum mean square error (MMSE). Generally, authentication performance is qualitatively evaluated by the vertical value of the cross point with the FMR and FNMR curves, which is defined as the equal error rate (EER). It is evident that the two curves do not cross in the range shown in Fig. 3; therefore, the EER of the proposed system is much lower than 1 \(\times\) 10\(^\) by setting an authentication threshold as a range from 0.2 to 0.4. Note that scale of FMR is relevant to number of sample variations. On the other hand, scale of FNMR considers number of readouts of individual targets. Therefore, to precisely confirm the actual EER, much more interference images of various samples must be obtained many times to describe longer FMR and FNMR curves.
Fig. 3
Evaluation of authentication performance with FMR and FNMR curves
In practical use of NAM system, size of reference images to be stored in the database is preferred to be smaller for quicker use. FMR and FNMR were further evaluated by intentionally degrading the spatial resolution of the interference images to decrease the data size of each image. Specifically, the obtained data were rounded off at 12, 45, and 180 kB from the 705 kB of the original image. Certain trimmed images after the degradation are shown in Fig. 4(a)\(\sim\)(d). Evidently, the blur increases by degrading the image resolution. A similar process was performed to calculate FMR and FNMR for the above demonstration. The resulting FMR are represented by the solid and dotted curves in Fig. 5 as same assignments as Fig. 4. The same depictions were used for the FNMR.
Fig. 4
Certain trimmed images of a the original interference image, rounded off at b 180, c 45, and d 12 kB of the original image
Fig. 5
Evaluation of authentication performance with FMR and FNMR with several size of interference images
As shown, the FMR curve was shifted to the right with the degradation. Simultaneously, the FNMR curve was similarly shifted to the same side. Namely, the range size of appropriate threshold is similar between before and after the degradation. By the degradation, accepted number of false images becomes increased. Therefore, FMR curve was shifted to the right. On the other hand, declined number of true images becomes increased. Therefore, FNMR curve was also shifted to the right. Consequently, the authentication performance of this technique remained unaffected by the extent of the image size reductions. Of course, with further reduction, the stability of the readouts improves; however, the distinctiveness of each interference image decreases. Specifically, the position of the FNMR curve remains fixed, while the FMR curve shifts further to the right. As a result, the EER inevitably increases significantly.
Comments (0)