
Remember me
Experiments were conducted to study the effects of different concentrations of xenon on the V‒I characteristics and electrical properties of tethered membranes on the basis of the methods described in our previous work (Alobeedallah et al. 2022a, b). Figure 2 shows that the incorporation of xenon into the tethered lipid membrane caused a decrease in membrane conductance.
Fig. 2
Effects of xenon on the V‒I curves of T10 (10% tethers) Am199 bilayers. Error bars represent the standard deviation calculated from four experimental runs. Error bars are shown for one data set to enhance figure clarity
Figure 2 also shows that the initial current step, which is due to the capacitive charging current, is decreased by xenon, suggesting that the membrane capacitance has decreased. The membrane capacitance was calculated via the V‒I curve shown in Fig. 2. Given that Q = Cm × V, where Q is the charge stored in the membrane capacitance (C) when a voltage (V) is applied. When the applied voltage increases with time, dQ/dt = C × dV/dt = current (i), where dV/dt = 100 V/S, and the current captured at the onset of the potential ramp for only the lipid bilayer (no xenon) was 2.4*10–6 Amps, as shown in Fig. 1. Cm was then calculated and had a value of 24 nF (11.4 mF /m2 for an area 2.1 × 10⁻⁶m2. It should be mentioned here that the initial step in the bilayer formation process confirms the presence of a lipid bilayer. If a bilayer is not formed, the capacitance at the start of the trace will be in the range of hundreds of nF, indicating the capacitance of a bare electrode without a bilayer (see Appendix B) (Alobeedallah et al. 2020).
For tBLM with incorporated xenon, the Cm was found to be 20 nF (10 mF /m2 for an area 2.1 × 10⁻⁶m2) (both 10 and 30% xenon had approximately similar Cm values). The decrease in the tBLM capacitance upon the addition of xenon is presumably due to an increase in the membrane thickness. The capacitance and conductance data suggest that xenon molecules affect the internal physical structure of tBLM and consequently also alter the electrical conduction properties of bilayers.
To study the effect of xenon on pore formation, the V‒I curve was divided into three regions on the basis of its linearity: the low-voltage region, the transition region and the high-voltage region, as shown in Fig. 3. Figure 3 shows that both the low-voltage region and the high-voltage region had approximately linear V-I characteristics. Graphs of the conductance of tBLM with and without xenon at low and high voltages are presented in Fig. 4.
Fig. 3
V-I curves of T10 (10% tethers) Am199 bilayers divided into three regions on the basis of linearity: the low-voltage region, the transition region and the high-voltage region
Fig. 4
Effects of xenon on the low- and high-voltage conductance of T10 (10% tethers) Am199 bilayers
Figure 4 indicates that the membrane conductance at low voltage is not substantially affected by xenon. At high voltage, the membrane conductance is decreased by xenon, but at higher concentrations, it does not further decrease with increasing xenon.
The V–I characteristic curves revealed that the general anaesthetic xenon had the opposite effect to the local anaesthetic Benzyl Alcohol (BZA) on the membrane conductivity of tBLM (Alobeedallah et al. 2016). BZA was found to increases membrane conductivity while xenon tends to decrease the membrane conductivity. This is consistent with the action of many general anaesthetics, which tend to reduce membrane conductivity.
As mentioned previously, xenon has a strong affinity for hydrophobic environments. Therefore, it preferentially localises in the hydrophobic core of the bilayer below the lipid head groups (Pope et al. 1986). The localisation of xenon in the hydrophobic core of the bilayer has substantial effects on the lipid hydrophobic acyl chains. Booker and Sum (2013) and Stimson et al. (2005) reported that xenon molecules create a more constrained and ordered environment for lipid hydrophobic acyl chains, increasing the ordering parameter of the acyl chains. This change is normally associated with increased lipid packing and a decreased area per lipid molecule. Thus, xenon affects lipid bilayers by increasing the bilayer thickness and decreasing the area per lipid. This increase in thickness can be entirely attributed to an increase in the gap between the terminal carbons.
The condition for equilibrium between the entropy and energy for the lipid molecules forming lipid bilayers and the lipid monomers can also be used to explain the effect of xenon on lipid bilayers. The lipids packed in the bilayer are in chemical equilibrium with lipid monomers. The chemical potential for the molecules in these two states must be the same. The equilibrium condition can be simplified to:
$$\mu _ + kT }X_ = \mu m_ + \gamma m a,$$
(1)
where μ 1,0 and μm,0 are the standard chemical potentials for the monomer and bilayer, respectively. X1 is the mole fraction of the monomer, a is the surface area per molecule, and γm is the interfacial free energy per unit area. The interfacial free energy of the membrane in contact with aqueous media, γm, is a very important parameter that affects the stability and electrical properties of the membrane (Coster 2003). The value of γm of such a bilayer is given by Eq. (2):
$$\gamma m = \frac - \mu m_ + kT }X_ }}$$
(2)
As discussed earlier, the absorption of xenon molecules into the lipid bilayer is expected to decrease the area per lipid molecule. Therefore, a decrease in the area term on the right-hand side of Eq. (1) will occur. To maintain the equilibrium in the chemical potential between the two states of lipids, the interfacial free energy of the membrane surface γm is expected to increase. Thus, xenon can affect the electrical properties of tBLM by increasing the interfacial free energy of the membrane surface. By increasing the interfacial free energy, xenon could potentially alter the formation of pores in the lipid bilayer structure and hence electrical conductivity of the membrane, which is dominated by the presence of and size, of such pores. In addition, according to Eq. (1), the decrease in the surface area per molecule is also expected to cause an increase in the standard chemical potential for the bilayer μm,0 to maintain equilibrium between the two states.
Effect of Xenon on Tethered Lipid Membranes with Different Tethering DensitiesPrevious work on the effect of xenon on tBLM used T10 (10% tethers) tethered membranes. The effects of xenon on high-tether-density T100 membranes (100% tethers) and on low-tether-density T1 membranes (1% tethers) are presented.
Figures 5, 6 and 7 show the effects of xenon on T1 (1% tethers), T10 (10% tethers) and T100 (100% tethers) tethered membranes, respectively. Xenon reduced the conductivity of all the membranes. However, as the tethering density decreased, xenon had a greater effect on tBLM. This effect was most noticeable on the T1 tethered membranes. Xenon had a lesser effect on the T10 membrane than on the T1 membrane and had the lowest effect on the T100 membrane. Xenon is not expected to induce swelling of the membrane when the lipid bilayers are fully tethered, (T100) as the tethers restrict membrane expansion. As the tethering density of the membrane increases, fewer and smaller pores exist in the tBLM; hence, the T100 bilayers have almost no pores or at least very small pores that cannot grow when voltages are applied. At higher tethering densities, the lateral movement of lipids and gramicidin molecules is inhibited. This interferes with the dimerisation of gramicidin to form conductive channels. Xenon also affects the pores in the membrane, and a greater tethering density further restricts the lateral diffusion properties of gramicidin and the dimerisation process. Thus, xenon is expected to have a reduced effect on the conductance of these membranes.
Fig. 5
Effects of xenon on T1 (1% tethers) Am199 bilayers
Fig. 6
Effects of xenon on T10 (10% tethers) Am199 bilayers. This is a representation of Fig. 2 at different scales to aid in comparison with the 1 and 100% tether data
Fig. 7
Effects of xenon on T100 (100% tethers) Am199 bilayers
To obtain further details on pore formation and sizes in tBLM with incorporated xenon, conductance‒temperature dependence measurements were performed, as discussed below.
Conductance–Temperature Dependence MeasurementsThe conductance–temperature dependence curve of tethered lipid membranes with incorporated xenon is shown in Fig. 8. These data were used to calculate the activation energy for electrical conduction through lipid bilayers with incorporated xenon, which was then used to calculate the properties of the membrane pores. The activation energy and the Born energy were calculated via Parsegian’s model of the translocation of ions through existing transmembrane pores. The methods used to calculate the born energy and the membrane pore properties were explained in detail in our previous work (Alobeedallah et al. 2022a, b). A brief summary of the method is also included in Appendix A.
Fig. 8
Conductance–temperature dependence curves of tethered lipid bilayers with xenon
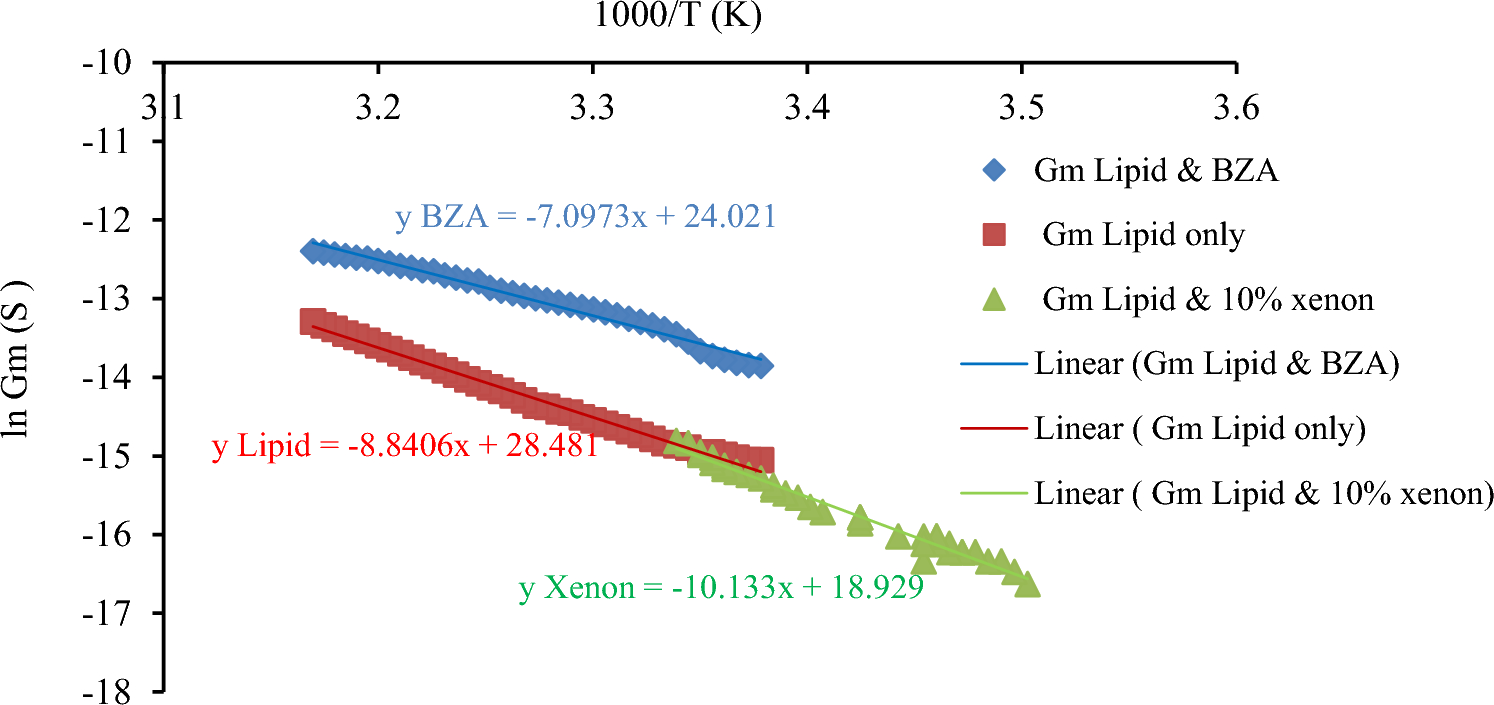
The Conductance–Temperature Dependence Measurements of Tethered Lipid Membranes with Incorporated Xenon at Low VoltageFigure 9 presents the Conductance–temperature dependence curves of tethered lipid-only bilayers at low voltages, tethered lipid bilayers with xenon and tethered lipid bilayers with BZA.
Fig. 9
Conductance–temperature dependence curves of tethered lipid-only bilayers at low voltages, tethered lipid bilayers with xenon and tethered lipid bilayers with BZA
The activation energy for charge translocation can be calculated via the Arrhenius equation:
where k is the Arrhenius rate constant, Ea is the activation energy, R is the gas constant, and T is the temperature in Kelvin. A plot of ln k versus 1/T then yields \(\frac\) from the slope.
The conductance–temperature dependence curve of tBLM with incorporated xenon had a slope of approximately 10, as shown in Fig. 8. The total activation energy (Ea) for electrodiffusion through a tBLM with 10% xenon was then calculated via Eq. (3) and found to be ~ 84 kJ/mol. From this, the Born energy was calculated and found to be ~ 66 kJ/mol (see Appendix A). The Born energy of tBLM with incorporated xenon is greater than that of lipid-only bilayers, which was previously calculated as ~ 55 kJ/mol (Alobeedallah et al. 2022a, b). The average pore size in the tBLM structure was then calculated and found to be ~ 3*10–11 m (see Appendix A). This is almost tenfold smaller than the pores in tBLM alone and in tBLM with 50 mM BZA. Therefore, the increase in the activation energy for electrical conduction through lipid bilayers with incorporated xenon implies a small pore size. Moreover, the localisation of xenon molecules within the hydrophobic core of the lipid bilayer increases the hydrophobic nonconductive properties within the bilayers due to the inert hydrophobic properties of xenon molecules, which could lead to an increase in the activation energy.
For a 5 nm thick lipid bilayer with incorporated xenon, the partition coefficient \(_}\) was calculated and found to be ~ 2*10–12 (see Appendix A). Next, the conductivity of the pore \(_\) was calculated and found to be ~ 9*10–19 S/m2 (surface area 2.1*10–6 m2), which is much lower than the conductivity of lipid bilayers with 50 mM BZA at 2*10–16 S/m2 (surface area 2.1*10–6 m2) (see Appendix A).
\(_\) for tBLM with incorporated xenon was obtained from the slope of the V–I curve at low voltage shown in Fig. 3. \(_\) was found to be 9*10–7 S (0.4 S/m2). The number of pores that exist in the lipid bilayer with incorporated xenon was then calculated and found to be 2*1023 pores/m2 (surface area 2.1*10–6 m2).
Table 1 presents a comparison between the activation energy data of lipids only, lipids and 50 mM BZA and the results of Xenon’s work.
Table 1 The activation energy and pore properties of tethered membranes, tethered membranes with 50 mM BZA and tethered lipid membranes with 10% xenonThe Conductance–Temperature Dependence Measurements of Tethered Lipid Membranes with Incorporated Xenon at High VoltageThe V‒I curves of tBLM with xenon were measured at various temperatures via the same cooling protocol discussed earlier. This experiment was conducted to calculate the electrical properties of tBLM with incorporated xenon in the high-voltage region of the V‒I curve (Fig. 9).
Figure 10 shows the V-I curves of tBLM with incorporated xenon at different temperatures. The final regions (at high voltage) of the V‒I curves of tBLM with xenon at different temperatures were all parallel. This indicates that the activation energy at high applied voltages is approximately constant. Thus, neither the activation energy nor the pore properties could be calculated via V-I curves at various temperatures. This outcome is similar to earlier conclusions on the activation energy of tBLM (with incorporated BZA, cholesterol or lipids alone) in the high-voltage region (Alobeedallah et al. 2023). These results shed light on the important role that the potential difference across the biological membrane can play in determining the permeability of the membranes, consequently controlling many biological mechanisms.
Fig. 10
Effects of temperature on the V‒I curves of T10 (10% tethers) AM199 bilayers with Xenon
Figure 10 also shows a sudden increase in the current through tethered membranes with incorporated xenon at approximately 24 °C during the warming of the membrane. The membrane/xenon system was subsequently cooled to temperatures less than 24 °C (21 and 20 °C) in an attempt to recover the original V‒I curves of the tBLM with xenon measured at lower temperatures; however, the original V‒I curves from the tBLM before the sudden increase in the current were not recovered. This observation may be due to the total loss of xenon from the membrane at this relatively high temperature. This experimental observation highlights the fact that the solubility of xenon in lipid membranes is very sensitive to temperature. Therefore, the conductance–temperature plots are approximations only because at different temperatures, the membranes contain different amounts of xenon.
Comments (0)