
Remember me
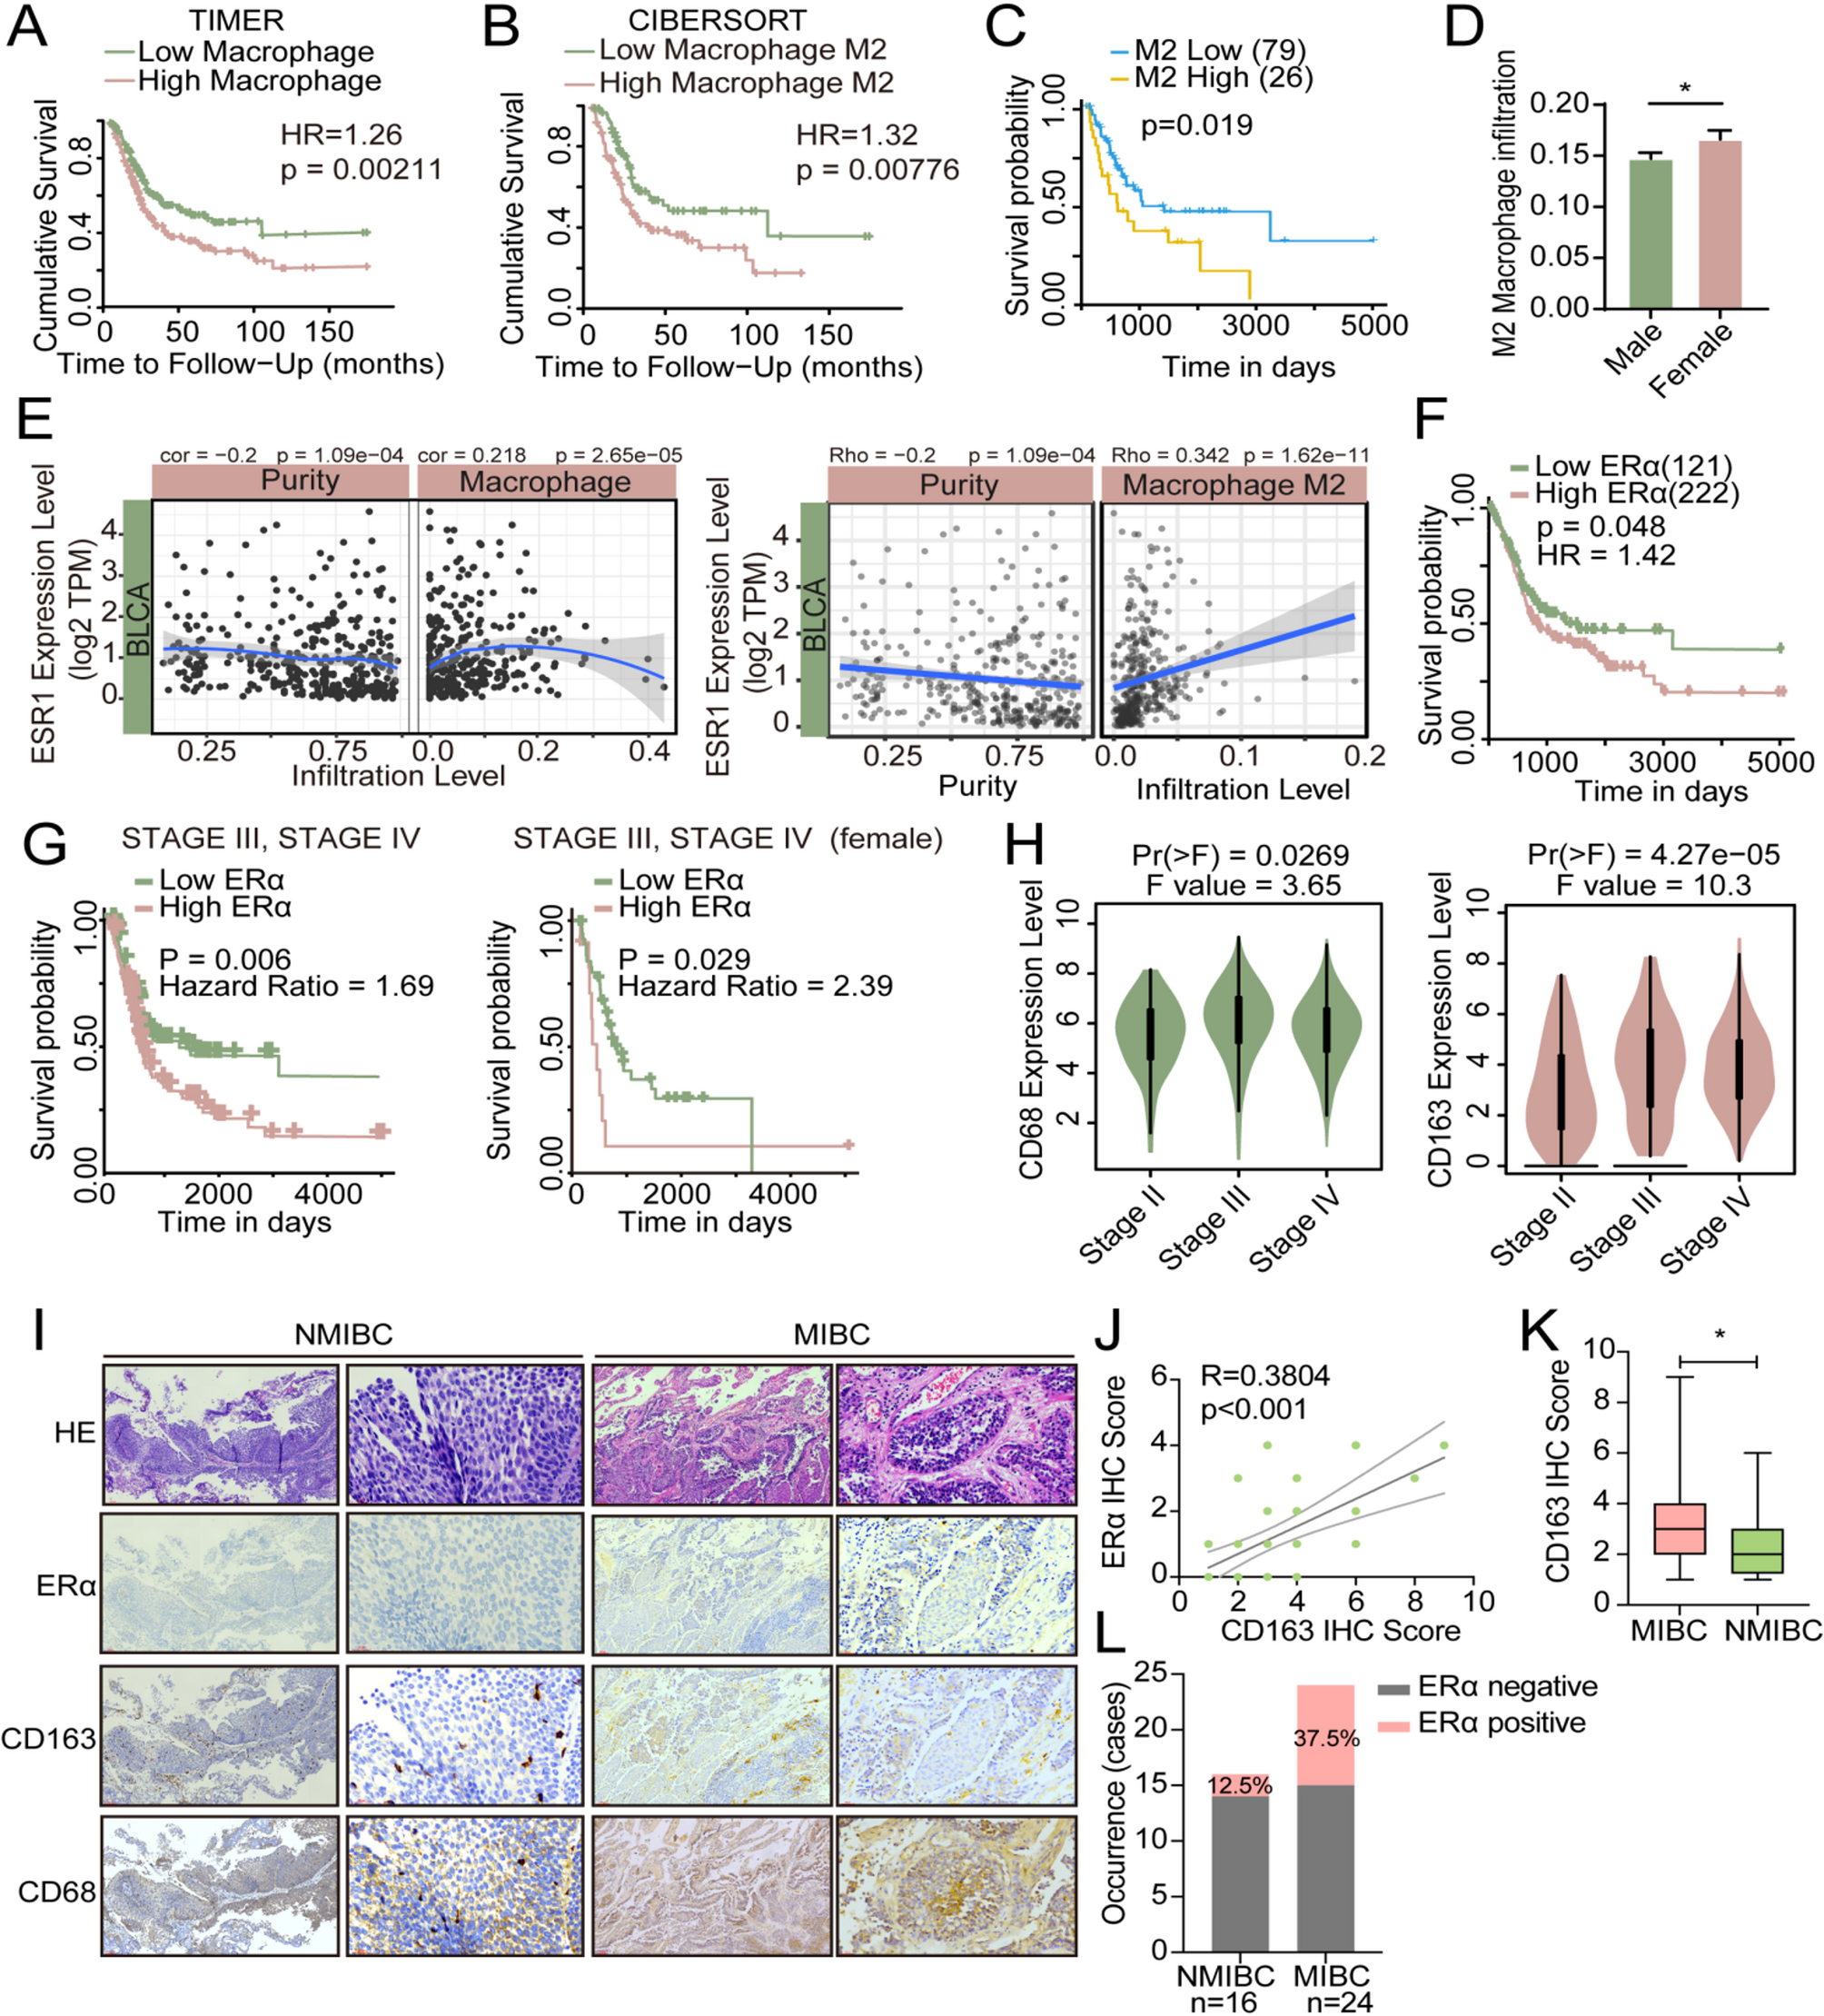


Macrophages constitute a prominent group of infiltrating immune cells in various solid tumors, including BLCA. To investigate the role of macrophages within the tumor microenvironment and their impact on BLCA progression, we initially assessed the prognostic significance of macrophage infiltration using TIMER2.0 [21]. Our analysis revealed that BLCA patients exhibiting high levels of macrophage infiltration experienced poorer survival outcomes compared to those with lower levels of macrophage infiltration (Fig. 1A). A similar pattern was observed when evaluating the prognostic value of M2 macrophage infiltration(Fig. 1B). Given the disparities in BLCA incidence and prognosis between genders, we further scrutinized the prognostic relevance of M2 macrophage infiltration in male and female BLCA patients separately. Among female patients, those with elevated levels of M2 macrophage infiltration exhibited worse survival outcomes compared to their counterparts with lower levels (Fig. 1C), while in male patients, no significant difference was observed between the two groups (Sfig.1 A). Furthermore, our analysis unveiled that female BLCA patients displayed higher levels of M2 macrophage infiltration than their male counterparts (Fig. 1D). We proceeded to investigate the correlation between hormone receptors and macrophage infiltration using TIMER2.0. Our findings demonstrated a positive correlation between ESR1, the transcript gene of ERα, and macrophage infiltration as well as M2 macrophage infiltration in BLCA (Fig. 1E). However, M2 macrophage infiltration did not exhibit significant correlations with either ESR2 or AR expression (Sfig.1B).
By applying the online tool TRGAted, we analyzed the association between ERa expression and the survival of BLCA patients. According to TRGAted analysis results, BLCA patients with high ERα expression had poorer survival rates(Fig. 1F) [22]. Among patients with advanced BLCA in stage III and IV, patients with higher ERα expression had worse survival rates, especially female patients (Fig. 1G). However, in patients with BLCA at earlier stages (stage I and II), higher expression levels of ERα were associated with better survival (Sfig. 1 C). The above results suggested that ERα may play a different role in advanced BLCA compared with early-stage BLCA.
The expression of TAMs marker CD68 and CD163 was analyzed according to different clinical stages based on TCGA datasets. The results showed that the expression of these two markers was significantly increased in patients with stage III and IV compared to those in stage II (Fig. 1H). According to the results of our analysis of GSE13507, the expression of CD163 in primary BLCA tumors and recurrent tumors was positively correlated with the expression of ESR1 and was statistically significant (Sfig.1D). To elucidate the correlation between TAMs infiltration and ERα expression in BLCA, we detected the expression of CD68/CD163 and ERα in 40 BLCA human samples, including 24 muscle-invasive bladder cancer (MIBC) samples and 16 non-muscle-invasive bladder cancer (NMIBC) samples, and the results showed that the expression of ERα was positively correlated with TAMs infiltration (Fig. 1I-J). We also found that CD163 expression was significantly higher in MIBC than in NMIBC samples(Fig. 1K). The proportion of ERα-positive samples in MIBC is significantly higher than that in NMIBC(Fig. 1L).
Fig. 1
The expression of ERα is positively correlated with macrophage infiltration in BLCA. (A) Survival analysis of macrophage infiltration levels in BLCA patients. (B) Survival analysis of M2 macrophage infiltration levels in BLCA patients. (C) Prognostic value of M2 macrophage infiltration level in female BLCA patients. (D) Analysis of M2 macrophage infiltration levels in female and male BLCA patients. (E) Correlation between ESR1 gene expression and the level of macrophage infiltration (left) or M2 macrophage infiltration (right) in BLCA patients. (F) The prognostic value of ERα expression in BLCA patients analyzed using the TCGA database. (G) Prognostic value of ERα expression in BLCA patients (left) or female BLCA patients (right) in stage III and IV disease. (H) Expression of CD68 (Left) and CD163 (Right) in TCGA samples at different stages of BLCA. (I) IHC comparison of CD163/CD68 and ERα in human BLCA tissue samples. (J) The correlation between ERα and CD163 expression in human BLCA tissue samples. (K) Expression of CD163 in MIBC and NMIBC human samples. (L) Our statistical analysis of the occurrence of cases positive for ERα expression in MIBC and NMIBC human samples. Data is presented as the mean ± SD, *p < 0.05, **p < 0.01
TAMs increases ERα expression and promotes tumor cell vasculogenic mimicryOur previous studies showed that TAMs promote VM formation in renal cell carcinoma [23]. VM has been considered to be related to cancer invasion and metastasis and insensitivity or resistance to anti-vascular therapy [24, 25]. To investigate the relationship between TAMs and VM in BLCA, an in vitro co-culture system was established according to the methods in our published paper [23]. First, we examined the expression levels of ERα and the ability to form VM in four different bladder cancer cell lines (J82, TCC-SUP, T24 and UMUC-3). Results showed that the ERα expression level and VM formation ability of the TCC-SUP cell line were stronger than those of the other three cell lines, followed by UMUC-3 cells. The ERα expression level and VM formation ability of T24 cells are weaker than those of UMUC-3 and TCC-SUP cells, and J82 cells do not have the ability to form tubes in in vitro tests (Sfig.2 A-B). Therefore, we selected TCC-SUP cells and T24 cells for subsequent experiments.
As shown in Fig. 2A and B, co-culturing with macrophages significantly enhanced the ability of T24 and TCC-SUP cells to form both 2D and 3D VM structures. We assessed the expression of ERα in the BLCA cells after co-culture with macrophages, which revealed a significant increase in ERα expression (Fig. 2C). To validate the role of ERα in macrophage-induced VM formation, we conducted experiments to assess both 2D and 3D VM formation abilities. We compared TCC-SUP cells transfected with lentivirus generated from ERα-knockdown vector (ERα-KD) with TCC-SUP cells transfected with lentivirus from normal control vector (NC). T24 cells transfected with lentivirus generated from ERα-cDNA-vector (ERα-OE) were compared with T24 cells transfected with lentivirus from pWPI-cDNA-vector (NC). Results demonstrated that reducing the expression of ERα hinders the formation of 2D and 3D VM, while increasing its expression promotes VM formation (Fig. 2D-F).
To investigate whether macrophages enhance VM formation by upregulating ERα expression, rescue experiments were conducted. TCC-SUP cells were transfected with ERα-KD lentivirus, then co-cultured with or without macrophages. Subsequently, tumor cells were harvested for 2D/3D VM formation assays. Results indicated that knockdown of ERα reverses the enhanced VM formation induced by co-culturing with macrophages (Fig. 2G-H). In addition, we performed rescue experiments using the estrogen receptor inhibitor ICI-182,780. The results showed that inhibinting ERα by ICI-182,780 could also reverses the enhanced VM formation induced by co-culturing with macrophages (Sfig. 2 C). Further experiments were performed to examine the presence of the macrophage marker F4/80 and the VM marker PAS+/CD31- in BBN-induced BLCA tumors from ERα knockout (ERα-KO) and wild-type (WT) mice (Fig. 2I). The proportion of MIBC in WT samples was significantly higher than that in ERα-KO group (Fig. 2J). Our results showed that VM formation was significantly reduced in ERα-KO tumors compared with WT tumors (Fig. 2K) and there was a positive correlation between VM formation and macrophage infiltration (Fig. 2L).
Taking together, results from Fig. 2A-L and Sfig.2 A-C demonstrated that ERα acts as a mediator of TAMs-promoted VM formation.
Fig. 2
Macrophages increased ERα expression and promoted VM formation in BLCA cells. (A-B) Matrigel-coated 2D VM formation assay (A) and collagen-based 3D VM formation assay (B) were used to test the ability of VM formation in T24 and TCC-SUP cells with/without macrophages co-cultured. (C) Western blot assay for detecting ERα protein levels in T24 cells (left) and TCC-SUP cells (right) with/without macrophages co-cultured. (D) Western blot was performed to detect ERα expression in ERα-knockdown (ERα-KD) TCC-SUP cells (left) and ERα-overexpressing (ERα-OE) T24 cells (right). (E-F) 2D and 3D VM formation assay for testing the ability of VM formation in TCC-SUP cells transfected with NC/ERα-KD virus and in T24 cells transfected with NC/ERα-OE virus. (G-H) 2D and 3D VM formation assays were performed in TCC-SUP cells transfected with ERα-KD virus with/without macrophages co-cultured. (I) IHC staining of mouse macrophage-specific marker F4/80 and VM marker PAS(+)/CD31(-) in BLCA tissues of ERα-KO and WT mice. Black arrows indicate the VM channels surrounded by tumor cells. (J) The incidence of MIBC cases in ERα-KO and WT mice. (K) Comparison of the VM channels per high-quality frame (HPF) in ERα-KO and WT mice. (L) The correlation between VM formation and macrophage infiltration. For. A, B and E-H, quantitation is shown in the graph at right. Data is presented as the mean ± SD, *p < 0.05, **p < 0.01, ***p < 0.001
ERα promotes VM formation by upregulating CDH5To elucidate the mechanisms underlying how macrophage-induced ERα promotes VM formation, we identified twelve well-known VM-related molecules at both the mRNA level and protein level in T24 and TCC-SUP cells, whether cocultured with macrophages or not (Fig. 3A-B). The results revealed a significant increase in CDH5 expression in co-cultured T24 and TCC-SUP cells. To further investigate whether ERα can regulate CDH5, additional experiments were conducted. These experiments demonstrated that knockdown of ERα expression led to a decrease in CDH5 expression while overexpression of ERα had the opposite effects (Fig. 3C). Based on the online TCGA database [26], we analyzed the correlation between ESR1 and CDH5 in BLCA and found that there is a significant positive correlation between these two genes (Fig. 3D). Additionally, we examined the correlation between ESR1 and CDH5 across 34 different cancer types, which showed a significant positive correlation in most cancer types, including BLCA (Fig. 3E).
To confirm whether ERα promotes VM formation by regulating CDH5, rescue experiments were conducted, and the results demonstrated that knockdown of CDH5 expression in T24 cells reduced VM formation and reversed overexpression of ERα-induced VM formation (Fig. 3F, G). Conversely, overexpression of CDH5 in TCC-SUP cells enhanced VM formation and reversed knockdown of ERα-suppressed VM formation (Sfig. 3 A-B). Next, we used the online tool UALCAN to analyze the survival of BLCA patients based on the TCGA database, which showed that patients with high CDH5 expression had a poor prognosis, especially female patients (Sfig. 3 C). Furthermore, CDH5 expression was significantly higher in tumor tissues from patients at late (III and IV) stages compared to those at early (II) stages (Sfig. 3D). Next, we detected the ERα expression via IHC in BLCA samples, then separated patients into the ERα-positive group and the ERα-negative group (Fig. 3H). As shown in Fig. 3I-J, the expression of CDH5 and the formation of VM were much higher in ERα-positive tumor tissues than in ERα-negative tumor tissues. Moreover, the expression level of ERα was positively correlated with the level of CDH5 (Fig. 3K).
Taken together, results presented in Fig. 3A-K and Sfig. 3A-D suggest that ERα function to affect VM formation by modulating CDH5 expression.
Fig. 3
ERα promotes VM formation by upregulating CDH5. (A) The qRT-PCR assays for testing the 12 VM-related genes in T24 (left) and TCC-SUP (right) cells co-cultured with macrophages versus the control. (B) Western blot was performed to detect the 5 selected genes based on results from Fig. 3A. (C) Western blot was performed to detect ERα and CDH5 expression in ERα-overexpressing (ERα-OE) T24 cells (left) and ERα-knockdown (ERα-KD) TCC-SUP cells (right). (D) Correlation between CDH5 and ESR1 gene expression in BLCA. (E) Correlation between CDH5 and ESR1 gene expression in pan-cancer. (F-G) 2D and 3D VM formation assays were performed in T24 cells transfected as indicated in the upper panel. (H) IHC comparison of CDH5, ERα and PAS(+)/CD31(-) in ERα-positive expression group (n = 11) and ERα negative expression group (n = 29). (I) Comparison of VM channels per high-quality frame (HPF) in ERα-positive and ERα-negative groups. (J) Comparison of expression levels of CDH5 in ERα-positive and ERα-negative groups. (K) The correlation between the expression levels of CDH5 and ERα. ForFandG, quantitation is shown in the graph at right.Data are presented as means ± SD. *p < 0.05, **p < 0.01, ns = no significance compared with the control
Mechanism dissection of how ERα regulates CDH5 expression via transcriptional regulationTo investigate how ERα regulates CDH5 in BLCA cells, we examined the mRNA levels of CDH5 in TCC-SUP-ERα-KD versus TCC-SUP-NC cells and T24-ERα-OE versus T24-NC cells. The results showed that changes in CDH5 mRNA levels were consistent with changes in its protein expression (Fig. 4A), indicating that transcriptional regulation could be the primary mechanism. Next, ChIP assay was conducted to determine whether ERα can bind to the CDH5 promoter and regulate its transcription. Three predicted ESR1 response elements (EREs) were identified in a 3-kb region on the CDH5 promoter, which could potentially function through ERα binding (Fig. 4B, C). The ChIP results demonstrated that ERα binds to ERE2 in the CDH5 promoter region to initiate gene transcription (Fig. 4D). Then, we performed luciferase assays using pGL3 reporter plasmids containing either the wild-type (WT) or mutant (Mut) ERE2 to confirm the functionality of ERE2. The luciferase reporter gene activity assay showed that knockdown of ERα expression decreased luciferase activity in the WT reporter gene transfection group, while there was no significant change in the Mut group. Conversely, overexpression of ERα significantly increased luciferase activity only in the WT reporter-transfected group (Fig. 4E, F).
Together, the results presented in Fig. 4A-F demonstrate that ERα can transcriptionally regulate CDH5 expression in BLCA cells.
Fig. 4
ERα transcriptionally upregulated CDH5 expression. (A) qRT-PCR assays for detecting ERα and CDH5 in T24 cells overexpressed with ERα (left) and TCC-SUP cells transfected with ERα-knockdown virus (right). (B) Illustration of the predicted EREs on CDH5 promoter region. (C) ERE motif sequence. (D) CHIP assay was performed to detect the binding of ERα to ERE2 in the CDH5 promoter region. (E) The pGL3 reporter plasmids containing the wild-type (WT) or mutant (Mut) ERE2 were designed to perform luciferase reporter assay. (F) Luciferase reporter activity was measured and analyzed after transfection of WT or Mut ERE2 of the CDH5 promoter into T24 cells with NC/ERα-OE (left) and TCC-SUP cells with NC/ERα-KD (right). Data are presented as means ± SD. *p < 0.05, **p < 0.01, ns = no significance compared with the control
Mechanism dissection of how infiltrated macrophages increase ERα expression in BLCA cells: via IL-17 A-mediated epigenetic mechanismNumerous research indicates that cytokines secreted by macrophages can influence the biological functions of tumors [11, 27]. Our qRT-PCR analysis revealed a significant increase in ESR1 mRNA expression in T24 and TCC-SUP cells following co-culture with macrophages, suggesting that the upregulation of ERα may be controlled at the transcriptional level (Fig. 5A). We screened ten potential cytokines produced by macrophages in co-culture settings with or without BLCA cells (Fig. 5B). Subsequently, we examined these five elevated cytokines in T24 and TCC-SUP cells with or without co-culture with macrophages, ultimately identifying IL-17 A and TGFβ as promising candidates (Fig. 5C). Notably, a related study on cytokine regulation of ERα expression in endometrial cancer cells highlighted that IL-17 A could enhance ERα expression by stimulating ESR1 transcription [17]. This study also proposed that IL-17 A-induced ERα expression might be linked to TET1-mediated demethylation of the ESR1 gene promoter. In addition, our analysis of ESR1 promoter methylation levels using UALCAN (http://ualcan.path.uab.edu/) unveiled a significant reduction in ESR1 promoter methylation levels in BLCA tumors [28] (Sfig.4 A). Moreover, we assessed ESR1 promoter methylation levels in different clinical stages within the TCGA dataset, revealing substantial decreases in methylation levels in advanced stages (II, III, and IV) compared to stage I (Sfig.4B). Considering the above findings and our previous results, we propose the following hypothesis: macrophages might elevate ERα expression in BLCA cells through an epigenetic mechanism that involves IL-17 A-mediated TET1-dependent demethylation of the ESR1 promoter [29, 30].
Based on the above hypothesis, we sought to verify the regulatory role of IL-17 A in ERα expression by introducing an IL-17 A receptor antibody (IL17RA) into the co-culture system to block IL-17 A function. The results demonstrated that inhibiting IL-17 A function attenuated the macrophage-mediated upregulation of ERα expression in T24 and TCC-SUP cells (Fig. 5D). Subsequently, western blot assays confirmed that the addition of exogenous IL-17 A led to a time- and dose-dependent increase in ERα expression (Fig. 5E, Sfig.4 C). Based on the proposed mechanism, IL-17 A is believed to impact the demethylation of the ESR1 promoter through the TET1-mediated 5-hydroxymethylation pathway, consequently upregulating ERα expression. In order to exclude the direct regulation of CDH5 by IL-17 A and prove that IL-17 A in BLCA promotes CDH-5-dependent VM formation by specifically upregulating the expression of ERα, we added exogenous IL-17 A to ERα knockdown cells and detect the expression of CDH5. Results showed that knockdown of ERα expression reduces CDH5 expression with/without addition with exogenous IL-17 A (Sfig. 4D).
To investigate this further, we examined the expression of ERα in BLCA cells after knockdown of TET1 expression. Notably, TET1 knockdown significantly inhibited ERα expression and impaired VM formation (Fig. 5F, Sfig. 4E). Furthermore, TET1 knockdown in BLCA cells reversed the macrophage-induced upregulation of ERα expression and VM formation (Fig. 5G-H). We assessed the prognostic value of TET1 in BLCA using GEPIA [31], revealing that patients with high TET1 expression exhibited inferior survival, thereby providing additional evidence supporting its pro-tumor role in BLCA (Sfig. 4 F).
Fig. 5
Macrophages increase ERα expression in BLCA cells via IL-17 A-mediated epigenetic mechanism. (A) qRT-PCR assay for detecting ERα gene (ESR1) expression in T24 and TCC-SUP cells co-cultured with macrophages versus blank control. (B) qRT-PCR assay was used to test the cytokines and chemokines secreted by macrophages in macrophages co-cultured with T24 cells (left) versus blank control and in macrophages co-cultured with TCC-SUP cells (right) versus blank control. (C) Analysis of cytokines screened from Fig. 5B in T24 cells (left panel) and TCC-SUP cells (right panel) co-cultured with macrophage versus blank control. (D) ERα expression in T24 cells (left panel) and TCC-SUP (right panel) cells treated as indicated. (E) ERα expression in T24 cells (upper panel) and TCC-SUP cells (lower panel) treated with IL-17 A at 50ng/ml concentration at the different indicated times. (F) 2D VM formation assay was performed in TCC-SUP cells transfected with NC and TET1-KD virus. (G) ERα expression in T24 cells (left panel) and TCC-SUP cells (right panel) treated as indicated. (H) 2D VM formation assay was performed in T24 cells (upper panel) and TCC-SUP cells (lower panel) treated as indicated. For F and H, quantitation is shown in the graph at right. Data are presented as means ± SD. *p < 0.05, **p < 0.01, ns = no significance compared with the control
Tumor-derived exosomes regulated by ERα from BLCA cells promote M2 polarization and IL-17 A production via the pten/pakt pathwayTAMs play a key role in the inflammatory response and tumor microenvironment. The dual role of TAMs in BLCA depends on different polarization states classified as M1/M2 [11]. The interaction between macrophages and tumor cells is known to reshape the tumor microenvironment and promote tumor progression [32]. TAMs, particularly M2 type, are known to exert tumor-promoting functions within this microenvironment. According to the results in Fig. 1, it was found that the expression of ERα was positively correlated with the degree of infiltration of M2 macrophages. We thus hypothesized whether ERα is involved in regulating the M2 polarization of macrophages. To further test the hypothesis, we examined the expression of M1 and M2 markers in macrophages after coculture with or without BLCA cells. The results demonstrated a significant increase in most M2 markers following co-culture, while the levels of M1 markers were decreased (Fig. 6A). Subsequently, we detected the expression of M2 markers in macrophages after co-culture with T24 cells transfected with/without ERα-overexpression virus and TCC-SUP cells transfected with/without ERα-knockdown virus. As expected, the results showed that M2 markers were significantly increased in the T24 ERα-OE co-culture group, while M2 markers were significantly decreased in the TCC-SUP ERα-KD co-culture group, indicating that altering ERα expression in BLCA cells can effectively influence M2 macrophage polarization (Fig. 6B). According to previous studies, tumor-derived extracellular vesicles (EVs) containing small molecules such as microRNAs can mediate M2 macrophage polarization [33, 34]. To determine the involvement of tumor-derived exosomes in M2 macrophage polarization, the exosome inhibitor GW4869 was used to block the function of exosomes in co-culture system. The protein levels of exosome markers CD63 and CD9 were assessed using western blot, and the morphology of tumor cells-derived exosomes was examined by electron microscopy, all of which confirmed the presence of the exosomes we collected (Fig. 6C, Sfig.5 A). Results showed that the addition of GW4869 in the co-culture system could significantly block M2 polarization of macrophages (Fig. 6D) and the addition of exosomes from T24 ERα-OE cells significantly induced M2 macrophage polarization (Fig. 6E).
Given the feedback regulation of M2 macrophage polarization by ERα expression in BLCA cells, we investigated the potential underlying mechanisms. Numerous studies have implicated pAKT-mediated signaling pathways in the regulation of M2 polarization [33, 35]. Interestingly, the PTEN/pAKT axis has also been reported to regulate IL17 expression in macrophages [36]. To verify the involvement of the PTEN/pAKT axis in promoting M2 macrophage polarization, we examined the expression of PTEN and pAKT in macrophages treated with T24-CM and TCC-SUP-CM. The results showed that the addition of CM from both T24 and TCC-SUP decreased the expression of PTEN and increased the expression of pAKT in macrophages (Sfig. 5B). In addition, we found that T24 and TCC-SUP cells-derived exosomes can affect the PTEN/pAKT pathway in macrophages (Fig. 6F). The addition of GW4869 to the co-culture system deprived tumor cells of their ability to regulate the PTEN/pAKT pathway in macrophages, whereas providing exosomes reversed this deprivation (Fig. 6G). Furthermore, we assessed the expression of PTEN and pAKT in macrophages which were treated with exosomes collected from T24 ERα-OE cells and TCC-SUP ERα-KD cells. The results showed that PTEN expression was increased after the addition of T24 ERα-OE cells-derived exosomes and decreased after the addition of exosomes from TCC-SUP ERα-KD cells, while the expression of pAKT was changed opposite to that of PTEN (Fig. 6H). The mRNA expression of IL-17 A in macrophages exhibited changes consistent with the alteration of ERα expression in TCC-SUP and T24 cells, aligning with the reported transcriptional regulation of IL-17 A by the PTEN/pAKT pathway [36] (Fig. 6I). Also, KEGG pathway analysis revealed that PTEN negatively regulated IL17A production in BLCA (Sfig.5 C).
Taken together, the results in Fig. 6A-I suggest that ERα in BLCA cells can promote M2 polarization and IL-17 A production by regulating the PTEN/pAKT pathway in macrophages through exosomes.
Fig. 6
Tumor-derived exosomes regulated by ERα from BLCA cells can in turn promote M2 polarization and IL-17 A production via PTEN/pAKT pathway. (A) qRT-PCR for detection of the 11 M1/M2 macrophage markers in THP1 and co-cultured macrophages. (B) qRT-PCR for detection of the 7 selected M1 and M2 macrophage markers in macrophages co-cultured with T24 NC cells and T24 ER-OE cells (left), and in macrophages co-cultured with TCC-SUP-NC and TCC-SUP ERα-KD (right). (C) Western blot assay for detecting exosome markers CD63 and CD9 in exosomes collected from TCC-SUP treated with GW4869 (exosome-secreting inhibitor) versus blank control. (F) Western blot assay for PTEN, pAKT and AKT expression in macrophages treated with exosomes collected from T24 and TCC-SUP cells with PBS as control. (G) Western blot assay for PTE, pAKT and AKT expression in co-cultured macrophages treated as indicated. (H) Western blot assay for PTEN, pAKT and AKT expression in macrophages treated with exosomes collected from T24 NC cells and T24 ERα-OE cells (left panel) and macrophages treated with exosomes collected from TCC-SUP NC cells and TCC-SUP ERα-KD cells (right panel). (I) qRT-PCR assay for detection of IL-17 A expression in macrophages co-cultured with T24 NC cells and T24 ERα-OE cells (left) and macrophages co-cultured with TCC-SUP NC cells and TCC-SUP ERα-KD cells (right). Data are presented as means ± SD. *p < 0.05, **p < 0.01, ns = no significance compared with the control
Mechanism dissection of ERα down-regulation of pten/pakt pathway: direct targeting of 3’UTR of PTEN mRNA by miR-642a-5pWe observed that exosomes derived from BLCA cells promote M2 polarization and IL-17 A production in macrophages by modulating the PTEN/pAKT signaling pathway. We also found that altering ERα expression in BLCA cells did not change the expression of PTEN at mRNA levels in macrophages (Sfig.5D). As PTEN may be regulated at post-transcriptional level, we focused on miRNAs, well-known for their encapsulation in exosomes and their role in post-transcriptional regulation. Using bioinformatic analysis, we screened eight candidate miRNAs involved in PTEN regulation in BLCA (Fig. 7A), and their expression was assessed by modulating ERα expression in BLCA cells, following which we identified miR-642a-5p and miR-5754-3p as promising candidates (Fig. 7B). To confirm the functions of these candidates, we co-cultured T24 cells with macrophages following transfection with vector-based inhibitors targeting miR-642a-5p and miR-5754-3p. Subsequently, we evaluated PTEN/pAKT expression in macrophages. Intriguingly, macrophages co-cultured with T24 cells transfected with the miR-642a-5p inhibitor exhibited significant alterations in the PTEN/pAKT signaling axis compared to those co-cultured with T24-pLKO cells (Fig. 7C). Moreover, inhibition of miR-642a-5p in BLCA cells effectively reversed the influence of ERα on PTEN/pAKT in macrophages (Fig. 7D).
Based on the aforementioned findings, we conducted a luciferase reporter assay to provide further confirmation that miR-642a-5p post-transcriptionally downregulates PTEN expression by binding to its 3’UTR. First, we identified potential miR-642a-5p targeting sites within the PTEN 3’UTR using starBase v2.0 [37]. Subsequently, we utilized the psiCHECK2 vector to construct both wild-type (WT) and mutant-type (Mut) 3’UTR versions, with the latter lacking the miR-642a-5p target site (Fig. 7E). The luciferase assay results demonstrated that the luciferase activity in THP-1 cells transfected with the wild-type PTEN 3’UTR was significantly increased upon miR-642-5p inhibitor addition and decreased when miR-642-5p was overexpressed. Conversely, luciferase activity remained largely unchanged in THP-1 cells transfected with the mutant PTEN 3’UTR (Fig. 7F).
Given that the expression of miR-642a-5p in BLCA cells is influenced by ERα (Fig. 7B), we conducted a CHIP assay to investigate whether ERα could transcriptionally regulate miR-642a-5p expression by binding to its promoter. We also examined three predicted estrogen response elements (EREs) located within the promoter region of miR-642a-5p that could potentially bind to ERα. The results suggest that ERE1 may be the most promising candidate (Sfig.6 A-B). Subsequently, we performed a luciferase reporter assay to verify the functionality of ERE1 using pGL3 reporter plasmids containing either the wild-type (WT) or mutant (Mut) ERE1 (Sfig.6 C). The luciferase assay results demonstrated a significant increase in luciferase activity in the WT reporter gene transfection group upon ERα overexpression, whereas it sharply decreased following ERα knockdown. In contrast, there was no change observed in the Mut group (Sfig. 6D).
Fig. 7
ERα-regulated miR-642a-5p down-regulate PTEN/pAKT pathway by targeting of 3’UTR of PTEN mRNA. (A) Bioinformatics analysis of a set of potential miRNAs predicted to regulate PTEN in BLCA. (B) qRT-PCR assay for the 8 miRNAs expression in T24 cells transfected with NC or ERα-OE (left) and in TCC-SUP cells transfected withNC or ERα-KD (right). (C) Western blot assay for detection of PTEN and pAKT expression in macrophages with/without co-cultured T24 cells transfected with pLKO-vector, miR-6754-3p inhibitor and miR-642a-5p inhibitor. (D) Western blot assay for PTEN and pAKT expression in macrophages co-culture
Comments (0)